Transcription
Data Science with RDecision TreesGraham.Williams@togaware.com6th April 2014Visit http://onepager.togaware.com/ for more OnePageR’s.Decision trees are widely used in data mining and well supported in R (R Core Team, 2014).Decision tree learning deploys a divide and conquer approach, known as recursive partitioning.It is usually implemented as a greedy search using information gain or the Gini index to selectthe best input variable on which to partition our dataset at each step.This Module introduces rattle (Williams, 2014) and rpart (Therneau and Atkinson, 2014) forbuilding decision trees. We begin with a step-by-step example of building a decision tree using Rattle, and then illustrate the process using R begining with Section 14. We cover bothclassification trees and regression trees.The required packages for this module )## Error:######GUI for building trees and fancy tree plotPopular decision tree algorithmEnhanced tree plotsAlternative decision tree algorithmConvert rpart object to BinaryTreeWeka decision tree J48.there is no package called ’RWeka’library(C50)# Original C5.0 implementation.As we work through this module, new R commands will be introduced. Be sure to review thecommand’s documentation and understand what the command does. You can ask for help usingthe ? command as in:?read.csvWe can obtain documentation on a particular package using the help option of library():library(help rattle)This present module is intended to be hands on. To learn effectively, you are encouraged to haveR running (e.g., RStudio) and to run all the commands as they appear here. Check that you getthe same output, and you understand the output. Try some variations. Explore.
Data Science with ROnePageR Survival GuidesDecision TreesCopyright 2013-2014 Graham Williams. You can freely copy, distribute,adapt, or make commercial use of this module, as long as the attribution isretained and derivative work is provided under the same license.Copyright 2013-2014 Graham@togaware.comModule: DTreesOPage: 1 of 86
Data Science with R1OnePageR Survival GuidesDecision TreesStart RattleAfter starting R (perhaps via RStudio) we can start up rattle (Williams, 2014) from the R Consoleprompt. Simply load the rattle package then invoke the rattle(), as in:library(rattle)rattle()We will see the following Window. Notice the row of buttons, below which we see a series of tabsthat we will work through. Remeber, in Rattle, that after we set up a particular tab we mustpress the Execute button to have the tab take effect.Copyright 2013-2014 Graham@togaware.comModule: DTreesOPage: 2 of 86
Data Science with R2OnePageR Survival GuidesDecision TreesLoad Example Weather DatasetRattle provides a number of sample datasets. We can easily load them into Rattle. By default,Rattle will load the weather dataset.We load the dataset in two simple steps1. Click on the Execute button and an example dataset is offered.2. Click on Yes to load the weather dataset.We can use this dataset for predictive modelling to predict if it might rain tomorrow (aka statistical classification and supervised learning), or to predict how much rain we might get tomorrow(aka regression analysis).Copyright 2013-2014 Graham@togaware.comModule: DTreesOPage: 3 of 86
Data Science with R3OnePageR Survival GuidesDecision TreesSummary of the Weather DatasetThe weather dataset from rattle consists of daily observations of various weather related dataover one year at one location (Canberra Airport). Each observation has a date and location.These are the id variables for this dataset.The observations include the temperature during the day, humidity, the number of hours ofsunshine, wind speed and direction, and the amount of evaporation. These are the input variablesfor this dataset.Together with each day’s observations we record whether it rains the following day and howmuch rain was received. These will be the target variables for this dataset.Scroll through the list of variables to notice that default roles have been assigned the variables.Copyright 2013-2014 Graham@togaware.comModule: DTreesOPage: 4 of 86
Data Science with R4OnePageR Survival GuidesDecision TreesModel Tab — Decision TreeWe can now click on the Model tab to display the modelling options. The default modelling optionis to build a decision tree. Various options to tune the building of a decision tree are provided.Underneath rpart (Therneau and Atkinson, 2014) is used to build the tree, and many moreoptions are available through using rpart() directly, as we will see later in this Module.Copyright 2013-2014 Graham@togaware.comModule: DTreesOPage: 5 of 86
Data Science with R5OnePageR Survival GuidesDecision TreesBuild Tree to Predict RainTomorrowWe can simply click the Execute button to build our first decision tree. Notice the time takento build the tree, as reported in the status bar at the bottom of the window. A summary ofthe tree is presented in the text view panel. We note that a classification model is built usingrpart().The number of observations from which the model was built is reported. This is 70% of theobservations available in the weather dataset. The weather dataset is quite a tiny dataset inthe context of data mining, but suitable for our purposes here.A legend for reading the information in the textual representation of the decision tree is thenpresented.The legend indicates that each node is identified (numbered), followed by a split (which willusually be in the form of a test on the value of a variable), the number of entities n at that node,the number of entities that are incorrectly classified (the loss), the default classification for thenode (the yval), and then the distribution of classes in that node (the yprobs). The next lineindicates that a “*” denotes a terminal node of the tree (i.e., a leaf node—the tree is not splitany further at that node).The distribution is ordered by levels of the class and the order is the same for all nodes. Theorder here is: No, Yes.Copyright 2013-2014 Graham@togaware.comModule: DTreesOPage: 6 of 86
Data Science with R6OnePageR Survival GuidesDecision TreesDecision Tree Predicting RainTomorrowClick the Draw button to display a tree (Settings Advanced Graphics).Copyright 2013-2014 Graham@togaware.comModule: DTreesOPage: 7 of 86
Data Science with R7OnePageR Survival GuidesDecision TreesEvaluate Decision Tree—Error MatrixClick Evaluate tab—options to evaluate model performance. Click Execute to display simpleerror matrix. Identify the True/False Positives/Negatives.Copyright 2013-2014 Graham@togaware.comModule: DTreesOPage: 8 of 86
Data Science with R8OnePageR Survival GuidesDecision TreesDecision Tree Risk ChartClick the Risk type and then Execute.Exercise: Research how to interpret a risk chart. Explain the risk chart in one or two paragraphs.Copyright 2013-2014 Graham@togaware.comModule: DTreesOPage: 9 of 86
Data Science with R9OnePageR Survival GuidesDecision TreesDecision Tree ROC CurveClick the ROC type and then Execute.Exercise: Research how to interpret an ROC curve. Explain the ROC curve in one or twoparagraphs.Copyright 2013-2014 Graham@togaware.comModule: DTreesOPage: 10 of 86
Data Science with R10OnePageR Survival GuidesDecision TreesOther Evaluation PlotsExercise: Research the cost curve, the Hand plots, the Lift chart and the Precision and Sensitivity plots. Produce an example of each and explain each one of them in one or two paragraphs.Copyright 2013-2014 Graham@togaware.comModule: DTreesOPage: 11 of 86
Data Science with R11OnePageR Survival GuidesDecision TreesScore a DatasetClick the Score type to score a new dataset using model.Copyright 2013-2014 Graham@togaware.comModule: DTreesOPage: 12 of 86
Data Science with R12OnePageR Survival GuidesDecision TreesLog of R CommandsClick the Log tab for a history of all your interactions. Save the log contents as a script to repeatwhat we did.Copyright 2013-2014 Graham@togaware.comModule: DTreesOPage: 13 of 86
Data Science with R13OnePageR Survival GuidesDecision TreesFrom GUI to R—rpart()The Log tab shows the call to rpart() to build the model. We can click on the Export buttonto save the script to file and that script can then be used to rerun this model building process,automatically within R.The command to build the model is presented in the Log tab exactly as it is passed on to Rto invoke the model building. It takes a little time to understand it, and the remainder of thismodule covers interacting directly with R to achieve the same results.As we will soon learn we would write this sequence of command ourselves as:set.seed(42)library(rattle)library(rpart)ds - weathertarget - "RainTomorrow"nobs - nrow(ds)form - formula(paste(target, " ."))train - sample(nobs, 0.70 * nobs)vars - -c(1,2,23)model - rpart(form, ds[train, vars], parms list(split "information"))Copyright 2013-2014 Graham@togaware.comModule: DTreesOPage: 14 of 86
Data Science with R14OnePageR Survival GuidesDecision TreesPrepare Weather Data for ModellingSee the separate Data and Model modules for template for preparing data and building models.In brief, we set ourselves up for modelling the weather dataset with the following commands,extending the simpler example we have just ame ds id target risk ignore (vars ## [1]## [5]## [9]## [13]."weather"get(dsname)c("Date", "Location")"RainTomorrow""RISK MM"c(id, if (exists("risk")) risk)setdiff(names(ds), m""Cloud9am" - setdiff(vars, target) - nrow(ds))## [1] 366(numerics## [1]## [5]## [9]## [13]. - intersect(inputs, names(ds)[which(sapply(ds[vars], 9am" "WindSpeed3pm""Pressure9am" "Pressure3pm" - intersect(inputs, names(ds)[which(sapply(ds[vars], is.factor))]))## [1] "Evaporation"## [5] loud3pm""WindGustDir""WindGustSpeed" "Temp9am" - formula(paste(target, " .")))## RainTomorrow .length(train - sample(nobs, 0.7*nobs))## [1] 256length(test - setdiff(seq len(nobs), train))## [1] 110actualrisks - ds[test, target] - ds[test, risk]Copyright 2013-2014 Graham@togaware.comModule: DTreesOPage: 15 of 86
Data Science with R15OnePageR Survival GuidesDecision TreesReview the DatasetIt is always a good idea to review the data.dim(ds)## [1] 36624names(ds)## [1]## [5]## [9]## [13]## ndSpeed9am""Pressure9am""Temp9am"head(ds)#### 1## 2## 3## tion MinTemp MaxTemp Rainfall Evaporation .87.29.1tail(ds)#### 361## 362## 363## cation MinTemp MaxTemp Rainfall Evaporation str(ds)## 'data.frame': 366 obs. of 24 variables:## Date: Date, format: "2007-11-01" "2007-11-02" .## Location: Factor w/ 46 levels "Adelaide","Albany",.: 10 10 10 10 .## MinTemp: num 8 14 13.7 13.3 7.6 6.2 6.1 8.3 8.8 8.4 .## MaxTemp: num 24.3 26.9 23.4 15.5 16.1 16.9 18.2 17 19.5 22.8 .summary(ds)##Date## Min.:2007-11-01## 1st Qu.:2008-01-31## Median :2008-05-01## on:366: 0: 0: 0Copyright 2013-2014 Graham@togaware.comMinTempMin.:-5.301st Qu.: 2.30Median : 7.45Mean: 7.27MaxTempMin.: 7.61st Qu.:15.0Median :19.6Mean:20.6Module: DTreesOPage: 16 of 86
Data Science with R16OnePageR Survival GuidesDecision TreesBuild Decision Tree ModelBuld a decision tree using rpart(). Once the different variables have been defined (form, ds,train, and vars) this some command can be re-used.model - rpart(formula form, data ds[train, vars])Notice in the above command we have named each of the arguments. If we have a look at thestructure of rpart we see that the arguments are in their expected order, and hence the use ofthe argument names, formula and data is optional.str(rpart)## function (formula, data, weights, subset, na.action na.rpart, method,##model FALSE, x FALSE, y TRUE, parms, control, cost, .)model - rpart(form, ds[train, vars])Whilst they are optional, they can assist in reading the code, and so it is recommended that weuse the argument names in function calls.A textual presentation of the model is concise but informative, once we learn how to read it.Note this tree is different to the previous one, since we have randomly selected a different datasetto train the model.model## n 256#### node), split, n, loss, yval, (yprob)##* denotes terminal node#### 1) root 256 38 No (0.85156 0.14844)##2) Humidity3pm 71 238 25 No (0.89496 0.10504)##4) Pressure3pm 1010 208 13 No (0.93750 0.06250) *##5) Pressure3pm 1010 30 12 No (0.60000 0.40000)##10) Sunshine 9.95 14 1 No (0.92857 0.07143) *##11) Sunshine 9.95 16 5 Yes (0.31250 0.68750) *##3) Humidity3pm 71 18 5 Yes (0.27778 0.72222) *Refer to Section 5 for an explanation of the format of the textual presentation of the decisiontree. The first few lines indicate the number of observation from which the tree was built (n )and then a legend for reading the information in the textual representation of the tree.The legend indicates that a node number will be provided, followed by a split (which will usuallybe in the form of a variable operation and value), the number of entities n at that node, thenumber of entities that are incorrectly classified (the loss), the default classification for the node(the yval), and then the distribution of classes in that node (the yprobs). The distribution isordered by class and the order is the same for all nodes. The next line indicates that a “*”denotes a terminal node of the tree (i.e., a leaf node—the tree is not split any further at thatnode).Copyright 2013-2014 Graham@togaware.comModule: DTreesOPage: 17 of 86
Data Science with R17OnePageR Survival GuidesDecision TreesSummary of the Modelsummary(model)## Call:## rpart(formula form, data ds[train, vars])##n 256####CP nsplit rel error xerrorxstd## 1 0.2105301.0000 1.0000 0.1497## 2 0.0789510.7895 0.9474 0.1464## 3 0.0100030.6316 1.0263 0.1513#### Variable importance## Humidity3pmSunshine Pressure3pmTemp9am emp##765#### Node number 1: 256 observations,complexity param 0.2105##predicted class Noexpected loss 0.1484 P(node) 1##class counts:21838##probabilities: 0.852 0.148##left son 2 (238 obs) right son 3 (18 obs)##Primary splits:##Humidity3pm 71to the left, improve 12.750, (0 missing)##Pressure3pm 1011 to the right, improve 11.240, (0 missing)##Cloud3pm 6.5to the left, improve 11.010, (0 missing)##Sunshine 6.45 to the right, improve 9.975, (2 missing)##Pressure9am 1018 to the right, improve 8.381, (0 missing)##Surrogate splits:##Sunshine 0.75 to the right, agree 0.949, adj 0.278, (0 split)##Pressure3pm 1002 to the right, agree 0.938, adj 0.111, (0 split)##Temp3pm 7.6to the right, agree 0.938, adj 0.111, (0 split)##Pressure9am 1005 to the right, agree 0.934, adj 0.056, (0 split)#### Node number 2: 238 observations,complexity param 0.07895##predicted class Noexpected loss 0.105 P(node) 0.9297##class counts:21325##probabilities: 0.895 0.105##left son 4 (208 obs) right son 5 (30 obs)##Primary splits:##Pressure3pm 1010 to the right, improve 5.973, (0 missing)##Cloud3pm 6.5to the left, improve 4.475, (0 missing).In the following pages we dissect the various components of this summary.Copyright 2013-2014 Graham@togaware.comModule: DTreesOPage: 18 of 86
Data Science with R18OnePageR Survival GuidesDecision TreesComplexity ParameterWe can print a table of optimal prunings based on a complexity parameter using printcp().The data is actually stored as model ##Classification tree:rpart(formula form, data ds[train, vars])Variables actually used in tree construction:[1] Humidity3pm Pressure3pm SunshineRoot node error: 38/256 0.15n 256CP nsplit rel error xerror xstd1 0.21101.001.00 0.152 0.07910.790.95 0.153 0.01030.631.03 0.15Exercise: Research what the complexity parameter does. Explain/illustrate it in one or twoparagraphs.Copyright 2013-2014 Graham@togaware.comModule: DTreesOPage: 19 of 86
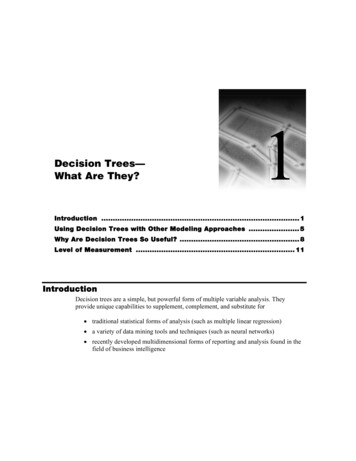
Data Science with R19OnePageR Survival GuidesDecision TreesComplexity Parameter PlotThe plotcp() plots the cross-validation results. Here we see a set of possible cost-complexityprunings of the tree. We might choose to prune using the leftmost complexity parameter whichhas a mean below the horizontal line.plotcp(model)size of tree241.0 0.9 0.70.8X val Relative Error1.11.21.31Inf0.130.028cpCopyright 2013-2014 Graham@togaware.comModule: DTreesOPage: 20 of 86
Data Science with R20OnePageR Survival GuidesDecision TreesMore Interesting Complexity BehaviourWe don’t see much of the true behaviour of the complexity parameter with out small dataset. Wecan build a more interesting model based on the larger weatherAUS dataset from rattle.If we build a default model then we can plot the complexity parameter as before.tmodel - rpart(form, weatherAUS[vars])plotcp(tmodel)size of tree2340.9 0.8X val Relative Error1.01.11 0.7 Inf0.0940.0450.019cpCopyright 2013-2014 Graham@togaware.comModule: DTreesOPage: 21 of 86
Data Science with R21OnePageR Survival GuidesDecision TreesMore Interesting Complexity Behaviour—cp 0We can set the cp argument to be 0, so that no pruning of the tree is performed.tmodel - rpart(form, weatherAUS[vars], control rpart.control(cp 0))plotcp(tmodel)size of tree12 19 43 72 105 227 386 647 8931130150317260.9 0.8 0.60.7X val Relative Error1.01.11Inf 0.002 0.000613e 040.000181e 047e 053.2e 050cpNotice that as we continue to build the model, by recursive partitioning, the model gets morecomplex but the performance does not improve, and in fact over time the model performancestarts to deteriorate because of overfitting.Copyright 2013-2014 Graham@togaware.comModule: DTreesOPage: 22 of 86
Data Science with R22OnePageR Survival GuidesDecision TreesMore Interesting Complexity Behaviour—Numeric ViewWe can look at the raw data to have a more precise and detailed view of the data. Here we onlylist specific rows from the complexity parameter table.tmodel cptable[c(1:5,22:29, 22324252627282980818283CP nsplit rel error xerrorxstd1.587e-0101.0000 1.0000 0.0064875.606e-0210.8413 0.8398 0.0060843.666e-0220.7852 0.7913 0.0059455.557e-0330.7486 0.7515 0.0058264.485e-0370.7264 0.7277 0.0057525.448e-04520.6682 0.6932 0.0056405.175e-04640.6598 0.6935 0.0056415.085e-04660.6588 0.6937 0.0056414.903e-04710.6561 0.6936 0.0056414.576e-04750.6541 0.6925 0.0056384.358e-04800.6518 0.6927 0.0056383.995e-04860.6491 0.6930 0.0056393.813e-04900.6474 0.6925 0.0056384.358e-0514360.4575 0.7882 0.0059364.086e-0514410.4573 0.7888 0.0059383.891e-0514880.4549 0.7916 0.0059463.632e-0515020.4542 0.7918 0.005947See how the relative error continues to decrease as the tree becomes more complex, but the crossvalidated error decreases and then starts to increase! We might choose a sensible value of cp from this table.Exercise: Choose some different values of cp based on the table above and explore the effect. Explain what initially appears to be an oddity about the different looking trees we get.Copyright 2013-2014 Graham@togaware.comModule: DTreesOPage: 23 of 86
Data Science with R23OnePageR Survival GuidesDecision TreesVariable ImportanceExercise: Research how the variable importance is calculated. Explain it in one or two paragraphs.model variable.importance## Humidity3pm##13.1468##Cloud3pm##3.6436.Sunshine opyright 2013-2014 Graham@togaware.comTemp9am Pressure9am4.64584.2920Rainfall0.1991Module: DTreesOTemp3pm4.2504Page: 24 of 86
Data Science with R24OnePageR Survival GuidesDecision TreesNode Details and SurrogatesExercise: In your own words explain how to read the node information. Research the concept of surrogates to handle missing values ad in one or two paragraphs, explain it.Copyright 2013-2014 Graham@togaware.comModule: DTreesOPage: 25 of 86
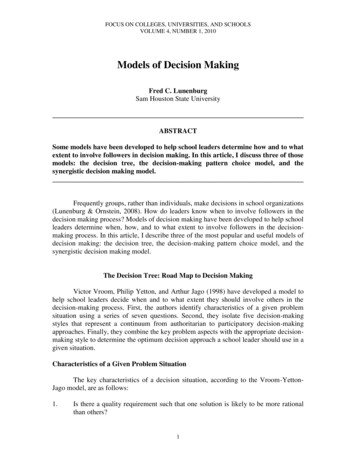
Data Science with R25OnePageR Survival GuidesDecision TreesDecision Tree PerformanceHere we plot the performance of the decision tree, showing a risk chart. The areas under therecall and risk curves are also reported.predicted - predict(model, ds[test, vars], type "prob")[,2]riskchart(predicted, actual, risks)Risk Scores0.90.80.7 0.10.60.50.40.30.2Lift10080Performance (%)36024025%120Recall (76%)Risk (79%)Precision0020406080100Caseload (%)An error matrix shows, clockwise from the top left, the percentages of true negatives, falsepositives, true positives, and false negatives.predicted - predict(model, ds[test, vars], type "class")sum(actual ! predicted)/length(predicted) # Overall error rate## [1] 0.2round(100*table(actual, predicted, dnn c("Actual", "Predicted"))/length(predicted))##Predicted## Actual No Yes##No 659##Yes 11 15.Copyright 2013-2014 Graham@togaware.comModule: DTreesOPage: 26 of 86
Data Science with R26OnePageR Survival GuidesDecision TreesVisualise Decision Tree as RulesWe can use the following function to print the paths through the decision tree as rules.asRules.rpart - function(model){if (!inherits(model, "rpart")) stop("Not a legitimate rpart tree")## Get some information.#frm - model framenames - row.names(frm)ylevels - attr(model, "ylevels")ds.size - model frame[1,] n## Print each leaf node as a rule.#for (i in 1:nrow(frm)){if (frm[i,1] " leaf "){# The following [,5] is hardwired - needs work!cat("\n")cat(sprintf(" Rule number: %s ", names[i]))cat(sprintf("[yval %s cover %d (%.0f%%) prob %0.2f]\n",ylevels[frm[i,] yval], frm[i,] n,round(100*frm[i,] n/ds.size), frm[i,] yval2[,5]))pth - path.rpart(model, nodes as.numeric(names[i]), print.it FALSE)cat(sprintf("%s\n", unlist(pth)[-1]), sep "")}}}asRules(model)#### Rule number: 4 [yval No cover 208 (81%) prob 0.06]##Humidity3pm 71##Pressure3pm 1010#### Rule number: 10 [yval No cover 14 (5%) prob 0.07]##Humidity3pm 71##Pressure3pm 1010##Sunshine 9.95#### Rule number: 11 [yval Yes cover 16 (6%) prob 0.69]##Humidity3pm 71##Pressure3pm 1010##Sunshine 9.95.Copyright 2013-2014 Graham@togaware.comModule: DTreesOPage: 27 of 86
Data Science with R27OnePageR Survival GuidesDecision TreesVisualise Decision Treesplot(model)text(model)Humidity3pm 71 Pressure3pm 1010YesSunshine 9.95NoNoYesThe default plot of the model is quite basic. In this plot we move to the left in the binary treeif the condition is true.Copyright 2013-2014 Graham@togaware.comModule: DTreesOPage: 28 of 86
Data Science with R28OnePageR Survival GuidesDecision TreesVisualise Decision Trees: Uniformplot(model, uniform TRUE)text(model)Humidity3pm 71 Pressure3pm 1010YesSunshine 9.95NoNoCopyright 2013-2014 Graham@togaware.comYesModule: DTreesOPage: 29 of 86
Data Science with R29OnePageR Survival GuidesDecision TreesVisualise Decision Trees: Extra Informationplot(model, uniform TRUE)text(model, use.n TRUE, all TRUE, cex .8)Humidity3pm 71 No2e 02/4e 01Pressure3pm 1010No2e 02/2e 01Yes5/1e 01Sunshine 9.95No2e 01/1e 01No2e 02/1e 01No1e 01/1Copyright 2013-2014 Graham@togaware.comYes5/1e 01Module: DTreesOPage: 30 of 86
Data Science with R30OnePageR Survival GuidesDecision TreesFancy PlotThe rattle package provides a fancy plot based on the functionality provided by rpart.plot (Milborrow, 2014) and using colours from RColorBrewer (Neuwirth, 2011), tuned for use in rattle.The same options can be passed directly to prp() to achieve the same plot and colours, as wesee in the following pages. The colours are specially constructed in rattle.fancyRpartPlot(model)1No.85 .15100%yesHumidity3pm 71no2No.89 .1193%Pressure3pm 10105No.60 .4012%Sunshine 9.9410113No.94 .0681%No.93 .075%Yes.31 .696%Yes.28 .727%Rattle 2014 Apr 06 07:09:31 gjwCopyright 2013-2014 Graham@togaware.comModule: DTreesOPage: 31 of 86
Data Science with R31OnePageR Survival GuidesDecision TreesEnhanced Plots: DefaultStephen Milborrow’s rpart.plot provides a suite of enhancements to the basic rpart plot() command. The following pages exhibit the various (and quite extensive) options provided by rpart.plotand specifically prp().prp(model)yesHumidity 71noPressure 1010NoYesSunshine 9.9NoCopyright 2013-2014 Graham@togaware.comYesModule: DTreesOPage: 32 of 86
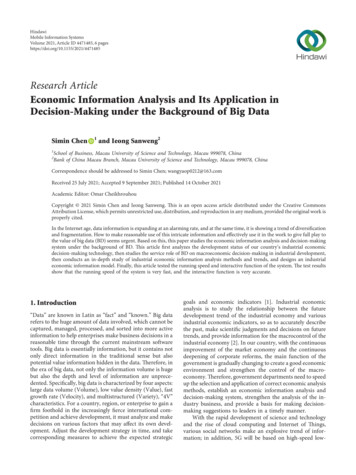
Data Science with R32OnePageR Survival GuidesDecision TreesEnhanced Plots: FavouriteThis is a plot that I find particularly useful, neat, and informative, particularly for classificationmodels.prp(model, type 2, extra 104, nn TRUE, fallen.leaves TRUE,faclen 0, varlen 0, shadow.col "grey", branch.lty 3)1No.85 .15100%yesHumidity3pm 71no2No.89 .1193%Pressure3pm 10105No.60 .4012%Sunshine 9.9410113No.94 .0681%No.93 .075%Yes.31 .696%Yes.28 .727%The leaf nodes are each labelled with the predicted class. They are neatly lined up at the bottomof the figure (fallen.leaves TRUE), to visually reinforce the structure. We can see the straightlines from the top to the bottom which lead to decisions quickly, whilst the more complex pathsneed quite a bit more information in order to make a decision.Each node includes the probability for each class, and the percentage of observations associatedwith the node (extra 104). The node numbers are included (nn TRUE) so we can cross referenceeach node to the text decision tree, or other decision tree plots, or a rule set generated from thedecision tree.Using a dotted line type (branch.lty 3) removes some of the focus from the heavy lines andback to the nodes, whilst still clearly identifying the links. The grey shadow is an optionalnicety.Copyright 2013-2014 Graham@togaware.comModule: DTreesOPage: 33 of 86
Data Science with R33OnePageR Survival GuidesDecision TreesEnhanced Plots: Label all Nodesprp(model, type 1)yesHumidity 71noNoPressure 1010YesNoNoSunshine 9.9NoNoYesHere all nodes are labelled with the majority class.Copyright 2013-2014 Graham@togaware.comModule: DTreesOPage: 34 of 86
Data Science with R34OnePageR Survival GuidesDecision TreesEnhanced Plots: Labels Below Nodesprp(model, type 2)yesNoHumidity 71noNoYesPressure 1010NoNoSunshine 9.9NoCopyright 2013-2014 Graham@togaware.comYesModule: DTreesOPage: 35 of 86
Data Science with R35OnePageR Survival GuidesDecision TreesEnhanced Plots: Split Labelsprp(model, type 3)Humidity 71 71YesPressure 1010 1010NoSunshine 9.9 9.9NoCopyright 2013-2014 Graham@togaware.comYesModule: DTreesOPage: 36 of 86
Data Science with R36OnePageR Survival GuidesDecision TreesEnhanced Plots: Interior Labelsprp(model, type 4)NoHumidity 71 71YesNoPressure 1010 1010NoNoSunshine 9.9 9.9NoCopyright 2013-2014 Graham@togaware.comYesModule: DTreesOPage: 37 of 86
Data Science with R37OnePageR Survival GuidesDecision TreesEnhanced Plots: Number of Observationsprp(model, type 2, extra 1)No218 38Humidity 71yesNo213 25noYes5 13Pressure 1010No195 13No18 12Sunshine 9.9No13 1Copyright 2013-2014 Graham@togaware.comYes5 11Module: DTreesOPage: 38 of 86
Data Science with R38OnePageR Survival GuidesDecision TreesEnhanced Plots: Add Percentage of Observationsprp(model, type 2, extra 101)No218 38100%yesHumidity 71noNo213 2593%Yes5 137%Pressure 1010No195 1381%No18 1212%Sunshine 9.9No13 15%Copyright 2013-2014 Graham@togaware.comYes5 116%Module: DTreesOPage: 39 of 86
Data Science with R39OnePageR Survival GuidesDecision TreesEnhanced Plots: Classification Rateprp(model, type 2, extra 2)No218 / 256Humidity 71yesNo213 / 238noYes13 / 18Pressure 1010No195 / 208No18 / 30Sunshine 9.9No13 / 14Copyright 2013-2014 Graham@togaware.comYes11 / 16Module: DTreesOPage: 40 of 86
Data Science with R40OnePageR Survival GuidesDecision TreesEnhanced Plots: Add Percentage of Observationsprp(model, type 2, extra 102)No218 / 256100%yesHumidity 71noNo213 / 23893%Yes13 / 187%Pressure 1010No195 / 20881%No18 / 3012%Sunshine 9.9No13 / 145%Yes11 / 166%Notice the pattern? When we add 100 to the extra option then the percentage of observationslocated with each node is then included in the plot.Copyright 2013-2014 Graham@togaware.comModule: DTreesOPage: 41 of 86
Data Science with R41OnePageR Survival GuidesDecision TreesEnhanced Plots: Misclassification Rateprp(model, type 2, extra 3)No38 / 256Humidity 71yesNo25 / 238noYes5 / 18Pressure 1010No13 / 208No12 / 30Sunshine 9.9No1 / 14Copyright 2013-2014 Graham@togaware.comYes5 / 16Module: DTreesOPage: 42 of 86
Data Science with R42OnePageR Survival GuidesDecision TreesEnhanced Plots: Probability per Classprp(model, type 2, extra 4)No.85 .15Humidity 71yesNo.89 .11noYes.28 .72Pressure 1010No.94 .06No.60 .40Sunshine 9.9No.93 .07Copyright 2013-2014 Graham@togaware.comYes.31 .69Module: DTreesOPage: 43 of 86
Data Science with R43OnePageR Survival GuidesDecision TreesEnhanced Plots: Add Percentage Observationsprp(model, type 2, extra 104)No.85 .15100%yesHumidity 71noNo.89 .1193%Yes.28 .727%Pressure 1010No.94 .0681%No.60 .4012%Sunshine 9.9No.93 .075%Yes.31 .696%This is a particularl
This Module introduces rattle (Williams,2014) and rpart (Therneau and Atkinson,2014) for building decision trees. We begin with a step-by-step example of building a decision tree us-ing Rattle, and then illustrate the process using R begining with Section14. We cover both classi cation trees and regression trees.