Transcription
2015CommunityHealth NeedsAssessment
Lake Regional Health SystemCommunity Health Needs AssessmentOctober 2015ContentsExecutive Summary 1Introduction . 3General Description of Hospital . 3Community Served by Hospital 3Defined Community 4Community Population Demographics 4Socioeconomic Characteristics of the Community . 8Income and Employment 8Poverty 9Education 11Uninsured 12Transportation 13Health Status of the Community 14Community Safety Risks . 14Leading Causes of Death . 15Health Outcomes and Factors . 16Health Outcomes . 16Overweight and Obesity . 16Substance Abuse . 17Pregnancy and Sexual Health . 18Preventable Hospital Stays . 19Diabetes Management . 20Mammography Screening . 20Local Health Care Resources . 21Hospitals . 21Other Health Care Facilities and Providers . 21Community Health Assessment .23Secondary Data Analysis . 23Survey Methodology . 23Survey Key Findings . 24Survey Response Summary . 24Community Focus Groups Methodology . 25Community Focus Groups Key Findings . 26Mennonite Community Stakeholder Interview . 28Prioritization of Identified Health Needs . 30Considerations for Meeting Identified Community Health Needs . 30Health Issues of Uninsured Persons, Low-Income Persons and Minority Groups . 30Implementation Plan . . . 30Limitations . . . 30AppendicesA – Acknowledgements .31B – Questions for Community Focus Groups 32C – Community Survey . 33D – Prioritization Tool . 44E – Sources . 46F – Community Survey Summary Results 48
Lake Regional Health SystemCommunity Health Needs AssessmentExecutive SummaryThe following is a summary of the 2015 Community Health Needs Assessment conducted by Lake RegionalHealth System, a tax-exempt hospital facility. The health system worked collaboratively with health carerepresentatives from Camden, Miller and Morgan counties to collect and analyze health data, gather inputfrom community members, and to identify and prioritize local health needs.For this assessment, the community is defined as 22 ZIP codes located within Camden, Miller or Morgancounties and within a 25-mile radius of Lake Regional Hospital in Osage Beach, Mo.Community Health Assessment ProcessThis needs assessment is comprised of quantitative and qualitative data. In May 2015, Lake Regional begancollecting and reviewing existing demographic and socioeconomic data about the community. Secondary datacollected by various organizations, such as the U.S. Census Bureau, the Robert Wood Johnson Foundation’sCounty Health Rankings & Roadmaps, the U.S. Centers for Disease Control and Prevention, and state ofMissouri, was vital to the assessment; these sources are cited beneath each respective information table. Inputfrom community members adds depth to the data collected and is helpful in determining how resources maybe used to improve the health of our community. Primary data collection involved a needs assessment surveyand community focus groups.During June and July 2015, a total of 732 community surveys were collected online and via paper copy. Thesurvey was intended to yield information about the overall health of the community. Areas surveyed includedemographic and socioeconomic characteristics, behavioral risk factors, health conditions and access tohealth care. Notice of the survey was shared with the community through local media, social media and thehealth system’s e-newsletter. To reach low-income, medically underserved and chronically ill populations, apaper version of the survey was distributed at support groups, community events, county health departmentsites, a free clinic site and Lake Regional primary care clinics. The online survey was shared with lake-areacommunity partners, including school districts; population health partners, including county healthdepartments; and business partners, including chambers of commerce. Lake Regional employees alsoparticipated in the survey.Three focus groups were conducted to gain input from individuals who have special knowledge of the healthstatus of the community. Discussion topics included health and quality of life; barriers to health care;underserved populations; and potential solutions. Forums were held in Osage Beach, Camdenton and Laurie.Health IssuesAccording to secondary data sources, the leading causes of death in Camden, Miller and Morgan counties are1) heart disease, 2) cancer and 3) smoking-attributable illness. All three counties have higher rates ofpremature death than the Missouri overall rate.The rate of overweight and obese individuals within the defined community also is high, putting arearesidents at risk of developing further health issues. According to the U.S. Centers for Disease Control andPrevention’s Division of Nutrition, Physical Activity and Obesity, 35.33 percent of Missouri adults areconsidered overweight, 45.91 percent of Morgan residents and 39.24 percent of Camden County residents areoverweight. Among adults in Miller County, 34.4 percent are considered obese. This is approximately4 percent higher than the state average of 30.35 percent. High rates of overweight and obesity may be a resultof low levels of physical activity. All three counties have higher inactivity rates than Missouri at 26 percent.1
Prioritization ProcessLake Regional’s Community Benefit Committee met in July and August 2015 to review the data collectedfrom secondary research, focus group feedback and the community needs assessment survey. The committeeincluded a multidisciplinary group of Lake Regional employees, including educators, a chronic conditioncoordinator, a social worker, Emergency Department personnel, and stroke and STEMI coordinators; localhealth department administrators; a free clinic administrator; and a school district representative. Commonthemes were identified, scored and weighted to prioritize the health needs of the community. The topcommunity health priorities identified are as follows. access to primary and specialty care providers mental health smoking/tobacco use physical inactivity and obesityImplementation PlanPlans to address priority items identified by the Community Health Needs Assessment are outlined in thereport Lake Regional Community Health Implementation Plan. The implementation plan is scheduled to bepresented to the Lake Regional Health System Board of Directors on Feb. 26, 2016.Following approval of the Community Health Needs Assessment by the Lake Regional Health System Boardof Directors on Dec. 4, 2015, the assessment report will be made available to the public online atwww.lakeregional.com. For more information, contact Lake Regional Health System Public Relations at573-348-8755 or info@lakeregional.com.Michael E. Henze, CEOLake Regional Health System2
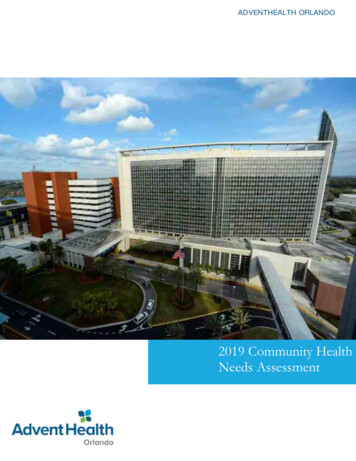
INTRODUCTIONThe following steps were taken by Lake Regional Health System to conduct the Community Health NeedsAssessment. The community served by Lake Regional Health System was defined as described in the section “DefinedCommunity.” Demographic and socioeconomic data was gathered from secondary sources for each of the counties inthe defined service area. Information on the leading causes of death and morbidity was reviewed, alongwith health outcome and health factor data retrieved from www.countyhealthrankings.org. A Community Health Assessment Survey was conducted among 723 individuals residing in Camden,Miller and Morgan counties. Results are reported in the section “Community Health Assessment Survey.” Three focus groups were held to gain input from public health experts and community health allies.Participants identified problems, resources, barriers and solutions related to health care in the lake area. Health needs were prioritized using a method that weighs 1) the ability to measure outcomes based ondata, 2) the number of community members affected, 3) the consequences of not addressing the problemand 4) the prevalence of common themes among data collected from primary and secondary sources.(See Appendix D.) Strategies to address health needs were developed based on identified priorities, taking into account LakeRegional Health System’s perceived degree of influence and ability to impact overall health.General Description of HospitalLake Regional Health System, is a 501(c)(3) corporation. A 15-member board of directors governs thehospital and ensures appropriate medical services are available to area residents and visitors.The 500,000 square foot, 116-bed acute care hospital is accredited by The Joint Commission. The EmergencyDepartment is a state-designated Level III Trauma Center that treats nearly 35,000 patients annually,including tourists visiting the Lake of the Ozarks. The hospital also is a state-designated Level II StrokeCenter.More than 100 physicians and mid-level providers care for Lake Regional patients. The health system, whichemploys more than 1,000 individuals, operates seven freestanding primary care clinics; 18 specialty clinics;two urgent care clinics; a wound healing center; four satellite physical and cardiac rehab therapy sites; threeretail pharmacies; and home health services.Community Served by the HospitalLake Regional Health System, located in the city of Osage Beach in Camden County, Mo., is accessible byU.S. Highway 54. The hospital serves multiple, mostly rural communities surrounding the Lake of the Ozarks,including populations located in Morgan County to the north and Miller County to the east.Osage Beach is 45 miles southwest of Jefferson City, the state capital, and approximately 80 miles south ofColumbia, Mo., where the nearest academic medical center is located. St. Louis is approximately 180 milesnortheast; Kansas City, Mo., is approximately 180 miles northwest; Springfield, Mo., is approximately100 miles southwest of Osage Beach.The Lake of the Ozarks is one of the largest man-made lakes in the United States. With more than1,150 miles of shoreline, the lake encompasses 54,000 acres. The Lake of the Ozarks is a vacation andretirement destination for people from many Midwest cities.3
Defined CommunityFor the purposes of this assessment, the community is defined as the ZIP codes within a 25-mile radius ofLake Regional Health System and located in Camden, Miller or Morgan counties. (The full, three-county landarea encompasses 1,856 square miles.)The following 22 ZIP codes meet these criteria and are included in the 2015 Community Health NeedsAssessment:CityBarnettBrumleyCamdentonClimax SpringsEldonGravois MillsIberiaKaiserLake OzarkLaurieLinn organMillerMillerMillerMorganCamdenCityMacks CreekMontrealOsage BeachRichlandRoachRocky MountStoutlandStoverSunrise rganCommunity Population DemographicsAccording to the 2010 U.S. Census, the population of Camden, Miller and Morgan counties totaled 89,315.Population change in the three-county service area from 2000 to 2010 and forward estimates are shown in thetable below. Between 2000 and 2010, each of the counties within Lake Regional’s service area has experiencedpopulation growth. Camden County experienced the greatest increase, with greater than 18 percent growth.The Missouri Office of Administration projects population increases for Camden, Miller and Morgancounties through 2030. The greatest population increase is expected in Camden County.The female population represents an estimated 49.66 percent of the service area, while the male populationrepresented 50.34 percent.Population angeApproximatePopulationDensity perSquare 62Source: American Community Survey 5-Year Estimates (2009-2013) and Missouri Population Projections by County, Age, and Sex (2000-2030).Populations in all three counties are predominantly white, with the greatest diversity found in CamdenCounty. Asians make up 0.44 percent of the service area, Native Americans and Alaska Natives represent 0.53percent, and 1.48 percent identify as being multiple races. Less than 1 percent of residents in each county areAfrican American, and less than 3 percent of residents identify as Hispanic.4
Race and NativeAmericanor 570.77%22,7810.38%NativeHawaiianor r LatinoNonHispanicor 9%20,02298.19%5,787,47796.34%Source: American Community Survey 5-Year Estimates (2009-2013).The growing Hispanic population in the area may experience barriers to accessing care due to languagedifferences, lack of transportation, uninsured status or lack of appropriate legal identification documentation.A small portion of the community has been identified as having a language barrier to health care. MorganCounty has the highest percentage of linguistically isolated people at 2.05 percent and the highest rate ofresidents with limited English proficiency at 3.34 percent. This may be representative of the Mennonite andRussian populations that live in and around Versailles, Mo.Children in the area may also be at a disadvantage when language barriers may affect their ability tocommunicate health concerns. In 2013, 71 students in Camden County were identified by school districts ashaving limited English language skills. In Miller County, 21 students were reported as being English languagelearners.Language Barriers to Health CareLinguistically n with LimitedEnglish ProficiencyNumber793128640128,049Child English Language 31Source: American Community Survey 5-Year Estimates (2009-2013) and Missouri Indicators by County (2013).The Lake of the Ozarks region is a recreation destination that attracts large seasonal crowds, as well as agrowing population of second homeowners and retirees. The service area has a relatively aged population,with the median age of Camden, Miller and Morgan counties being approximately 7.5 years higher than themedian age of Missouri (45.5 years vs. 37.95 years). The percentage of residents age 65 or older is higher in allthree counties than the state average of 14.35 percent. Camden County has the highest percentage of peopleover the age of 65 at 22.6 percent, followed by Morgan County at 22.4 percent and Miller County at16.68 percent.5
Age 445-5455-6465 722.4%862,03814.35%M 49.3F 49.2M 40.5F 40.8M 46.5F 47.3M 36.6F 39.3Source: American Community Survey 5-Year Estimates (2009-2013) and Missouri Population Projections by County, Age, and Sex (2000-2030).Age is one factor that can affect community health care needs. For the age category that uses health careservices most, 65 and older, population in the three-county area is projected to increase by 14,510 individualsfrom 2010 to 2030. This rise in elderly residents may have certain implications for the growth anddevelopment of resources and services.Population Projections by 485 1,25075362624,827Source: Missouri Population Projections by County, Age, and Sex (2000-2030).6
Comparing data for Camden, Miller and Morgan Counties with statewide data reveals the service area has aveteran population 5 percent higher than the Missouri average and 7 percent higher than the national average,with the highest number of veterans residing in Camden County. These statistics may be related to theproximity of Fort Leonard Wood in neighboring Pulaski County, approximately 60 miles southeast of LakeRegional Health System.Veteran PopulationTotalPopulationAge 18 475 ,81427.24%4,780,43625.3%Source: American Community Survey 5-Year Estimates (2009-2013).Camden, Miller and Morgan Counties all have a higher percentage of disabled residents than the Missouriaverage of 14.01 percent. Morgan County has the highest percentage of disabled residents at 21.87 percent,followed by Miller County at 20.03 percent and Camden County at 18.41 percent.Disabled 4.01%Under %2,92020.11%2,43321.44%447,80312.23%Above urce: American Community Survey 5-Year Estimates (2009-2013).7
SOCIOECONOMIC CHARACTERISTICS OF THE COMMUNITYSocioeconomic factors can affect a community’s access to health care services. The various factors examinedbelow include, but are not limited to unemployment, median income, home ownership, poverty rates in adultsand children, the insurance status of residents, and educational attainment information.Income and EmploymentLake Regional Health System is the largest employer in the community, with more than 1,000 employees.Other major employers include Premium Outlets, Camdenton R-III School District, Tan-Tar-A Resort,Gates Corporation and The Lodge of Four Seasons.Major EmployersBusiness NameLocationProduct/ServiceNumber ofEmployeesPremium OutletsCamdenton R-III School DistrictTan-Tar-A ResortOsage BeachCamdentonOsage s CorporationThe Lodge of the Four SeasonsHy-VeeWalmart SupercenterWalmart SupercenterEldon R-I School DistrictJohnson ControlsSchool of the Osage R-II DistrictCamden CountyMorgan County R-II School DistrictTargetGood Shepherd Nursing HomeOpies, Inc.Speedline TechnologiesVersaillesLake OzarkOsage BeachCamdentonOsage BeachEldonEldonLake OzarkCamdentonVersaillesOsage ionGovernmentEducationRetailHealth 435430430315410250240225150150150140Source: Lake of the Ozarks Major Employers (2014). http://loredc.com/employers.aspComparing data for Camden, Miller and Morgan Counties reveals the percent of unemployed individuals inall three counties is higher than the state and national averages of 7.2 percent and 6.8 percent, respectively.Camden and Morgan Counties are experiencing a 10.9 percent unemployment rate, and Miller County is closebehind at 10 percent. Local, state and national unemployment rates have decreased since the last needsassessment conducted in 2012.UnemploymentLabor 533,047,734157,063,087Number r UnemployedUnemployment Unemployment Rate [Total Unemployed] / [Total Labor Force] * 100 Source: Local Area Unemployment Statistics (March 2015).Median household income is significantly lower in Miller and Morgan Counties than the state as a whole. Themedian household income in each county is less than the state average of 47,380. Morgan County is thelowest at 32,621, followed by Miller County at 37,853. Camden County has the highest median income in8
the service area at 41,350. The following table includes all reported income from wage, salaries, selfemployment, interest or dividends, public assistance, retirement and other sources. According to the SmallArea Income and Poverty Estimates, Morgan and Camden County experienced between an 11.5 percent and32.2 percent decrease in median household income from 2007 to 2013. Miller County householdsexperienced a 5.5 percent to 11.4 percent decline in median income during the same period.Income InformationTotal IncomeCamdenMillerMorganMissouri 1,009,579,328 481,963,104 365,728,704 e 23,038 19,384 17,934 25,64917,2789,6768,0182,360,131 41,350 37,853 32,621 ed 3,445 2,671 2,522 3,008Source: American Community Survey Profile Report (2011-2013) and Small Area Income and Poverty Estimates.PovertyCamden County has a poverty rate of 16.08 percent, the lowest of the three counties. All three counties havea poverty rate higher than the state average of 15.46 percent. Miller County has the lowest poverty rate amongchildren in the three counties at 31.4 percent, which is approximately 10 percent higher than both the stateand national averages.Poverty StatisticsTotalPopulationPopulation in PovertyPopulation UnderAge 18 in riU.S.Percent16.08%PopulationUnder 188,226Number2,663Percent32.37%5,849Source: American Community Survey 5-Year Estimates (2009-2013).Food insecurity is defined as the economic and social condition of limited or uncertain access to adequatefood at the household-level. Food insecurity rates in all three counties are slightly lower than the state averageof 17.12 percent. Miller County has the largest food insecure population at 16.32 percent. Morgan andCamden County have food insecurity levels of 15.77 percent and 14.59 percent, respectively.The following table examines the rate of establishments (as it was in 2012) related to the food insecurity ratein the area. Grocery stores are characterized as supermarkets and smaller stores primarily engaged in retailingcanned and frozen foods, fresh fruits and vegetables, and/or fresh and prepared meats. Convenience storesand large general merchandise stores that also retail food (such as supercenters and warehouse club stores) areexcluded.9
Food Insecurity RateGrocery e20.4528.2948.6318.23Fast Food RestaurantsNumber271794,105Food Insecure e: County Business Patterns (2013) and Food Insecurity Rate (2012).High poverty rates within the service area are further evidenced by the percentage of students eligible for freeor reduced lunch. Nearly 64 percent of students in Morgan County are extended free or reduced lunches dailyas a result of their overall household income or related socioeconomic factors. Children in households thatare enrolled in the Supplemental Nutrition Assistance Program automatically qualify for free or reduced lunchin public schools. Camden, Miller and Morgan counties have a higher percentage of households receivingSNAP benefits than the state as a whole. Rates of SNAP authorized retailers are per 100,000 residents.Supplemental Nutrition Assistance ProgramTotalHouseholds ReceivingHouseholdsSNAP 02.27105.06126.4375.8678.44Students Eligible forFree/Reduced 55.99%54.42%63.98%45.49%51.7%Source: American Community Survey 5-Year Estimates (2009-2013) and SNAP Retailer Locator (2014).The homeownership rate in all three counties is higher than the state average of 68.4 percent. In MorganCounty, more than 80 percent of residents are homeowners, followed by 78.2 percent in Camden County and77.1 percent in Miller County. Miller and Morgan counties have slightly higher rates of occupied units withone or more substandard conditions than the state as a whole. Camden and Miller counties are in line withthe state with 14 percent of residents experiencing severe housing problems. Morgan County exceeds thestate average for severe housing problems by 4 percent.Housing InformationHousing UnitsHomeownership RateTotal Occupied UnitsOwner OccupiedRenter OccupiedOccupied Units with 1 or MoreSubstandard ConditionsSevere Housing 29.86%14%Source: State and County QuickFacts (2010-2014) and American Community Survey 5-Year Estimates (2009-2013).10
The following table indicates the number of related children age seventeen and under who live in familiesheaded by a person without a spouse present in the home.Children in Single Parent ercent32.6%41.5%28.3%Source: Missouri Indicators by County (2011 and 2012).EducationThe service area has a higher high school graduation rate than the state average of 87.6 percent. Graduationrates are highest in Morgan County at 97.17 percent, followed by Camden County at 95.36 percent and MillerCounty at 94.25 percent. Camden County has the highest number of total students, teachers and staff, and thelowest overall ratio of the number of students per teacher.District Graduation RatesCamden County DistrictsCamdenton R-IIIClimax Springs R-IVMacks Creek R-VSchool of the Osage R-IIStoutland R-IICamden County SummaryMiller County DistrictsEldon R-IMiller Co. R-IIISt. Elizabeth R-IVIberia R-VMiller County SummaryMorgan County DistrictsMorgan Co. R-IMorgan Co. R-IIMorgan County SummaryStudents perClassroomTeachersTotal Teachersand 4%0.2%191818.56421,4562,09860141201Total StudentsSource: District and Building Graduation and Dropout Indicators (2014).The percentage of residents older than 25 who have completed high school or higher is lower than the stateaverage, 88.7 percent, in Miller and Morgan counties. Camden County has the highest rate at 89.9 percent,followed by Miller County at 84.8 percent and Morgan County at 42.1 percent. Miller and Morgan countieshave higher illiteracy rates than the state average of 7.5 percent.11
Educational AttainmentCamdenPopulation 18-24 YearsLess than High School GraduateHigh School Graduate (includes equivalency)Some College (includes Associate Degrees)Bachelor’s Degree or higherPopulation 25 Years and OlderLess than 9th Grade9-12 Grade (no diploma)High School Graduate (includes equivalency)Some College (no degree)Associate’s DegreeBachelor’s DegreeGraduate/Professional DegreeHigh School Degree or HigherIlliteracy 6.0%25.0 %7.6%12.8 %8.0%89.4%7.0%Morgan
employs more than 1,000 individuals, operates seven freestanding primary care clinics; 18 specialty clinics; two urgent care clinics; a wound healing center; four satellite physical and cardiac rehab therapy sites; three retail pharmacies; and home health services. Community Served by the Hospital
