Transcription
M.M. MekonnenA.Y. HoekstraDecember 2010The green, blue and greywater footprint of crops andderived crop productsVolume 1: Main ReportValue of WaterResearch Report Series No. 47
THE GREEN, BLUE AND GREY WATER FOOTPRINTOF CROPS AND DERIVED CROP PRODUCTSVOLUME 1: MAIN REPORTM.M. MEKONNEN1A.Y. HOEKSTRA1,2DECEMBER 2010VALUE OF WATER RESEARCH REPORT SERIES NO. 471Twente Water Centre, University of Twente, Enschede, The Netherlands2Contact author: Arjen Y. Hoekstra, a.y.hoekstra@utwente.nl
2010 M.M. Mekonnen and A.Y. Hoekstra.Published by:UNESCO-IHE Institute for Water EducationP.O. Box 30152601 DA DelftThe NetherlandsThe Value of Water Research Report Series is published by UNESCO-IHE Institute for Water Education, incollaboration with University of Twente, Enschede, and Delft University of Technology, Delft.All rights reserved. No part of this publication may be reproduced, stored in a retrieval system, or transmitted, inany form or by any means, electronic, mechanical, photocopying, recording or otherwise, without the priorpermission of the authors. Printing the electronic version for personal use is allowed.Please cite this publication as follows:Mekonnen, M.M. and Hoekstra, A.Y. (2010) The green, blue and grey water footprint of crops and derived cropproducts, Value of Water Research Report Series No. 47, UNESCO-IHE, Delft, the Netherlands.
ContentsSummary . 51. Introduction . 72. Method and data . 92.1. Method . 92.2. Data. 113. Results . 133.1. The global picture . 133.2. The water footprint of primary crops and derived crop products per ton . 143.3. The water footprint of biofuels per GJ and per litre. 213.4. The total water footprint of crop production at national and sub-national level . 223.5. The total water footprint of crop production at river basin level . 223.6. The water footprint in irrigated versus rain-fed agriculture . 224. Discussion .255. Conclusion .29References .31
SummaryThis study quantifies the green, blue and grey water footprint of global crop production in a spatially-explicitway for the period 1996-2005. The assessment is global and improves upon earlier research by taking a highresolution approach, estimating the water footprint of 126 crops at a 5 by 5 arc minute grid. We have used a gridbased dynamic water balance model to calculate crop water use over time, with a time step of one day. Themodel takes into account the daily soil water balance and climatic conditions for each grid cell. In addition, thewater pollution associated with the use of nitrogen fertilizer in crop production is estimated for each grid cell.The crop evapotranspiration of additional 20 minor crops is calculated with the CROPWAT model. In addition,we have calculated the water footprint of more than two hundred derived crop products, including various flours,beverages, fibres and biofuels. We have used the water footprint assessment framework as in the guideline of theWater Footprint Network (Hoekstra et al., 2009).Considering the water footprints of primary crops, we see that the global average water footprint per ton of cropincreases from sugar crops (roughly 200 m3/ton), vegetables (300 m3/ton), roots and tubers (400 m3/ton), fruits(1000 m3/ton), cereals (1600 m3/ton), oil crops (2400 m3/ton) to pulses (4000 m3/ton). The water footprint varies,however, across different crops per crop category and per production region as well. Besides, if one considersthe water footprint per kcal, the picture changes as well. When considered per ton of product, commodities withrelatively large water footprints are: coffee, tea, cocoa, tobacco, spices, nuts, rubber and fibres. The analysis ofwater footprints of different biofuels shows that bio-ethanol has a lower water footprint (in m3/GJ) thanbiodiesel, which supports earlier analyses. The crop used matters significantly as well: the global average waterfootprint of bio-ethanol based on sugar beet amounts to 51 m3/GJ, while this is 121 m3/GJ for maize.The global water footprint related to crop production in the period 1996-2005 was 7404 billion cubic meters peryear (78% green, 12% blue, 10% grey). A large total water footprint was calculated for wheat (1087 Gm3/yr),rice (992 Gm3/yr) and maize (770 Gm3/yr). Wheat and rice have the largest blue water footprints, togetheraccounting for 45% of the global blue water footprint. At country level, the total water footprint was largest forIndia (1047 Gm3/yr), China (967 Gm3/yr) and the USA (826 Gm3/yr). A relatively large total blue waterfootprint as a result of crop production is observed in the Indus river basin (117 Gm3/yr) and the Ganges riverbasin (108 Gm3/yr). The two basins together account for 25% of the blue water footprint related to global cropproduction. Globally, rain-fed agriculture has a water footprint of 5173 Gm3/yr (91% green, 9% grey); irrigatedagriculture has a water footprint of 2230 Gm3/yr (48% green, 40% blue, 12% grey).
1.IntroductionGlobal freshwater withdrawal has increased nearly seven-fold in the past century (Gleick, 2000). With a growingpopulation, coupled with changing diet preferences, water withdrawals are expected to continue to increase inthe coming decades (Rosegrant and Rigler, 2000). With increasing withdrawals, also consumptive water use islikely to increase. Consumptive water use in a certain period in a certain river basin refers to water that after useis no longer available for other purposes, because it evaporated (Perry, 2007). Currently, the agricultural sectoraccounts for about 85% of global freshwater consumption (Shiklomanov, 2000; Hoekstra and Chapagain, 2007).The aim of this study is to estimate the green, blue and grey water footprint of crops and crop products in aspatially-explicit way. We quantify the green, blue and grey water footprint of crop production by using a gridbased dynamic water balance model that takes into account local climate and soil conditions and nitrogenfertilizer application rates and calculates the crop water requirements, actual crop water use and yields andfinally the green, blue and grey water footprint at grid level. The model has been applied at a spatial resolution of5 by 5 arc minute. The model’s conceptual framework is based on the CROPWAT approach (Allen et al., 1998).The concept of ‘water footprint’ introduced by Hoekstra (2003) and subsequently elaborated by Hoekstra andChapagain (2008) provides a framework to analyse the link between human consumption and the appropriationof the globe’s freshwater. The water footprint of a product is defined as the total volume of freshwater that isused to produce the product (Hoekstra et al., 2009). The blue water footprint refers to the volume of surface andgroundwater consumed (evaporated) as a result of the production of a good; the green water footprint refers tothe rainwater consumed. The grey water footprint of a product refers to the volume of freshwater that is requiredto assimilate the load of pollutants based on existing ambient water quality standards.There are various previous studies on global water use for different sectors of the economy, most of which focuson water withdrawals. Studies of global water consumption (evaporative water use) are scarcer. The majorstudies that estimated global water consumption in agriculture are listed in Table 1. There are no previous globalstudies on the grey water footprint in agriculture. L’vovich et al. (1990) and Shiklomanov (1993) estimated bluewater consumption at a continental level. Postel et al. (1996) made a global estimate of consumptive use of bothblue and green water. Seckler et al. (1998) made a first global estimate of consumptive use of blue water inagriculture at country level. Rockström et al. (1999) and Rockström and Gordon (2001) made some first globalestimates of green water consumption. Shiklomanov and Rodda (2003) estimated consumptive use of blue waterat county level. Hoekstra and Hung (2002) were the first to make a global estimate of the consumptive water usefor a number of crops per country, but they did not explicitly distinguish consumptive water use into a green andblue component. Chapagain and Hoekstra (2004) and Hoekstra and Chapagain (2007, 2008) improved this studyin a number of respects, but still did not explicitly distinguish between green and blue water consumption.All the above studies are based on coarse spatial resolutions that treat the entire world, continents or countries asa whole. In recent years, there have been various attempts to assess global water consumption in agriculture athigh spatial resolution. The earlier estimates focus on the estimation of blue water withdrawal (Gleick, 1993;
8 / The water footprint of crops and derived crop productsAlcamo et al., 2007) and irrigation water requirements (Döll and Siebert, 2002). More recently, a few studieshave separated global water consumption for crop production into green and blue water. Rost et al. (2008) madea global estimate of agricultural green and blue water consumption with a spatial-resolution of 30 by 30 arcminute without showing the water use per crop, but applying 11 crop categories in the underlying model. Siebertand Döll (2008, 2010) have estimated the global green and blue water consumption for 24 crops and 2 additionalbroader crop categories applying a grid-based approach with a spatial-resolution of 5 by 5 arc minute. Liu et al.(2009) and Liu and Yang (2010) made a global estimate of green and blue water consumption for cropproduction with a spatial-resolution of 30 by 30 arc minute. Liu et al. (2009) distinguished 17 major crops, whileLiu and Yang (2010) considered 20 crops and 2 additional broader crop categories. Hanasaki et al. (2010)present the global green and blue water consumption for all crops but assume one dominant crop per grid cell ata 30 by 30 arc minute resolution.Table 1. Major studies on global water consumption and pollution by agriculture.StudySpatialresolutionNumberaof cropsBlue waterbfootprintGreen watercfootprintGrey waterdfootprintL’vovich et al. (1990)continental-yesnonoShiklomanov (1993)continental-yesnonoPostel et al. (1996)global-yesyesnoSeckler et al. (1998)country-yesnonoglobal-noyesnoShiklomanov and Rodda (2003)country-yesnonoHoekstra and Hung (2002)country38yesyesnoChapagain and Hoekstra (2004),Hoekstra and Chapagain (2007, 2008)country164yesyesnoRost et al. (2008)30’ 30’11yesyesno5’ 5’26yesyesnoLiu et al. (2009)30’ 30’17yesyesnoLiu and Yang (2010)30’ 30’22yesyesnoHanasaki et al. (2010)30’ 30’see textyesyesno5’ 5’146yesyesyesRockström et al. (1999), Rockströmand Gordon (2001)Siebert and Döll (2008, 2010)This studyaThe number of crops or crop categories explicitly distinguished when estimating water use.bConsumptive water use originating from ground/surface water, also referred to as ‘blue virtual water content’.cConsumptive water use originating from rain water, also referred to as ‘green virtual water content’.dVolume of ground/surface water polluted (required for assimilation of fertilisers or pesticides).
2.Method and data2.1.MethodThe green, blue and grey water footprints of crop production were estimated following the calculationframework of Hoekstra et al. (2009). The computations of crop evapotranspiration and yield, required for theestimation of the green and blue water footprint in crop production, have been done following the method andassumptions provided by Allen et al. (1998) for the case of crop growth under non-optimal conditions. The gridbased dynamic water balance model used in this study computes a daily soil water balance and calculates cropwater requirements, actual crop water use (both green and blue) and actual yields. The model is applied at aglobal scale using a resolution of 5 by 5 arc minute (Mekonnen and Hoekstra, 2010). We estimated the waterfootprint of 146 primary crops (as listed in Appendix I) and more than two hundred derived products. The gridbased water balance model was used to estimate the crop water use for 126 primary crops; for the other 20 crops,which are grown in only few countries, the CROPWAT 8.0 model was used.The actual crop evapotranspiration (ETa, mm/day) depends on climate parameters (which determine potentialevapotranspiration), crop characteristics and soil water availability (Allen et al., 1998):ETa [t ] Kc [t ] Ks [t ] ETo [t ](1)where Kc is the crop coefficient, Ks [t] a dimensionless transpiration reduction factor dependent on available soilwater and ETo[t] the reference evapotranspiration (mm/day). The crop coefficient varies in time, as a function ofthe plant growth stage. During the initial and mid-season stages, Kc is a constant and equals Kc,ini and Kc,midrespectively. During the crop development stage, Kc is assumed to linearly increase from Kc,ini to Kc,mid. In thelate season stage, Kc is assumed to decrease linearly from Kc,mid to Kc,end. The value of Ks is calculated on a dailybasis as a function of the maximum and actual available soil moisture in the root zone.S[t ] (1 p) S [t ] ifmax K s [t ] 1 S[t ] (1 p) S max [t ](2)Otherwisewhere Ks [t] is a dimensionless transpiration reduction factor dependent on the available soil water, with a valuebetween zero and one; S[t] the actual available soil moisture at time t (in mm); Smax[t] the maximum availablesoil water in the root zone, i.e., the available soil water in the root zone when soil water content is at fieldcapacity (mm); and p the fraction of Smax that a crop can extract from the root zone without suffering water stress(dimensionless).In the case of rain-fed crop production, blue crop water use is zero and green crop water use (m3/ha) is calculatedby summing up the daily values of ETa (mm/day) over the length of the growing period. In the case of irrigated
10 / The water footprint of crops and derived crop productscrop production, the green and blue water use is calculated by performing two different soil water balancescenarios as proposed in Hoekstra et al. (2009) and also applied by FAO (2005), Siebert and Döll (2010) and Liuand Yang (2010). The first soil water balance scenario is carried out based on the assumption that the soil doesnot receive any irrigation, but using crop parameters of irrigated crops (such as rooting depth as under irrigationconditions). The second soil water balance scenario is carried out with the assumption that the amount of actualirrigation is sufficient to meet the irrigation requirement, applying the same crop parameters as in the firstscenario. The green crop water use of irrigated crops is assumed to be equal to the actual crop evapotranspirationas was calculated in the first scenario. The blue crop water use is then equal to the crop water use over thegrowing period as simulated in the second scenario minus the green crop water use as estimated in the firstscenario.Crop growth and yield are affected by water stress. To account for the effect of water stress, a linear relationshipbetween yield and crop evapotranspiration was proposed by Doorenbos and Kassam (1979): ET [t ] Ya 1 K y 1 a CWR[t ] Ym (3)where Ky is a yield response factor (water stress coefficient), Ya the actual harvested yield (kg/ha), Ym themaximum yield (kg/ha), ETa the actual crop evapotranspiration in mm/period and CWR the crop waterrequirement in mm/period (which is equal to Kc ET0). Ky values for individual periods and the completegrowing period are given in Doorenbos and Kassam (1979). The maximum yield values for each crop wereobtained by multiplying the corresponding national average yield values by a factor of 1.2 (Reynolds et al.,2000). The actual yields, which are calculated per grid cell, are averaged over the nation and compared with thenational average yield data (for the period 1996-2005) obtained from FAO (2008a). The calculated yield valuesare scaled to fit the national average FAO yield data.The green and blue water footprints of primary crops (m3/ton) are calculated by dividing the total volume ofgreen and blue water use (m3/yr), respectively, by the quantity of the production (ton/yr).The grey water footprint of crop production, which is an indicator of the volume of freshwater pollution, iscalculated by quantifying the volume of water needed to assimilate the nutrients that reach ground- or surfacewater. Nutrients leaching from agricultural fields are a main cause of non-point source pollution of surface andsubsurface water bodies. In this study we have quantified the grey water footprint related to nitrogen use only.The grey component of the water footprint (m3/ton) is calculated by multiplying the fraction of nitrogen thatleaches or runs off by the nitrogen application rate (kg/ha) and dividing this by the difference between themaximum acceptable concentration of nitrogen (kg/m3) and the natural concentration of nitrogen in the receivingwater body (kg/m3) and by the actual crop yield (ton/ha).The water footprints of crops as harvested have been used as a basis to calculate the water footprints of derivedcrop products based on product and value fractions and water footprints of processing steps following the
The water footprint of crops and derived crop products / 11method as in Hoekstra et al. (2009). The water footprint per unit of energy for ethanol and biodiesel producingcrops was calculated following the method as applied in Gerbens-Leenes et al. (2009).2.2.DataMonthly long-term average reference evapotranspiration data at 10 by 10 arc minute resolution were obtainedfrom FAO (2008c). The 10 by 10 arc minute data were converted to 5 by 5 arc minute resolution by assigningthe 10 by 10 minute data to each of the four 5 by 5 minute grid cells. Following the CROPWAT approach, themonthly average data were converted to daily values by curve fitting to the monthly average through polynomialinterpolation.Monthly values for precipitation, number of wet days and minimum and maximum temperature for the period1996-2002 with a spatial resolution of 30 by 30 arc minute were obtained from CRU-TS-2.1 (Mitchell and Jones,2005). The 30 by 30 arc minute data were assigned to each of the thirty-six 5 by 5 arc minute grid cells containedin the 30 by 30 arc minute grid cell. Daily precipitation values were generated from the monthly average valuesusing the CRU-dGen daily weather generator model (Schuol and Abbaspour, 2007).Crop growing areas on a 5 by 5 arc minute grid cell resolution were obtained from Monfreda et al. (2008). Forcountries missing grid data in Monfreda et al. (2008), the MICRA2000 grid database as described in Portmann etal. (2010) was used to fill the gap. The harvested crop areas as available in grid format were aggregated to anational level and scaled to fit national average crop harvest areas for the period 1996-2005 obtained from FAO(2008a).Grid data on the irrigated fraction of harvested crop areas for 24 major crops were obtained from theMICRA2000 database (Portmann et al., 2010). For the other 102 crops considered in the current study, we usedthe data for ‘other perennial’ and ‘other annual crops’ as in the MICRA2000 database, depending on whether thecrop is categorised under ‘perennial’ or ‘annual’ crops.Crop coefficients (Kc’s) for crops were obtained from Chapagain and Hoekstra (2004). Crop planting dates andlengths of cropping seasons were obtained from FAO (2008d), Sacks et al. (2010), Portmann et al. (2010) andUSDA (1994). For some crops, values from Chapagain and Hoekstra (2004) were used. We have not consideredmulti-cropping practices. Grid-based data on total available water capacity of the soil (TAWC) at a 5 by 5 arcminute resolution were taken from ISRIC-WISE (Batjes, 2006). An average value of TAWC of the five soillayers was used in the model.Country-specific nitrogen fertilizer application rates by crop have been estimated based on Heffer (2009), FAO(2006, 2009) and IFA (2009). Since grid-based fertilizer application rates are not available, we have assumedthat crops receive the same amount of nitrogen fertilizer per hectare in all grid cells in a country. We have furtherassumed that on average 10% of the applied nitrogen fertilizer is lost through leaching, following Chapagain etal. (2006). The recommended maximum value of nitrate in surface and groundwater by the World Health
12 / The water footprint of crops and derived crop productsOrganization and the European Union is 50 mg nitrate (NO 3) per litre and the maximum value recommended byUS-EPA is 10 mg per litre measured as nitrate-nitrogen (NO3-N). In this study we have used the standard of 10mg/litre of nitrate-nitrogen (NO3-N), following again Chapagain et al. (2006). Because of lack of data, thenatural nitrogen concentrations were assumed to be zero.For the calculation of the water footprints of derived crop products we used product and value fraction asreported in Appendix II. Most of these fractions have been taken from FAO (2003) and Chapagain and Hoekstra(2004).Data on the dry mass of crops, the carbohydrate content of ethanol providing crops, the fat content of biodieselproviding crops and the higher heating value of ethanol and biodiesel were taken from Gerbens-Leenes et al.(2008a, 2008b) and summarized in Table 2.Table 2. Characteristics of ten ethanol providing and seven biodiesel providing crops.Dry massfraction (%)Fraction ofcarbohydratesin dry mass(g/g)Ethanol perunit ofcarbohydrate(g/g)Energy yield*(GJ/ton)Bio-ethanolyield 0.533.07131Rice, m85%0.760.5310.2434Sugar beet21%0.820.512.61111Sugar cane27%0.570.512.3399Wheat85%0.760.5310.17434Oil cropsDry massfraction (%)Fraction of fatin dry mass(g/g)Biodiesel perunit of fat(g/g)Energy yield*(GJ/ton)Biodieselyield **(litre/ton)Coconuts50%0.0310.5717Groundnuts, with shell95%0.39114.0421Oil palm fruit85%0.2217.05213Rapeseed74%0.42111.7353Seed wer seed85%0.2217.05213Sugar and starch crops* Based on a higher heating value of 29.7 kJ/gram for ethanol and 37.7 kJ/gram for biodiesel.** Based on a density of 0.789 kg/litre for ethanol and 0.88 kg/litre for biodiesel (Alptekin and Canakci, 2008).
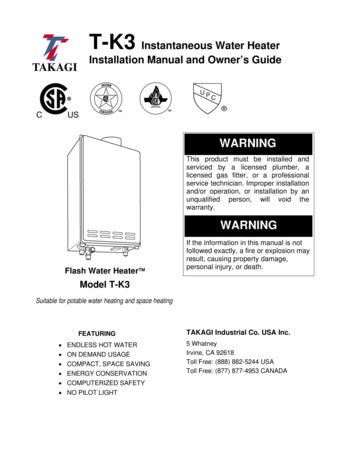
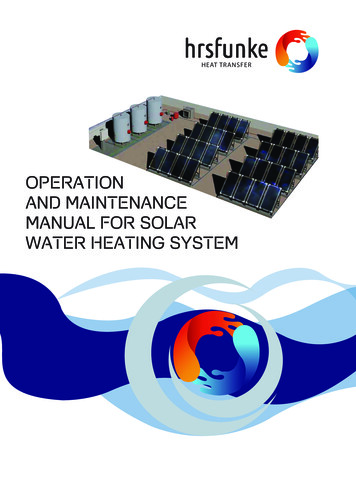
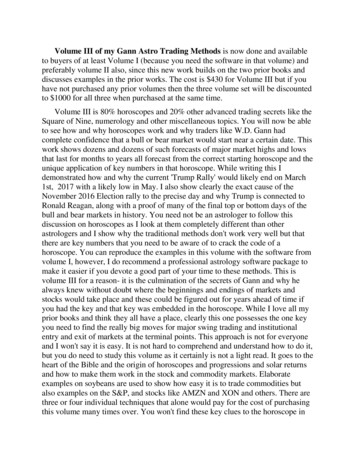
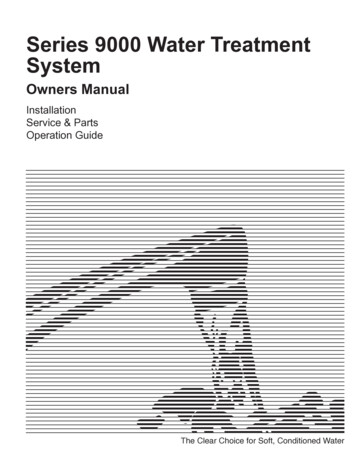
3.Results3.1.The global pictureThe global water footprint of crop production in the period 1996-2005 was 7404 Gm3/year (78% green, 12%blue, and 10% grey). Wheat takes the largest share in this total volume; it consumed 1087 Gm3/yr (70% green,19% blue, 11% grey). The other crops with a large total water footprint are rice (992 Gm3/yr) and maize (770Gm3/yr). The contribution of the major crops to the global water footprint related to crop production is presentedin Figure 1. The global average green water footprint related to crop production was 5771 Gm3/yr, of which rainfed crops use 4701 Gm3/yr and irrigated crops use 1070 Gm3/yr. For most of the crops, the contribution of greenwater footprint toward the total consumptive water footprint (green and blue) is more than 80%. Among themajor crops, the contribution of green water toward the total consumptive water footprint is lowest for date palm(43%) and cotton (64%). The proportion of green water in the total evaporative (green plus blue) water footprintfor the major crops is show in Figure 3. The global average blue water footprint related to crop production was899 Gm3/yr. Wheat (204 Gm3/yr) and rice (202 Gm3/yr) have large blue water footprint together accounting for45% of the global blue water footprint. The grey water footprint related to the use of nitrogen fertilizer in cropscultivation was 733 Gm3/yr. Wheat (123 Gm3/yr), maize (122 Gm3/yr) and rice (111 Gm3/yr) have large greywater footprint together accounting for about 56% of the global grey water footprint.Seed cotton3%Sugar cane4%Barley3%Sorghum Oil palm2%2%Coconuts2%Millet2%Natural rubber1%Coffee, green2%Cassava1%Soybeans5%Groundnuts1%Fodder crops9%Potatoes1%Beans, dry1%Other28%Maize10%Rapeseed1%Other crops21%Rice, paddy13%Wheat15%Figure 1. Contribution of different crops to the total water footprint of crop production. Period: 1996-2005.The green, blue, grey and total water footprints of crop production per grid cell are shown in Figure 2. Largewater footprints per grid cell ( 400 mm/yr) are found in the Ganges and Indus river basins (India, Pakistan and
14 / The water footprint of crops and derived crop productsBangladesh), in eastern China and in the Mississippi river basin (USA). These locations are the same locations aswhere the harvested crop area takes a relative large share in the total area (Monfreda et al., 2008). Appendix VIprovides global maps of the green, blue, grey and total water footprints for some selected crops.Figure 2. The green, blue, grey and total water footprint of crop production estimated at a 5 by 5 arc minuteresolution. The data are shown in mm/yr and have been calculated as the aggregated water footprint per grid cell3(in m /yr) divided by the area of the grid cell. Period: 1996-2005.Globally, 86.5% of the water consumed in crop production is green water. Even in irrigated agriculture, greenwater often has a very significant contribution to total water consumption. The share of the blue water footprintin total water consumption (green plus blue water footprint) is shown in Figure 3. The share of the blue waterfootprint is largest in arid and semi-arid regions. Regions with a large blue water proportion are located, forexample, in the western part of the USA, in a relatively narrow strip of land along the west coast of SouthAmerica (Peru-Chile), in southern Europe, North Africa, the Arabian peninsula, Central Asia, Pakistan andnorthern India, northeast China and parts of Australia.3.2.The water footprint of primary crops and derived crop products per tonThe average water footprint per ton of primary crop differs significantly among crops and across productionregions. Crops with a high yield or large fraction of crop biomass that is harvested generally have a smallerwater footprint per ton than crops with a low yield or small fraction of crop biomass harvested. When consideredper ton of product, commodities with relatively large water footprints are: coffee, tea, cocoa, tobacco, spices,nuts, rubber and fibres (Table 3). For food crops, the global average water footprint per ton of crop increasesfrom sugar crops (roughly 200 m3/ton), vegetables ( 300 m3/ton), roots and tubers ( 400 m3/ton), fruits ( 1000m3/ton), cereals ( 1600 m3/ton), oil crops ( 2400 m3/ton), pulses ( 4000 m3/ton), spices ( 7000 m3/ton) to nuts( 9000 m3/ton). The water footprint varies, however, across different crops per crop category. Besides, if oneconsiders the water footprint per kcal, the picture changes as well. Vegetables and fruits, which have a relativelysmall water footprint per kg but a low caloric content, have a relatively large water footprint per kcal.
The water footprint of crops and derived crop products / 15Figure 3. Contribution of the blue water footprint to the total consumptive (green and blue) water footprint of cropproduction. Period: 1996-2005.Global average water footprints of selected primary crops and their derived products are presented in Table 4.The results allow us to compare the water footprints of different products: The average water footprint for cereal crops is 1644 m3/ton, but the footprint for wheat is relatively large(1827 m3/ton), while for maize it is relatively small (1222 m3/ton). The average water footprint of rice isclose to the average for all cereals together. Sugar obtained from sugar beet has a smaller water footprint than sugar from sugar cane. Besides, the bluecomponent in the total water footprint of beet sugar (20%) is smaller than for cane sugar (27%).
16 / The water footprint of crops and derived crop productsTable 3.Global average water footprint of 14 primary crop categories. Period: 1996-2005.3Water footprint (m /ton)Primary crop category 2900.68GreenBlueGreyTotalSugar crops1305215197Fodder crops2072720253Vegetables19443853222401.34Roots and tubers32716433878300.47Fruits72714
footprint of bio-ethanol based on sugar beet amounts to 51 m3/GJ, while this is 121 m3/GJ for maize. The global water footprint related to crop production in the period 1996-2005 was 7404 billion cubic meters per year (78% green, 12% blue, 10% grey). A large total water footprint was calculated for wheat (1087 Gm3/yr),