Transcription
InsightsEnvironmental, Social& Governance (ESG)September 2020Carbon Footprinting:An Investor ToolkitCarlo M. FunkESG Investment Strategy — EMEAMeasuring, monitoring and reporting on carbon emissionscan appear very confusing.The recommendations from the European Commission’sTechnical Expert Group (TEG) on sustainable finance andthe Task Force on Climate-related Financial Disclosures(TCFD) have led to several approaches which arecurrently used in the market place to assess carbonemissions and calculate company and portfolio-levelcarbon footprint.This educational guide aims to help investors and assetowners understand carbon pricing and help them buildand design portfolios that are aligned with the ParisAgreement goals. In doing so, investors and asset ownerscan report to their constituents on generally acceptedstandards, including those of the TCFD.
Measuring CarbonFootprintsCarbon emissions generally refer to the total greenhouse gas (GHG) emissions caused directlyand indirectly by an individual, organisation, event or product. GHGs are atmospheric gasesthat absorb and emit radiation within the thermal infrared range and that contribute to thegreenhouse effect and global climate change.GHG emissions can be expressed as a carbon dioxide equivalent (CO2e). Using CO2e as a unit ofmeasurement allows different GHGs to be compared on a like-for-like basis, relative to one unitof carbon dioxide.Emissions of CO2e are based on the seven GHGs identified by the Kyoto Protocol: Carbon dioxide (CO2) Methane (CH4) Nitrous oxide (N2O) Hydrofluorocarbons (HFCs) Perfluorocarbons (PFCs) Sulphur hexafluoride (SF6) Nitrogen trifluoride (NF3)Each GHG has a different global warming potential (GWP) and persists for a different length oftime in the atmosphere. Aside from carbon dioxide, the two main GHGs and their 100-year globalwarming potential (GWP) are: Methane (CH4) — 25 x CO2 Releasing 1kg of methane into the atmosphere is aboutequivalent to releasing 25kg of CO2. Nitrous oxide (N2O) — 298 x CO2 Releasing 1kg of nitrous oxide into the atmosphere is aboutequivalent to releasing 298kg of CO2.1To give an idea of scale, a typical internal combustion engine vehicle emits about 4.6 metrictonnes of carbon dioxide per year, along with much smaller amounts of methane and nitrousoxide.2 The US is estimated to have emitted 6.5 billion metric tonnes of CO2e in 2017.3Carbon dioxide accounted for the largest percentage of GHGs (82%), followed by methane(10%), nitrous oxide (6%) and other gases (3%). So, while methane and particularly nitrous oxideare much more potent GHGs, the sheer volume of carbon dioxide means it has the greatestimpact on warming.For a company, quantifying GHG emissions allows an understanding of where the largestemissions arise and how its carbon footprint can be reduced.Carbon Footprinting: An Investor Toolkit2
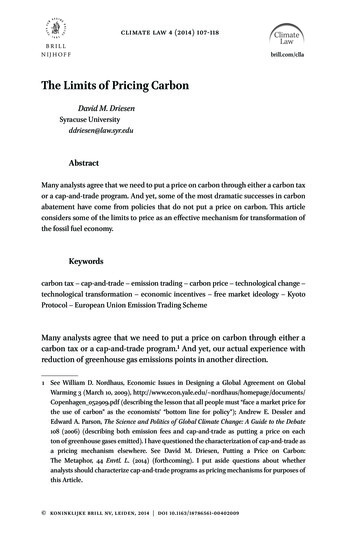
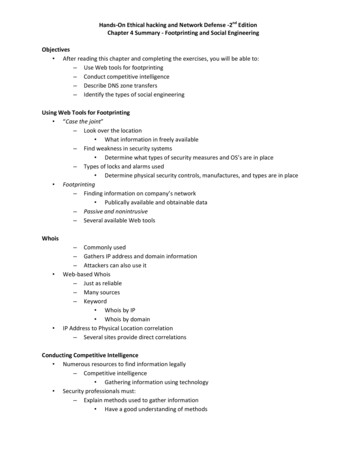
Broadly, there are three types of carbon footprint for companies:4 An organisational carbon footprint measures the GHG emissions from all the activitiesacross an organisation, including energy used in buildings, industrial processes andcompany vehicles. A supply chain carbon footprint measures the carbon impacts of the raw materials andservices that are purchased by an organisation to deliver its services and/or products. A product carbon footprint measures the GHG emissions over the whole life of aproduct from the extraction of raw materials and manufacturing through to its use, recyclingor disposal.Companies generate emissions from their supply chains to their operations and finally theproducts/services they produce and distribute.Figure 1Carbon Footprint fora Typical CompanyProduct FootprintProduction ofRaw MaterialsDistribution ofRaw MaterialsTheOrganisationDistributionof Productsand RetailConsumptionRe-useRecyclingDisposal Supply Chain Footprint Organisational FootprintSource: The Carbon Trust.GreenhouseGas ProtocolThe Greenhouse Gas (GHG) Protocol Standard is the most widely used greenhouse gasaccounting and reporting standard. The GHG Protocol categorises emissions into three ‘scopes’: Scope 1: Direct emissions from owned or controlled sources.Examples: Fuel combustion and company vehicles. Scope 2: Indirect emissions from purchased electricity, steam, heating and cooling consumedby the reporting company.Examples: Purchased electricity and heating. Scope 3: All other indirect emissions that occur in a company’s value chain.Examples: Purchased goods and services, business travel, and employee commutingand investments.The schematic below shows the three scopes across a typical company’s value chain.Carbon Footprinting: An Investor Toolkit3
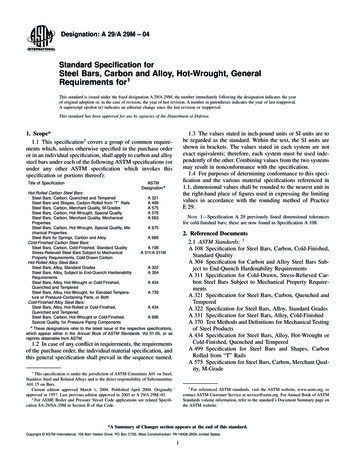
Figure 2Greenhouse GasProtocol Scopesand EmissionsCarbon FootprintScope 2 (Indirect)Scope 3 (Indirect)Scope 1 (Direct)Scope 3 (Indirect)Purchased Electricity,Steam, Heating andCooling For Own UsePurchased Goods andServicesCompany FacilitiesTransportation andDistributionCompany VehiclesCapital GoodsFuel and EnergyRelated ActivitiesProcessing of SoldProductsUse of Sold ProductsTransportation andDistributionEnd-of-Life Treatmentof Sold ProductsWaste Generated inOperationsLeased AssetsFranchisesBusiness TravelInvestmentsEmployee CommutingLeased ActivitesSource: Greenhouse Gas Protocol.Scope 3 ComplexitiesTake a US steel company with global operations and a long value chain. How should we measurethis company’s carbon footprint? In an ideal world, we would simply add up a company’s scope 1,2 and 3 emissions and divide by the company’s revenue (in million). In reality, it’s not so simple.Measuring scope 3 emissions is an inexact science with limited data and varying methodologiesgenerating sometimes widely varying results. While reporting on Scope 1 and 2 emissions isbecoming the norm in most jurisdictions, reporting on scope 3 emissions is largely voluntary.Sector-specific categorisation of companies can help to reveal the true sources of emissions.The chart below illustrates transition risk for various sectors, split by the scope of emissions inthose sectors. It’s clear that the impact of the uncertainties around measuring scope 3 emissionsis greatest in the energy sector.Carbon Footprinting: An Investor Toolkit4
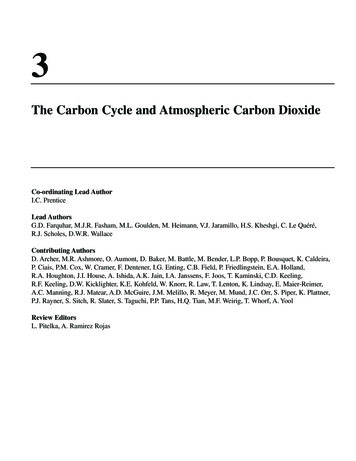
Figure 3Transition Risk: SectorBreakdown emissionsofScope 1 2 and Scope 33,0002,5002,0001,5001,0005000FinancialsScope 1 2Consumer Communication sUtilitiesScope 3Source: Trucost. Chart is provided for illustrative purposes.Another problem is double counting of emissions. One company’s scope 3 emissions can overlapwith another’s scope 1 emissions. Categories can also be double counted within Scope 3, forexample, if two companies account for third-party transportation of goods between them.5The scale of the problem is compounded because scope 3 emissions can constitute the largestportion of companies’ carbon footprint. It has been estimated that on average, more than 75% ofan industry sector’s carbon footprint is attributed to Scope 3 sources.6 Yet, a focus on scope3 emissions has been criticised for drowning valuable information on scopes 1 and 2 emissions ina sea of noise.Accounting for Scope3 GHG EmissionsBecause of these challenges, the TCFD currently recommends calculating carbon intensity usingscope 1 and 2 emissions and, if appropriate, scope 3 GHG emissions.The new European Union climate benchmark regulations encourage the use of Scope 3emissions, based on the Technical Expert Group’s (TEG’s) recommendations.Below is the TEG’s guidance on when companies should account for their scope 3 GHGemissions by sector.Figure 4TEG Guidance on Scope 3Emissions ReportingAt the date ofimplementationAt least energy(oil & gas) and miningAfter 2 yearsAfter 4 yearsAt least transportation,building, materials andindustrial activitiesEvery sectorSource: European Commission Technical Expert Group on Sustainable Finance (2020).Carbon Footprinting: An Investor Toolkit5
TCFD recommends calculating carbon intensity using scope 1 and 2 emissions“ Theand, if appropriate, scope 3 GHG emissions.”Given the current state of corporate Scope 3 GHG reporting, the TEG recognises that Scope 3data will likely be estimated.The effectiveness and efficiency of reduction targets will largely depend on how firms willsubstantially increase the volume and quality of its Scope 3 GHG emissions reporting or thequality of the Scope 3 estimations. We can expect the Scope 3 phase-in to help improve thequality and reliability of data (in particular for oil & gas and mining).The list of high-impact sectors should be reviewed once scope 3 emissions are implemented forevery sector. The financial sector for example, considered as low impact by the TEG, has a verylimited impact when considering scope 1 & 2 emissions but has relatively significant scope3 emissions, notably through the financing of carbon-intensive projects and infrastructure.Scope 3 emissions are also more important for companies in the services industries (7%–30%of emissions) where employee commuting and air transportation are common, compared tocompanies in the manufacturing industries ( 1% of total analysed emissions).7As progress is made to more accurately account for scope 3 emissions, a nuanced and prudentapproach is advised. Key for investors is to ensure companies are clearly reporting their carbonemissions and the data and assumptions used in their calculations. If companies are reportingscope 1 and 2 emissions only, they should be able to explain why they have excluded their scope3 footprint. Companies that do not disclose such information and cannot adequately explain itshould be a red flag.Below is a summary of the key characteristics of scope 1, 2 and 3 emissions.Figure 5Overview of Scope 1,2 and 3 GHG ProtocolCharacteristicsData Robustness and ReliabilityScope 1 2 GHG ProtocolDirect First Tier Indirect S&PTrucost GHG Protocol 4 GasesScope 1 2 3 GHG ProtocolMost robust and reliableGoodLeast robust and reliableChallenges to measuring scope 3Most commonly reportedSignificant estimationsComprehensiveness ofEmissions MeasureLeastModerateMost comprehensive(Food companies/Oil & Gas)Ease of Portfolio ImplementationLowest impact on TELow impact on TEMost challenging to implement withlarge potential tracking error impactRegulatory TrendsTCFD recommendedN/AEU requirement for all sectors within4 yearsSource: Trucost (2020).Carbon Footprinting: An Investor Toolkit6
Carbon IntensityWith total emissions over a given period in CO2e, carbon intensity can then be calculated bydividing emissions by a relevant measure of activity. For a typical company, this is usuallyrevenues (in M):Company (Issuer)Emission Intensity Tonnes of CO2e/Company(Issuer) RevenuesAs an example, between 2013 and 2018, Google’s carbon intensity fell from 23.2 to 5.7 tonnesof CO2 equivalent per million dollars of revenues.8 Google has stated that it has been carbonneutral since 2007 through investment in renewables and use of carbon offsets.The revenues approach offer a good indication of output efficiency as revenues are a goodproxy for production and indicate how operationally efficient portfolio companies are in termsof carbon emitted per unit of output.Using revenue (instead of physical or other metrics) to normalise the data tends to favourcompanies with higher pricing levels relative to their peers.9Other denominators can be used in the calculation of company carbon intensity. For example,the new EU climate benchmarks use a measure of carbon intensity that divides a company’semissions by its enterprise value.10However, significant changes in underlying companies’ market capitalisation can bemisinterpreted. It is sensitive to swings in market capitalisation and can therefore be difficultto compare year-on-year performance.Carbon intensity for a product or service can be calculated in a similar way to that forcompanies — emissions divided by a unit of product or activity. Some examples fromeveryday life are below:Figure 6Emissions Intensityfor CommonConsumer ProductsProductEmissions Intensity MetricCan of colakg CO2e per 330ml canWashing machinekg CO2e per washTelevisionkg CO2e per hour of viewingCarkg CO2e per kilometre drivenSource: Greenhouse Gas Protocol.Carbon Footprinting: An Investor Toolkit7
The Financial Stability Board’s Task Force on Climate-related Financial Disclosures (TCFD)recommends that companies disclose and report on emission intensity and several otherclimate-related metrics:Figure 7Categories of ClimateRelated Metrics andAssociated Risk TypesCategorySubcategoryRisk TypeDescription of MetricGreenhouse Gas(GHG) EmissionsEmission LevelTransitionTotal emissions (by type ofGHG, by source, by scope)Emission IntensityTransitionEmissions per output scalingfactor (e.g. revenues, sales,units produced)Embedded EmissionsTransitionEmissions per unit of fossilfuel reservesEnergy UsageTransitionTotal energy consumption(megawatt hour [MWh] orgigajoules [GJ] per year)Energy IntensityTransitionTotal energy consumedper output scaling factor(e.g. revenues, sales, unitsproduced, floor area)Energy MixTransitionPercent of energy by typeof energy source (e.g.,renewable, hydro, coal, oil,natural gas) (MWh or GJ)Energy/FuelSource: Trucost.Portfolio CarbonFootprintPortfolio carbon footprinting captures an investor’s exposure to carbon emissions by quantifyingthe GHG emissions associated with a portfolio’s underlying holdings and allows investors toquickly appraise large numbers of holdings for carbon emission hot spots’ regardless of assetclass, size, geography or portfolio style. As a result, it is often the first step investors take whenbeginning to address climate risk.Initiatives such as the Montreal Pledge and advisory groups such as the High Level Commissionon Carbon Pricing, the High-Level Expert Group on Sustainable Finance and the FinancialStability Board’s Task Force on Climate Related Financial Disclosures (TCFD) are all pushing forgreater transparency and strongly support carbon footprinting.The increased demand for portfolio carbon footprinting and the lack of clear establishedstandards have led to the emergence of several methodologies, sometimes with the same namebut using different methodologies.The four metrics highlighted below are the most widely adopted and well-defined by the TCFD:1. Weighted Average Carbon Intensity2. Total Carbon Emissions3. Carbon Emissions to Value Invested4. Carbon Emissions to Revenue IntensityThe most appropriate methodology to calculate a portfolio’s carbon footprint depends on theparticular question an investor wants to answer. The following descriptions can help investorsdiscern the specific intent of each carbon footprinting approach.Carbon Footprinting: An Investor Toolkit8
Carbon MetricsWeighted Average Carbon Intensity Weighted Average Carbon Intensity shows a portfolio’sexposure to carbon-intensive companies. As carbon-intensive companies are likely to bemore exposed to carbon pricing mechanisms or other carbon regulatory risks, this metric isregarded as a useful indicator of a portfolio’s potential exposure to transition risks (such as policyintervention or changing consumer behaviour) relative to other portfolios or benchmarks.This is the most popular metric since the TCFD endorsed it in its final recommendations reportin 2017. Unlike other approaches, the calculation does not require market capitalisation orenterprise value as inputs and can therefore be applied more easily to asset classes beyondequity and listed fixed income.Investors can calculate weighted average portfolio carbon intensity by combining Scope 1and Scope 2 GHG emissions then allocating based on portfolio weights (current value of theinvestment relative to current portfolio value).Weighted Average Carbon Intensity in*(current value of investment icurrent portfolio value iXissuer’s Scope 1 and Scope 2 GHG emissions iissuer’s M revenue i)* The sum of.The advantages of this approach are that it is more easily applied across asset classes andthe calculation is simple and easy to communicate. This metric also allows for portfoliodecomposition and attribution analysis.11Total Carbon Emissions The Total Carbon Emissions metric measures a portfolio’scarbon emissions allocated to the portfolio in absolute terms and is the starting point forcarbon footprinting.The methodology recommended by the TCFD adopts the equity ownership approach, consistentwith the GHG Protocol accounting standard, allocating emissions to an investor based on levelsof capital invested in a company and quantifies a market participant’s responsibility for thecarbon emissions of each holding. The higher the percentage holding in a company, the more ofits emissions you own. This metric also allows for portfolio decomposition and attribution analysisand is a useful tool for investors managing their portfolio to a specific carbon budget. However,portfolios cannot be compared on a like for like basis because the data are not normalised andsize can skew the results.Total Carbon Emissions in(current value of investment iissuer’s market captalisation i)*issuer’s Scope 1 and Scope 2 GHG emissions iMost often, absolute carbon emissions are apportioned from a company to a portfolio based onequity ownership (market capitalisation) or share of financing (enterprise value).For an equity portfolio, market capitalisation is the most appropriate apportioning metric whencalculating an investor’s ‘ownership’ of emissions. However, as investors have started to lookbeyond their equity portfolios, the apportioning metric used has begun to vary.Carbon Footprinting: An Investor Toolkit9
For a fixed income portfolio, balanced fund or even an aggregated footprint across asset classes,enterprise value, net debt, gross debt or total invested capital might all be considered. However,significant changes in underlying companies’ market capitalisation can be misinterpreted. It issensitive to swings in market capitalisation and can therefore be difficult to compare year-onyear performance.Carbon Emissions to Value Invested By normalising Total Carbon Emissions, marketparticipants can compare portfolios of different sizes and still use a metric that is consistentwith the GHG protocol. The Carbon Footprint metric offers one approach for doing this, showingcarbon emission for a portfolio normalised by the market value of the portfolio or fund andexpressed in metric tons Co2e/ million invested. This approach tells an investor which portfoliosare the most carbon intensive, and therefore, where attention should be focused first when itcomes to managing carbon risk.Carbon Emissions to Value Invested in(current value of investment iissuer’s market captalisation i)*issuer’s Scope 1 and Scope 2 GHG emissions icurrent portfolio value ( M)Carbon Emissions to Revenue Intensity The Carbon to Revenue Intensity performs asimilar function to the Carbon Emissions to Value Invested metric but, in addition, it normalisesthe Total Carbon Emissions by the issuer’s revenues to enable comparison across portfoliosof different sizes.The revenues approach allows for a better indication of output efficiency as revenues are a goodproxy for production. For example, if an investor owns 1% of a company, they also own 1% of itsemissions and 1% of its revenues.Carbon Emissions to Revenue Intensity in(current value of investment iissue’s market captalisation iin()*issuer’s Scope 1 and Scope 2 GHG emissions icurrent value of investment iissuer’s market captalisation i)*issuer’s M revenue iThe method is consistent with GHG Protocol and is comparable across portfolios of all sizes.Finally, it normalises for carbon emission efficiency with currency exchange rates being equal.Carbon Footprinting: An Investor Toolkit10
Below is a summary of the key carbon metrics.Figure 8TCFD Carbon MetricsMetricUnitsWeighted AverageCarbon IntensityTotal CarbonEmissionsCarbon Emissions toValue InvestedCarbon Emissions toRevenue IntensityMetric tonsCO2e/million revenuesMetric tons CO2eMetric tonsCO2e/million revenuesMetric tonsCO2e/million revenuesNoYesYesYesThe weighted averageof individual companycarbon intensitiesThe aggregatedapportioned carbonemissions of theportfolio constituentsThe aggregationof apportionedcarbon emissionsof constituents per 1 million investedThe aggregationof apportionedcarbon emissionsof constituents per 1 million generated inapportioned revenuesOwnershipapproach usedMethodologySource: Trucost.The End GoalBefore undertaking any analysis of portfolio carbon footprinting or the impact of carbon pricingon your portfolio, it’s important to first determine your end goal.Does your portfolio or fund aim to manage climate-related risks? Do you adopt an exclusionaryapproach to companies with high carbon emissions and brown revenues? Do you want tounderstand how carbon price risk can be modelled under different scenarios? Or do you simplywant to know your portfolio or fund’s exposure relative to the broader market?“Before undertaking any analysis, determine your end goal”Carbon metrics can be used alongside portfolio footprinting to provide investors with a moreholistic understanding of their exposure to climate risks and opportunities. This is particularlyuseful for institutional investors, who have hundreds or thousands of holdings across portfolios,with different benchmarks, geographic exposure and investment styles, often run by differentasset managers.Endnotes1United Nations Framework Convention onClimate Change.2US Environment Protection Agency (2020).3United States Center for Climate and EnergySolutions (2018).4The Carbon Trust.5Carbon Disclosure Project (2020).6‘The Growing Importance of Scope 3 Greenhouse GasEmissions From Industry’, Hertwich and Wood (2018).Carbon Footprinting: An Investor Toolkit7TCFD (2020).8Statista (2018).9Enterprise value is the total value of a company’smarket capitalisation and market value of debt, lesscash and equivalents.10 ‘Categorization of Scope 3 Emissions for StreamlinedEnterprise Carbon Footprinting’, Huang et al (2009).11 Nationally Determined Contributions (NDCs) are theefforts each country in the Paris Agreement is takingto reduce their emissions and adapt to the impacts ofclimate change.11
About State StreetGlobal AdvisorsOur clients are the world’s governments, institutions and financial advisors. To help them achievetheir financial goals we live our guiding principles each and every day: Start with rigorBuild from breadthInvest as stewardsInvent the futureFor four decades, these principles have helped us be the quiet power in a tumultuous investingworld. Helping millions of people secure their financial futures. This takes each of our employeesin 31 offices around the world, and a firm-wide conviction that we can always do it better. As aresult, we are the world’s third-largest asset manager with US 3.47 trillion* under our care.* This figure is presented as of December 31, 2020 and includes approximately 75.17 billion of assets with respect toSPDR products for which State Street Global Advisors Funds Distributors, LLC (SSGA FD) acts solely as the marketingagent. SSGA FD and State Street Global Advisors are affiliated.ssga.comState Street Global AdvisorsWorldwide EntitiesAbu Dhabi: State Street Global Advisors Limited,ADGM Branch, Al Khatem Tower, Suite 42801,Level 28, ADGM Square, Al Maryah Island, P.O Box76404, Abu Dhabi, United Arab Emirates.Regulated by the ADGM Financial ServicesRegulatory Authority. T: 971 2 245 9000.Australia: State Street Global Advisors,Australia, Limited (ABN 42 003 914 225) is theholder of an Australian Financial Services License(AFSL Number 238276). Registered office: Level14, 420 George Street, Sydney, NSW 2000,Australia. T: 612 9240-7600. F: 612 9240-7611.Belgium: State Street Global Advisors Belgium,Chaussée de La Hulpe 120, 1000 Brussels,Belgium. T: 32 2 663 2036. F: 32 2 672 2077.SSGA Belgium is a branch office of State StreetGlobal Advisors Ireland Limited. State StreetGlobal Advisors Ireland Limited, registered inIreland with company number 145221, authorizedand regulated by the Central Bank of Ireland, andwhose registered office is at 78 Sir JohnRogerson’s Quay, Dublin 2. Canada: State StreetGlobal Advisors, Ltd., 1981 McGill College Avenue,Suite 500 , Montreal, Qc, H3A 3A8, T: 514 2822400 and 30 Adelaide Street East Suite 800,Toronto, Ontario M5C 3G6. T: 647 775 5900.France: : State Street Global Advisors IrelandLimited, Paris branch is a branch of State StreetGlobal Advisors Ireland Limited, registered inIreland with company number 145221, authorizedand regulated by the Central Bank of Ireland, andwhose registered office is at 78 Sir JohnRogerson’s Quay, Dublin 2. State Street GlobalAdvisors Ireland Limited, Paris Branch, isregistered in France with company number RCSNanterre 832 734 602 and whose office is atImmeuble Défense Plaza, 23-25 rue DelarivièreLefoullon, 92064 Paris La Défense Cedex, France.T: ( 33) 1 44 45 40 00. F: ( 33) 1 44 45 41 92.Germany: State Street Global Advisors GmbH,Brienner Strasse 59, D-80333 Munich.Authorized and regulated by the Bundesanstaltfür Finanzdienstleistungsaufsicht (“BaFin”).Registered with the Register of CommerceMunich HRB 121381. T: 49 (0)89-55878-400.F: 49 (0)89-55878-440. Hong Kong: StateStreet Global Advisors Asia Limited, 68/F, TwoInternational Finance Centre, 8 Finance Street,Central, Hong Kong. T: 852 2103-0288. F: 8522103-0200. Ireland: State Street Global AdvisorsIreland Limited is regulated by the Central Bankof Ireland. Registered office address 78 Sir JohnRogerson’s Quay, Dublin 2. Registered Number:145221. T: 353 (0)1 776 3000. F: 353 (0)1 7763300. Italy: State Street Global Advisors IrelandLimited, Milan Branch (Sede Secondaria diMilano) is a branch of State Street GlobalAdvisors Ireland Limited, registered in Irelandwith company number 145221, authorized andregulated by the Central Bank of Ireland, andwhose registered office is at 78 Sir JohnRogerson’s Quay, Dublin 2. State Street GlobalAdvisors Ireland Limited, Milan Branch (SedeSecondaria di Milano), is registered in Italy withcompany number 10495250960 - R.E.A.2535585 and VAT number 10495250960 andwhose office is at Via Ferrante Aporti, 10 - 20125Milano, Italy. T: 39 02 32066 100. F: 39 0232066 155. Japan: State Street Global Advisors(Japan) Co., Ltd., Toranomon Hills Mori Tower 25F1-23-1 Toranomon, Minato-ku, Tokyo 105-6325Japan. T: 81-3-4530-7380. FinancialInstruments Business Operator, Kanto LocalFinancial Bureau (Kinsho #345), Membership:Japan Investment Advisers Association, TheInvestment Trust Association, Japan, JapanSecurities Dealers’ Association. Netherlands:State Street Global Advisors Netherlands, ApolloBuilding, 7th floor Herikerbergweg 29 1101 CNAmsterdam, Netherlands. T: 31 20 7181701. SSGANetherlands is a branch office of State StreetGlobal Advisors Ireland Limited, registered inIreland with company number 145221, authorizedand regulated by the Central Bank of Ireland, andwhose registered office is at 78 Sir JohnRogerson’s Quay, Dublin 2. Singapore: StateStreet Global Advisors Singapore Limited, 168,Robinson Road, #33-01 Capital Tower, Singapore068912 (Company Reg. No: 200002719D,regulated by the Monetary Authority ofSingapore). T: 65 6826-7555. F: 65 6826-7501.Switzerland: State Street Global Advisors AG,Beethovenstr. 19, CH-8027 Zurich. Registeredwith the Register of Commerce Zurich CHE105.078.458. T: 41 (0)44 245 70 00. F: 41 (0)44245 70 16. United Kingdom: State Street GlobalAdvisors Limited. Authorized and regulated bythe Financial Conduct Authority. Registered inEngland. Registered No. 2509928. VAT No.5776591 81. Registered office: 20 Churchill Place,Canary Wharf, London, E14 5HJ. T: 020 33956000. F: 020 3395 6350. United States: StateStreet Global Advisors, 1 Iron Street, Boston, MA02210-1641. T: 1 617 786 3000.Important InformationThe whole or any part of this work may not bereproduced, copied or transmitted or any of itscontents disclosed to third parties withoutSSGA’s express written consent.The returns on a portfolio of securities whichexclude companies that do not meet theportfolio’s specified ESG criteria may trail thereturns on a portfolio of securities which includesuch companies. A portfolio’s ESG criteria mayresult in the portfolio investing in industrysectors or securities which underperform themarket as a whole.Responsible-Factor (R Factor) scoring isdesigned by State Street to reflect certain ESGcharacteristics and does not representinvestment performance. Results generated outof the scoring model is based on sustainabilityand corporate governance dimensions of ascored entity.It does not take into account any investor’sparticular investment objectives, strategies,tax status or investment horizon. You shouldconsult your tax and financial advisor. Allinformation is from SSGA unless otherwisenoted and has been obtained from sourcesbelieved to be reliable, but its accuracy is notguaranteed. There is no representation orwarranty as to the current accuracy, reliabilityor completeness of, nor liability for, decisionsbased on such information and it should not berelied on as such.The views expressed in this material are theviews of Carlo M. Funk and Kingsmill Bondthrough the period ended May 7, 2020 and aresubject to change based on market and otherconditions. This document contains certainstatements that may be deemed forwardlooking statements. Please note that anysuch statements are not guarantees of anyfuture performance and actual results ordevelopments may differ materially fromthose projected.Investing involves risk including the risk ofloss of principal.The information contained in this communicationis not a research recommendation or‘investment research’ and is classified as a‘Marketing Communication’ in accordance withthe Markets in Financial Instruments Directive(2014/65/EU) or applicable Swiss regulation.This
Broadly, there are three types of carbon footprint for companies:4 An organisational carbon footprint measures the GHG emissions from all the activities across an organisation, including energy used in buildings, industrial processes and company vehicles. A supply chain carbon footprint measures the carbon impacts of the raw materials and