Transcription
Carbon footprint of methanolFor: Methanol InstituteDate:January 2022Authors: Carlo HamelinckMark Bunse
ColophonTitleCarbon footprint of methanolCommissioned byMethanol InstituteAuthorsCarlo Hamelinck, Mark BunseBackgroundCarbon footprint insights for methanol are scarce and often outdated. The MethanolInstitute would like to increase the understanding of carbon footprint assessment withinthe industry, and at the same time obtain insights in the current status of methanolclimate impacts. In this project, we calculated the carbon footprint of methanol for 12companies and developed detailed individual reports (confidential). This – main - reportpresents the aggregated and anonymised results, a detailed description of theunderlying methodology and the main findings of the project.DisclaimerThe carbon footprint calculations have been prepared on basis of data received from theparticipating companies. The research was carried out between January and October2021. studio Gear Up makes no statements about the quality of the data received.DateJanuary 2022 VOF studio Gear Up, 2021Cruquiusweg 111-A, 1019 AG Amsterdam, the Netherlands 31-20-2117205info@studiogearup.com, www.studiogearup.com
Introduction
4IntroductionMethanol Institute The Methanol Institute represents methanol producers across the globe. The far majority of methanol is currently produced from fossilenergy sources, mainly from natural gas. Several companies are producing methanol from renewable sources, and more companies aredeveloping processes to produce methanol from a variety of renewable sources: e-fuels from renewable electricity, biomethanol, etcetera.Methanol is an important base chemical and, when produced from renewable sources, methanol is amongst others interesting as a lowcarbon alternative fuel for shipping. The Methanol Institute requires adequate and up-to-date information on the environmental performanceof methanol, as well as a comparison to the fuels it proposes to replace. Furthermore, methanol using industries increasingly ask for insight inthe carbon footprint of the methanol they buy, in an endeavour to lower their own carbon footprint.The carbon footprint, or greenhouse gas performance of methanol can be calculated through accounting for all material and energy inputsand outputs in the production and supply chain. The greenhouse gas performance of methanol depends strongly on the type of feedstock,on conversion efficiencies and on energy use during the production process.Some production pathways have been assessed in the past. However, the underlying data for such calculations is typically thin andsometimes up to 25 years old.For a fruitful conversation with methanol using industry, shipping industry and renewable energy policy makers, the Methanol Institute needsharmonized calculations based on the latest insights.Approach and deliverables Therefore, this study project aims to update the carbon footprint insights, with harmonized and detailed carbon footprint calculations ofmajor methanol production pathways from different types of fossil and renewable feedstock. The study is based on a detailed insights of individual producers. 12 companies participated in the project. They supplied data on theirprocess, feedstock and products, and additional energy consumption. On basis of the information supplied, the carbon footprint wascalculated for the methanol produced by these participating companies and individual reports have been developed. The individual reportsare not shared with the Methanol Institute, because they contain commercially sensitive information. In the current report, the results from the individual calculations are summarised in an aggregated and anonynised manner. Also, this reportfurther details the underlying methodology.
5Methodological notionMethodology of the EU Renewable Energy Directive was applied The carbon footprint calculations in this report constitute a lifecycle assessment, albeit only on the climate impacts. All major greenhousegasses are taken into account (CO2, CH4 and N2O mainly) and expressed in CO2 equivalent units. More specifically, the calculations areperformed in line with the European Renewable Energy Directive, known as RED II [EC 2018]. The methology of the RED II is simple and straightforward and can be extended (relatively) easily to address any type of feedstock, orcombinations of multiple feedstocks. Although the methodology was developed for biofuels, it can be applied to all fuels A bespoke tool was developed to apply the method of the directive. The full methodology is described in the annexes.Methodology of GREET was deemed less suitable for current calculations – but some parameters have been used It was considered to (also) apply the GREET model, developed by Argonne National Laboratory in the USA. This model is often used tounderstand the climate impact of fuels and vehicles in the American market. Currently, GREET includes the calculation of methanol produced from natural gas, biomass and coal. It does not currently include theproduction of methanol from (renewable) electricity, options related to utilising or selling CO2, or to combine multiple feedstocks ortechnology pathways in a single facility. The GREET model is not flexible to calculate other pathways and feedstocks. Several parameters have been derived from the GREET model.Main difference The main difference between GREET and the RED II methodology resides in the treating of co-products. RED II is based on the principle that all co-products carry a responsibility for the supply chain and climate impacts are equallydistributed over the total energy output. GREET is based on the principle that co-products avoid a production process elsewhere, and the emissions that such a process wouldhave caused may be subtracted from the main product.Both approaches to co-products are valid, but require different information and will give different outcomes. GREET requires a deeperunderstanding of co-products which is often not available, and is subject to changes over time and geographically. RED II gives moreconsistent results and is (in this aspect) easier to apply.[EC 2018, Directive 2018/2001 on the promotion of the use of energy from renewable sources, Annex V.C]
Carbon footprint of methanol viadifferent pathways
7Carbon footprint of methanolKey findings 1/2Overarching findings The carbon footprint of methanol depends on the feedstock and the production pathway.The majority of emissions in fossil pathways resides in the stoichiometric end-of-life emissions. In pathways based on renewable feedstockthese emissions are climate neutral. This causes a significant reduction in climate emission and the carbon footprint greatly improves.Good performing methanol from renewable sources can achieve a large emission saving in comparison with fossil reference fuels such asgasoline, diesel or current marine fuels.Variations within feedstock in the same category, technological differences in the installation set-up, and supply chain differences cause asignificant difference in the lifecycle carbon footprint results.Due to the differences in outcomes one should not apply default carbon footprint factors for fossil or renewable methanol or even perfeedstock category. Instead, the carbon footprint of (renewable) methanol should be measured and certified to account for the individualdifferences – as is advised for any renewable fuel.Natural gas based methanol In general, methanol from natural gas or coal has a high carbon footprint, somewhat higher or lower than that of fossil diesel and gasolinedepending on the sourcing of the natural gas and the set-up of the facility. With state-of-the-art technologies, such as CO2 recirculation, thecarbon footprint of the facility can be improved. When CO2 is captured from the facility exhaust emissions (and used elsewhere orsequestered underground), the facility emissions can become near zero.However, the majority of the lifecycle emissions reside in the end-of-life stage, for instance when the methanol is combusted in a ship orother vehicle. These emissions are stoichiometric and cannot be avoided. They are the same for any methanol. However, if part of thefeedstock carbon is supplied from a sustainable resource such as CO2 captured from other installations, or if part of the energy is suppliedfrom renewable electricity (via electrolysis and hydrogen), these end-of-life carbon dioxide emissions become partially net climate neutral,and the lifecycle carbon footprint of the methanol decreases.Coal based methanol Methanol from coal has a very high carbon footprint. Most of the lifecycle emissions reside in the conversion process and could be avoidedby a better carbon management in the installation (CO2 recirculation, capture and sequestration).Furthermore, significant emissions take place in the mining, cleaning and transportation of the coal feedstock. Some of these emissions maybe avoidable, but this was not assessed.If part of the feedstock carbon or energy input would be replaced by renewable sources, the end-of-life emissions could become partiallynet neutral.
8Carbon footprint of methanolKey findings 2/2Biomethane based methanol The end-use emissions from methanol from biomethane are climate neutral and therefore not counted.When based on manure, the production of biomethane via anaerobic digestion avoids emissions that would have taken place duringalternative treatment (or no treatment) of methane. Therefore, such biomethane has a negative carbon footprint, and subsequent methanolavoids 100% emissions in comparison with fossil fuel comparators.When based on organic residues or some types of crops the carbon footprint is low and an emission reduction of 80% is achieved. Onbasis of other crop feedstock the emission reduction is still above 65%.Solid biomass based methanol The end-use emissions from methanol from solid biomass are climate neutral and therefore not counted.When the feedstock consists of (sustainably managed) forestry residues or short rotation energy crops, the overall carbon footprint is low andthe emission reduction is above 70 - 80%.Methanol from municipal solid waste The carbon footprint of methanol from municipal solid waste depends on the fraction of organic waste, and on the judgement of the nonorganic part of the waste.High fractions of organic waste and of (otherwise) non-recyclable material lead to a low carbon footprint and high savings.If the non-organic fraction consists for a large part of recyclable material, then it may not be considered a waste and the carbon footprintincreases.Methanol from renewable electricity in combination with captured carbon Assuming that the source carbon dioxide is renewable or concerns the captured and unavoidable emissions from another process, the endof-life emissions have no net climate impact.The carbon footprint of methanol produced from solar PV or wind sourced electricity is low and an emission reduction of 90% is achieved.When using hydroelectricity, the carbon footprint increases, but still the savings compared to fossil based methanol are considerable.However, if electricity is sourced from the grid then the emissions associated with the feedstock production rise steeply and the lifecyclecarbon footprint can even be above that of the fossil fuel reference.
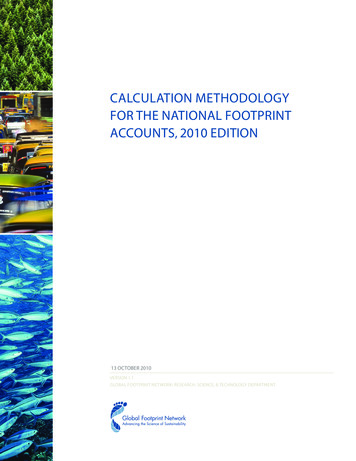
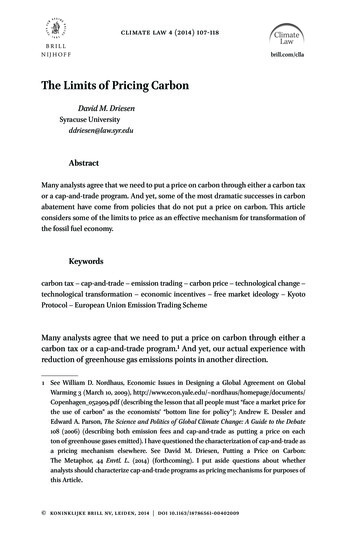
9Carbon footprint of methanoldepends mainly on the feedstock350End-of-life 250Methanol production200Intermediate te processingElectricityFeedstock transportFeedstock productionCO₂ removal50Supply (resource conversion)EU gridPVSRC poplarForestry residuesMaizeOrganic wasteCow manure-100Coal-50Natural gas0MSW (70% biogenic) Methanol transportNatural gas (RED II)Greenhouse gas emissions (g CO₂eq/MJ)300Total emissionsMethanol produced from different feedstocks varies considerably in carbon footprint performance.Most methanol is currently produced from natural gas. Modern facilities today produce methanol with an estimated carbon footprint of about110 g CO2eq/MJ, which is higher than what was considered state-of-the art two decades ago, of about 97 g CO2eq/MJ, most likely becausethe insight has improved with data in the current study.Production from coal only takes place in China and has a high carbon footprint, of nearly 300 g CO2eq/MJ, due to large emissions associatedwith both the mining of coal and the methanol conversion process.Production from renewable sources, such as from biomethane, solid biomass, municipal solid waste (or MSW, which contains a considerablefraction of organic waste), and renewable energy, has a low carbon footprint. Most of these pathways achieve 10-40 g CO2eq/MJ, and somepathways even have negative emissions (-55 gCO2eq/MJ for methanol from biomethane from cow manure) which means effectively that CO2is removed from the atmosphere or that the pathway avoids emissions from other processes.
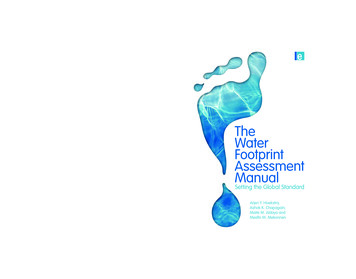
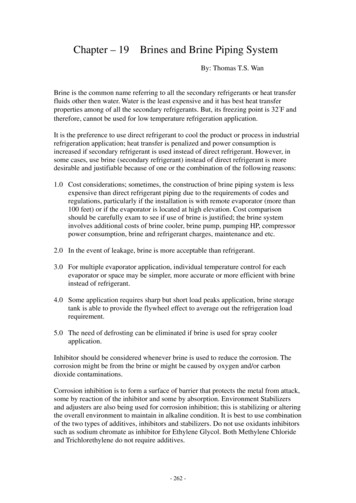
10Carbon footprint of renewable methanolcan achieve the EU RED II greenhouse gas emission reduction thresholds120Fossil fuel comparator Methanol transport80Methanol production604020-50%Intermediate transport-60%-65%Intermediate processingFeedstock transportFeedstock productionPVMSW (25% fossil)SRC poplarForestry residuesMaizeHFOOrganic waste-60Cow manure-40Diesel-20Gasoline0-80 End-of-lifeFossil fuel comparatorGreenhouse gas emissions (g CO₂eq/MJ)100CO₂ removalSupply (resource conversion)Total emissionsWhen methanol from renewable sources is sold as renewable fuel in the EU market, it has to achieve at least 50%, 60% or 65% emissionreduction in comparison with the fossil fuel comparator of 94 g CO2eq/MJ according to RED II. The exact threshold depends on when theinstallation started operation, with the strictest 65% threshold for installations that started from 2021 onwards.The main advantage of renewable methanol is that the end-use emission counts as zero, because the end-use emissions were eitherpreviously absorbed from the atmosphere (in the case of biogenic feedstock), or de facto delayed emissions that were captured fromindustrial sources (in the case of e-methanol produced from renewable electricity.All renewable methanol in this overview achieves the 50% emission reduction threshold for renewable fuels produced in installations thatstarted operation before 6 October 2016. With improvements in feedstock production (maize), or processing technology (only produce formbiogenic and non recyclable fraction in MSW), it should be possible for all renewable pathways to achieve the 65% threshold.
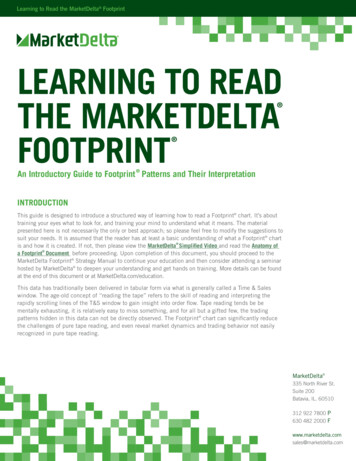
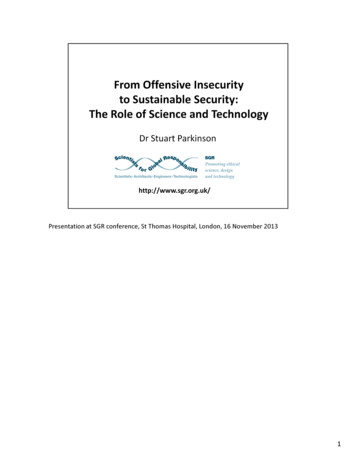
11Emissions from the production of methanol from natural gasGreenhouse gas emissions (g CO₂eq/MJ)120 11010090End-of-life80Methanol transport70Supply (resource conversion)60Methanol production5040Intermediate transport30Intermediate processing20Feedstock transport10Feedstock production0Natural gas(RED II)Natural gas(current study)Natural gaswith CO₂ recycle(current study)Methanol produced from natural gas in a state-of-the-art methanol production facility has a carbon intensity of about 110 g CO2eq/MJ. The footprint isespecially sensitive to the source of the natural gas. When sourced from the less emitting sources today, the methanol supply chain emissions candecrease to about 103 g CO2eq/MJ. A same effect will be achieved by improvements projected by IEA towards 2030.When exhaust CO2 is recycled back to the methanol reactor, the production of methanol increases and facility emissions decrease, and as a result thelifecycle emissions per MJ of product decrease to 93-101 g CO2eq/MJ.These results are between 4 g CO2eq/MJ better and 13 CO2eq/MJ worse than the value used in calculations by EU Joint Research Centre JRC for therecast Renewable Energy Directive (RED II) [EC JRC 2017].Note that the end-of-life emissions are defined by the chemical structure of methanol and are (always) 69 g CO2/MJLHV. The difference between the resultsabove is therefore completely determined by the well-to-tank emissions arising mainly from natural gas production and the conversion process, andfurthermore discussed on the next page.Furthermore, note that the JRC “resource conversion” emissions only concern emissions from the conversion process and upstream natural gas. Thecurrent study includes high emissions from the exploration and transport of natural gas, and includes the transport of methanol to customer.The calculation of carbon intensity is in line with the greenhouse gas accounting methodology of RED II Annex V.C.Underlying parameters of the JRC report and current study are explained in the Annexes (Page 20 and onward).[EC JRC 2017 Definition of input data to assess GHG default emissions from biofuels in EU legislation]
12Methanol from natural gasFull lifecycle emissions250010080End-of-lifeMethanol transport60Methanol productionIntermediate transport40Intermediate processingFeedstock transport20Feedstock productionCO₂ removal0Natural gas Greenhouse gas emissions (g CO₂eq/kg)Greenhouse gas emissions (g IntermedIntermed500FeedstocFeedstocCO₂ remo0Natural gasIn the full lifecycle emissions the end-of-life emissions of the methanol are included. This representation is relevant if methanol is used as a fueland is therefore (eventually) combusted. This representation is also known as well-to-wake or well-to-wheel.Results are expressed per MJLHV (left) and per kg of methanol (right).The end-of-life emissions are based on the methanol molecule: for each gram of fossil based methanol 44/32 gram of CO2 is emitted. Thisequals 69 g/MJLHV. This means that the largest part of the lifecycle emission cannot be avoided when natural gas or another fossil resource isthe feedstock.Full lifecycle emissions for natural gas based methanol, via state-of-the art technology, are 103 - 110 g CO2/MJLHV or 2.05 - 2.20 kg CO2eq/kg.The higher end of the range is shown in the graphs and represents average natural gas wells globally. The lower end is only possible if naturalgas is sourced from wells with low fugitive methane emissions, flaring and energy requirements, as further discussed on the next page.In the shown case, the end-of-life emissions represent 62% of the total lifecycle emissions.
13Methanol from natural gasSupply chain emissions 900403530252015105Methanol transportMethanol productionIntermediate transportIntermediate processingFeedstock transportFeedstock productionGreenhouse gas emissions (g CO₂eq/kg)Greenhouse gas emissions (g CO₂eq/MJ)45800700600500400300[IEA 2020, Spectrum of the well-to-tank emissions intensity of global gas production & Methane Tracker 2020]Methanol pIntermediaIntermedia200Feedstock100FeedstockCO₂ removal0Natural gasNatural gasBecause the end-of-life emissions of fossil based methanol are fixed, it is useful to have a detailed look at the supply chain emissions, excluding themethanol end-of-life emissions. If the methanol is to be used as a fuel, this scope is usually called well-to-tank.Supply chain emissions result from the production of the natural gas (fugitive, flaring and venting), transport of the natural gas (energy consumption andspills), the methanol production itself (energy consumption and stack emissions), and methanol transport to final customer.Upstream emissions from natural gas sourcing on average are about 11.4 g CO2eq/MJ natural gas, or 568 g/kg natural gas, mainly depending on thefugitive methane emissions, flaring and energy consumption involved in the production of natural gas, with smaller impacts from natural gas downstreamprocessing and transport. This contributes about 17 g CO2eq/MJ or 367 g CO2eq/kg methanol to the total methanol supply chain emissions. Theseemissions could be halved in the best cases (10% lower bound of emissions from natural gas observed globally, see Page 25), but it could also double inthe worst case (10% upper bound).IEA identified the opportunity to reduce the average natural gas supply related emissions globally with about 50% [IEA 2019]. This would reduce thesupply chain (and total lifecycle) emissions with some 9 g CO2eq/MJ methanol.For a modern natural gas to methanol process, the emissions from the production process are typically about 20 g CO2eq/MJ or 400 g CO2eq/kg. Theexact carbon balance over the installation depends on the carbon content of the natural gas feedstock. For instance, North West European gas has acarbon content of 63%, whereas Canadian gas has a carbon content of about 70%. A higher carbon content may increase the carbon emissions from theinstallation, or if the technology can make optimal use of it, it may increase the product yield.The emissions from methanol transport (5000 km by bulk tanker ship assumed) are relatively small in comparison to natural gas sourcing and conversion0Methanol tCO₂ remov
14Methanol from natural gas with CO2 recirculationSupply chain emissions7003025Methanol transport20Methanol production15Intermediate transportIntermediate processing10Feedstock transport5Feedstock productionCO₂ removal0Natural gas with CO2 recycleGreenhouse gas emissions (g CO₂eq/kg)Greenhouse gas emissions (g ntermed200Feedstoc100FeedstocCO₂ remo0Natural gas with CO2 recycle Several methanol production facilities apply CO2 recirculation to further increase methanol production. At the same time this consumes CO2that would otherwise be vented. The combined effect (less emissions from the facility, divided over more product) of a 10% increase inmethanol production (as observed in one installation) can therefore reduce the lifecycle carbon footprint with about 10 g/MJ. If both the upstream emissions from natural gas supply are reduced (discussed on the previous slide) and CO2 recirculation is applied,methanol could have a carbon footprint of around about 93 g CO2eq/MJ (25 g CO2eq/MJ upstream emissions 69 g from combustion) Note that the scope for applying CO2 recirculation within existing facilities is limited by reactor sizes and other bottlenecks throughout theentire installation.
15Methanol from coalFull lifecycle emissions7000300250End-of-lifeMethanol transport200Methanol production150Intermediate transportIntermediate processing100Feedstock transport50Feedstock productionCO₂ removal0Coal Greenhouse gas emissions (g CO₂eq/kg)Greenhouse gas emissions (g O₂ remo0CoalThe carbon footprint of methanol produced from coal is nearly 300 g CO2eq/MJ, which is about 3 times higher than that of natural gas basedmethanol.The supply chain emissions mainly originate from the conversion facility, and also the mining, washing and selection of coal causes significantcarbon impacts. We assume that significant improvements are possible in the conversion process, via CO2 recirculation as is observed innatural gas based facilities, but we found no information about such technological improvement options for coal.The end-use emissions are (stoichiometrically) the same as for all fossil based methanol, namely 69 g CO2eq/MJ.
16Methanol from biomethaneSupply chain emissions depend on feedstock60End-of-lifeGreenhouse gas emissions (g CO₂eq/MJ)40 Methanol transport20Methanol production0Cow manure-20Pig manureOrganic wasteMaize(Lower range)Maize(Higher range)Intermediate transportIntermediate processing-40Feedstock transport-60Feedstock production-80-100CO₂ removalTotal emissions-120Biomethaneis produced in an anaerobic digestion facility and via the gas grid transported to a methanol production facility.-140Furthermore, the same technology, mass and energy balances are assumed as for the natural gas pathway.Methanol produced from biomethane has a carbon footprint that can vary from -103 to 38 g CO2eq/MJ in the pathways assessed.Most anaerobic digestion facilities use a variety of feedstock to strike an economic balance between emission reduction (best with wastestreams and manure) and biogas output (highest with crops). Note that it is not economically feasible to use only manure or waste streams.Digestion of cow manure avoids conventional treatment and the associated methane emissions. The Renewable Energy Directive thereforeawards a bonus of 45 g CO2eq/MJ manure or 54 kg CO2eq/t fresh matter (regardless of the type). Biomethane from manure thus has anegative footprint.Due to the efficiency losses when converting biomethane into biomethanol, the negative emissions per MJ increase: Biomethanol isrewarded for being an effective manure remover per unit of product, and a lower conversion efficiency magnifies this effect.The feedstock component of the biomethanol is in all cases about 1.6 – 1.8 times larger than that of the biomethane intermediate product.For maize the bandwidth of results relates to variations in the cropping system, crop yields, and in the amount and application of fertiliser.
17Methanol from woodSupply chain emissions depend on type of biomassGreenhouse gas emissions (g CO₂eq/MJ)30End-of-lifeMethanol transport25Methanol productionIntermediate transport20Intermediate processingFeedstock transport15Feedstock production10CO₂ removalTotal emissions50Forestry residues SRC poplarMethanol produced from wood has a carbon footprint between 10 and 20 g CO2eq/MJ depending on the type of wood.Forest residues have no emissions associated with the feedstock production, assuming they come available at a central point, with allprevious energy use allocated to the main product, i.e. timber or pulpwood. Some types of forestry residues require some processing at thesource location, such as bundling or chipping, which would incur feedstock production emissions.Short Rotation Coppice (SRC) poplar is an energy crop grown in a plantation setting, with limited inputs of energy and fertiliser [JRC 2017].Emissions of the methanol production are associated with the consumption of natural gas (as defined in the natural gas pathway) andelectricity (wind power).[EC JRC 2017 Solid and gaseous bioenergy pathways: input values and GHG emissions]
18Methanol from municipal solid wasteSupply chain emissions depend on share recyclableGreenhouse gas emissions (g CO₂eq/MJ)60End-of-lifeMethanol transport50Methanol productionIntermediate transport40Intermediate processingFeedstock transport30Feedstock production20CO₂ removalTotal emissions100MSW0 MSW10MSW25MSW50Methanol produced from municipal solid waste (MSW) has a carbon footprint of 10-55 g CO2eq/MJ depending on the composition of theMSW if the fossil carbon content increases from 0% to 50%.If all carbon in the MSW is of biogenic origin, or if the non-biogenic share is considered to be climate neutral, then the overall emission canbe as low as 10 g CO2eq/MJ (MSW0 case). The limited emissions of the methanol production result from the consumption of natural gas (asdefined in the natural gas pathway) and electricity (wind power).If, however, the non-biogenic share contains recyclable material, then it may not be considered a waste. The carbon emissions, from theprocess and final product together will then (partly) cause a climate impact. The graph shows how first the climate emissions from theprocess increase (because we try to allocate the least climate emissions to the final product, see Page 43), and then the emissions from enduse increase when moving to 10%, 25% or 50% non-climate neutral carbon in the MSW.
19e-methanolSupply chain emissions depend on source of electricityGreenhouse gas emissions (g CO₂eq/kg)180End-of-life160Methanol transport140Methanol production120Intermediate transportIntermediate processing100Feedstock transport80Feedstock production60CO₂ removal40Total emissions200PV WindHydroEUUSAe-methanol is produced by combining hydrogen and carbon dioxide over a catalyst. It is assumed that the CO2 is provided from an industrialsource “across the fence” and does not include any feedstock transportation.If the source carbon is climate neutral, then the end-of-life emissions are set to zero. This is for instance the case when the CO2 is generatedfrom biomass, captured from flue gas, or captured from air. The climate neutrality of CO2 is discussed in more detail on Page 55.When the hydrogen is produced from solar PV electricity, the lifecycle carbon footprint of e-methanol can be small, about 4.4 g CO2eq/MJ,which implies an emission reduction of 90% compared to natural gas based methanol.If instead, electricity is sourced from the grid, the associated emissions rise steeply. With an assumed EU grid performance of275 g CO2eq/kWh, the lifecycle carbon footprint becomes 100 g CO2eq/MJ, which means that the emissions would be higher than formethanol from natural gas.
Annex 1Approach
21ApproachMethanol producers provided company pathway specific dataCompany involvement The data for the carbon footprint assessments in this study is based on data received from industry.The Methanol Institute provided contact information at 47 companies. These were contacted and motivated to participate.Eventually, 12 respondents provided data on their installation. The companies involved represent the following feedstocks and pathways 4 based on natural gas (some with carbon capture and storage of exhaust CO2) 1 based on natural gas supplemented with captured CO2 1 based on hydrogen via electrolysis captured CO2 from industry 3 based on hydrogen via electrolysis biomass for CO2 1 based on biomass 1 based on biomass and municipal solid waste 1 based on an industrial waste streamAbout half of the companies involved are currently producing, the remaining companies are planning to produce within 2-5 years, and theirfacilities are in different stages of development. The level of detail of data received varied per respondent.We made limited judgement on the quality of the data received. Mass and energy balances were checked, and were found to b
Carbon footprint insights for methanol are scarce and often outdated. The Methanol Institute would like to increase the understanding of carbon footprint assessment within the industry, and at the same time obtain insights in the current status of methanol climate impacts. In this project, we calculated the carbon footprint of methanol for 12