Transcription
calculation methodologyfor the national Footprintaccounts, 2010 EditIon13 October 2010RGlobal Footprint Network: research, SCIENCE, & TECHNOLOGY Department
Calculation Methodology for the National Footprint Accounts, 2010EditionAuthors:Brad EwingAnders ReedAlessandro GalliJustin KitzesMathis WackernagelSuggested Citation:Ewing B., A. Reed, A. Galli, J. Kitzes, and M. Wackernagel. 2010. Calculation Methodology forthe National Footprint Accounts, 2010 Edition. Oakland: Global Footprint Network.This document builds on the foundational Ecological Footprint research and the previousmethodology papers for the National Footprint Accounts (Rees 1992, Wackernagel andRees, 1996; Wackernagel et al. 1997, Wackernagel et al. 1999a, b, Wackernagel et al. 2002,Monfreda et al. 2004, Wackernagel et al. 2005, Kitzes et al. 2007, Ewing et al. 2008).The designations employed and the presentation of materials in the Calculation Methodology forthe National Footprint Accounts, 2010 Edition do not imply the expression of any opinionwhatsoever on the part of Global Footprint Network or its partner organizations concerningthe legal status of any country, territory, city, or area or of its authorities, or concerning thedelimitation of its frontiers or boundaries.For further information, please contact:Global Footprint Network312 Clay Street, Suite 300Oakland, CA 94607-3510 USAPhone: 1.510.839.8879E-mail: data@footprintnetwork.orgWebsite: http://www.footprintnetwork.org Global Footprint Network 2010. All rights reserved.
ABSTRACTHuman demand on ecosystem services continues to increase, and there are indications that this demand isoutpacing the regenerative and absorptive capacity of the biosphere. For this reason the productivity ofnatural capital may increasingly become a limiting factor for the human endeavour. Therefore, metricstracking human demand on, and availability of, regenerative and waste absorptive capacity within thebiosphere are needed to track minimum sustainability conditions. Ecological Footprint analysis is anaccounting framework relevant to this research question; it measures human appropriation of ecosystemproducts and services in terms of the amount of bioproductive land and sea area needed to supply theseproducts and services. The area of land or sea available to serve a particular use is called biologicalcapacity (biocapacity), and represents the biosphere’s ability to meet human demand for materialconsumption and waste disposal. Ecological Footprint and biocapacity calculation covers six land usetypes: cropland, grazing land, fishing ground, forest land, built-up land, and the uptake land toaccommodate the carbon Footprint. For each land use type, the demand for ecological products andservices is divided by the respective yield to arrive at the Footprint of each land use type. EcologicalFootprint and biocapacity are scaled with yield factors and equivalence factors to convert this physicalland demanded to world average biologically productive land, usually expressed in global hectares (gha).This allows for comparisons between various land use types with differing productivities. The NationalFootprint Accounts calculate the Ecological Footprint and biocapacity for more than 200 countries andthe world. According to the 2010 Edition of the National Footprint Accounts, humanity demanded theresources and services of 1.51 planets in 2007; such demand has increased 2.5 times since 1961. Thissituation, in which total demand for ecological goods and services exceeds the available supply for a givenlocation, is known as overshoot. On the global scale, overshoot indicates that stocks of ecological capitalmay be depleting and/or that waste is accumulating.INTRODUCTIONHumanity relies on ecosystem products and services including resources, waste absorptive capacity, andspace to host urban infrastructure. Environmental changes such as deforestation, collapsing fisheries, andcarbon dioxide (CO2) accumulation in the atmosphere indicate that human demand may well haveexceeded the regenerative and absorptive capacity of the biosphere. Careful management of humaninteraction with the biosphere is essential to ensure future prosperity and reliable metrics are thus neededfor tracking the regenerative and waste absorptive capacity of the biosphere; assessing current ecologicalsupply and demand as well as historical trends provides a basis for setting goals, identifying options foraction, and tracking progress toward stated goals. The National Footprint Accounts aim to provide such ametric in a way that may be applied consistently across countries as well as over time.In 1997, Mathis Wackernagel and his colleagues at the Universidad Anáhuac de Xalapa started the firstsystematic attempt to calculate the Ecological Footprint and biocapacity of nations (Wackernagel et al.1997). Building on these assessments, Global Footprint Network initiated its National FootprintAccounts in 2003, with the most recent Edition issued in 2010.The National Footprint Accounts quantify annual supply of and demand for ecosystem products andservices in a static, descriptive accounting framework. It provides the advantage of monitoring in acombined way the impacts of anthropogenic pressures that are more typically evaluated independently(climate change, fisheries collapse, land degradation, land use change, food consumption, etc.). However,as with most aggregate indicators, it has the drawback of implying a greater degree of additivity andinterchangeability between the included land use types than is probably realistic.The demand that populations and activities place on the biosphere in a given year - with prevailingtechnology and resource management of that year – is the Ecological Footprint. The supply created bythe biosphere, namely biological capacity (biocapacity), is a measure of the amount of biologicallyproductive land and sea area available to provide the ecosystem services that humanity consumes – ourecological budget (Wackernagel et al., 2002).-1-
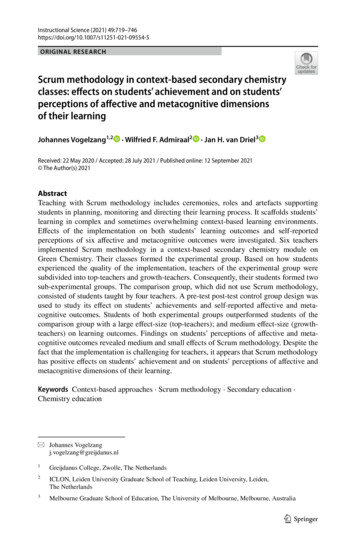
The 2010 Edition of the National Footprint Accounts calculate the Ecological Footprint and biocapacityof more than 200 countries and territories, as well as global totals, from 1961 to 2007 (Global FootprintNetwork 2010). The intent of the National Footprint Accounts is to provide scientifically robust andtransparent calculations allowing for comparisons of countries’ demands on global regenerative andabsorptive capacity.The calculations in the National Footprint Accounts are based primarily on international data setspublished by the Food and Agriculture Organization of the United Nations (FAOSTAT, 2010), the UNStatistics Division (UN Commodity Trade Statistics Database – UN Comtrade 2010), and theInternational Energy Agency (IEA 2010). Other data sources include studies in peer-reviewed sciencejournals and thematic collections—a complete list of source data sets is included in the EcologicalFootprint Atlas 2010 (Ewing et al. 2010).Current NFA Computational ArchitectureData Sources FAO, COMTRADE, IEA, BP, etc.Raw Data(.csv)Raw datauploadedinto tablesPre-ProcessingAnd Formatting(Excel)Data CleaningDeal with specifics of countriesand datasets (e.g. Belgiumand Luxembourg areaggregated in some datasets,or in some years)MySQL DatabaseHolds raw data aswell as resultsExcelWorkbooksIntermediatecalculationsNFA Equationsand CalculationEngine(Excel)Custom built softwaremanages calculation flowResults for analysis anddisseminationFigure 1 Outline of NFA 2010 implementation.The above illustration represents the various information processing steps performed in calculating theNational Footprint Accounts. Most raw data is obtained in CSV (comma separated value) or similar flattext file format. Some data arrangement and supporting calculations are performed using Microsoft Excel,after which raw data and intermediate results are stored either in a MySQL database, or in an Excelworkbook. Further data pre-processing is then performed by excecuting scripts within the databaseenvironment. The NFA calculations themselves are maintained in an Excel workbook, which referencesthe supporting workbook. A custom built software application manages the importation of data from thedatabase into the NFA workbook, and writes NFA results back to a table in the database. Theimplementation of the National Footprint Accounts is described in detail in the Guidebook to the NationalFootprint Accounts 2010 (Kitzes et al. 2010). The Accounts are maintained and updated by GlobalFootprint Network with the support of approximately 100 Partner Organizations.This paper describes the methodology for calculating the Ecological Footprint and biocapacity utilized inthe 2010 Edition of the National Footprint Accounts and provides researchers and practitioners withinformation to deepen their understanding of the calculation methodology. This research builds on the-2-
foundational Ecological Footprint works and the previous methodology papers for the NationalFootprint Accounts (Rees 1992, Wackernagel and Rees, 1996; Wackernagel et al. 1997, Wackernagel et al.1999a, b, Wackernagel et al. 2002, Monfreda et al. 2004, Wackernagel et al. 2005, Kitzes et al. 2007, Ewinget al. 2008).FUNDAMENTAL ASSUMPTIONS OF ECOLOGICALFOOTPRINT ACCOUNTINGEcological Footprint accounting is based on six fundamental assumptions (adapted from Wackernagel etal. 2002): The majority of the resources people consume and the wastes they generate can be quantifiedand tracked.An important subset of these resource and waste flows can be measured in terms of thebiologically productive area necessary to maintain flows. Resource and waste flows that cannot bemeasured are excluded from the assessment, leading to a systematic underestimate of humanity’strue Ecological Footprint.By weighting each area in proportion to its bioproductivity, different types of areas can beconverted into the common unit of global hectares, hectares with world average bioproductivity.Because a single global hectare represents a single use, and each global hectare in any given yearrepresents the same amount of bioproductivity, they can be added up to obtain an aggregateindicator of Ecological Footprint or biocapacity.Human demand, expressed as the Ecological Footprint, can be directly compared to nature’ssupply, biocapacity, when both are expressed in global hectares.Area demanded can exceed area supplied if demand on an ecosystem exceeds that ecosystemsregenerative capacity.FOOTPRINT AND BIOCAPACITY CALCULATIONSThe Ecological Footprint measures appropriated biocapacity, expressed in global average bioproductivehectares, across five distinct land use types, in addition to one category of indirect demand for biocapacityin the form of absorptive capacity for carbon dioxide emissions. The Ecological Footprint of production,EFP, represents primary demand for biocapacity and is calculated asEFP P YF EQFYN(Equation 1)where P is the amount of a product harvested or carbon dioxide emitted, YN is the national average yieldfor P (or its carbon uptake capacity), and YF and EQF are the yield factor and equivalence factor,respectively, for the land use type in question. Yield factors capture the difference between local andworld average productivity for usable products within a given land use type. They are calculated as theratio of national average to world average yields and thus vary by country, land use type, and year withinthe National Footprint Accounts. Equivalence factors translate the area of a specific land use typeavailable or demanded into units of world average biologically productive area. Thus, it varies by land usetype and year. Equivalence factors are calculated as the ratio of the maximum potential ecologicalproductivity of world average land of a specific land use type (e.g. cropland) and the average productivityof all biologically productive lands on Earth.All manufacturing processes rely to some degree on the use of biocapacity, to provide material inputs andremove wastes at various points in the production chain. Thus all products carry with them an embodiedFootprint and international trade flows can be seen as flows of embodied demand for biocapacity.-3-
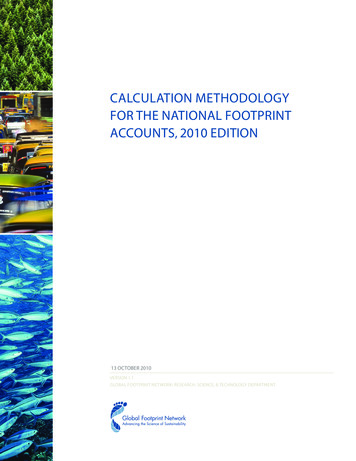
In order to keep track of both the direct and indirect biocapacity needed to support people’sconsumption patterns, the Ecological Footprint methodology uses a consumer-based approach; for eachland use type, the Ecological Footprint of consumption (EFC) is thus calculated asEFC EFP EFI EFE(Equation 2)where EFP is the Ecological Footprint of production and EFI and EFE are the Footprints embodied inimported and exported commodity flows, respectively. The National Footprint Accounts calculate theFootprint of apparent consumption, as data on stock changes for various commodities are generally notavailable. One of the advantages of calculating Ecological Footprints at the national level is that this is thelevel of aggregation at which detailed and consistent production and trade data are most readily available.Such information is essential in properly allocating the Footprints of traded goods to their finalconsumers.Figure 2 Schematic of Direct and Indirect Demand for Domestic and Global Biocapacity.Derived ProductsEcological Footprint assessments aim to measure demand for biocapacity by final demand, but theEcological Footprint is tallied at the point of primary harvest or carbon emission. Thus, tracking theembodied Ecological Footprint in derived products is central to the task of assigning the EcologicalFootprint of production to the end uses it serves.Primary and derived goods are related by product specific extraction rates. The extraction rate for aderived product, EXTRD, is used to calculate its effective yield as follows:YD YP EXTR D(Equation 3)where YP and YD are the yield for the primary product, and the effective yield for the derived product,respectively.Often EXTRD is simply the mass ratio of derived product to primary input required. This ratio is knownas the technical conversion factor (FAO, 2000a) for the derived product, denoted TCFD below. There area few cases where multiple derived products are created simultaneously from the same primary product.For example, soybean oil and soybean cake are both extracted simultaneously from the same primaryproduct, in this case soybean. In this situation, summing the primary product equivalents of the derivedproducts would lead to double counting. To resolve this problem, the Ecological Footprint of the primaryproduct must be shared between the simultaneously derived goods. The generalized formula for theextraction rate for a derived good D is-4-
EXTR D TCFDFAFD(Equation 4)where FAFD is the Footprint allocation factor. This allocates the Footprint of a primary product betweensimultaneously derived goods according to the TCF-weighted prices. The prices of derived goodsrepresent their relative contributions to the incentive for the harvest of the primary product. The equationfor the Footprint allocation factor of a derived product isFAFD TCFD VD TCFi Vi(Equation 5)where Vi is the market price of each simultaneous derived product. For a production chain with only onederived product, then, FAFD is 1 and the extraction rate is equal to the technical conversion factor.A country’s biocapacity BC for any land use type is calculated as follows:BC A YF EQF(Equation 6)where A is the area available for a given land use type and YF and EQF are the yield factor andequivalence factor, respectively, for the country, year, and land use type in question.NORMALIZING BIOPRODUCTIVE AREAS – FROMHECTARES TO GLOBAL HECTARESAverage bioproductivity differs between various land use types, as well as between countries for any givenland use type. For comparability across countries and land use types, Ecological Footprint and biocapacityare usually expressed in units of world-average bioproductive area. Expressing Footprints in worldaverage hectares also facilitates tracking the embodied bioproductivity in international trade flows, as ghameasure the ecological productivity required to maintain a given flow. Global hectares provide moreinformation than simply weight - which does not capture the extent of land and sea area used - orphysical area - which does not capture how much ecological production is associated with that land. Yieldfactors and equivalence factors are the two coefficients needed to express results in terms of globalhectares (Monfreda et al., 2004; Galli et al., 2007), thus providing comparability between variouscountries’ Ecological Footprint as well as biocapacity values.Yield FactorsYield factors account for countries’ differing levels of productivity for particular land use types. 1 Yieldfactors are country-specific and vary by land use type and year. They may reflect natural factors such asdifferences in precipitation or soil quality, as well as anthropogenic induced differences such asmanagement practices.The yield factor is the ratio of national average to world average yields. It is calculated in terms of theannual availability of usable products. For any land use type L, a country’s yield factor YFL, is given by1For example, the average hectare of pasture in New Zealand produces more grass than a world average hectare ofpasture land. Thus, in terms of productivity, one hectare of grassland in New Zealand is equivalent to more thanone world average grazing land hectare; it is potentially capable of supporting more meat production. Table 1 showsthe yield factors calculated for several countries in the 2010 Edition of Global Footprint Network’s NationalFootprint Accounts.-5-
YFL A Ai Ui UW,i(Equation 7)N,iwhere U is the set of all usable primary products that a given land use type yields, and AW,i and AN,i arethe areas necessary to furnish that country’s annually available amount of product i at world and nationalyields, respectively. These areas are calculated asA N,i PiPand A W,i iYNYW(Equation 8)where Pi is the total national annual growth of product i and YN and YW are national and world yields,respectively. Thus AN,i is always the area that produces i within a given country, while AW,i gives theequivalent area of world-average land yielding i.With the exception of cropland, all other land use types included in the National Footprint Accountsprovide only a single primary product, such as wood from forest land or grass from grazing land. Forthese land use types, the equation for the yield factor simplifies toYFL YNYW(Equation 9)Due to the difficulty of assigning a yield to built-up land, the yield factor for this land use type is assumedto be the same as that for cropland (in other words urban areas are assumed to be built on or nearproductive agricultural lands). For lack of detailed global datasets, areas inundated by hydroelectricreservoirs are presumed to have previously had world average productivity. The yield factor for carbonuptake land is assumed to be the same as that for forest land, due to limited data availability regarding thecarbon uptake of other land use types. All inland waters are assigned yield factors of one, due to the lackof a comprehensive global dataset on freshwater ecosystem productivities.Table 1: Sample Yield Factors for Selected Countries, 2007.Equivalence FactorsIn order to combine the Ecological Footprints or biocapacities of different land use types, a secondcoefficient is necessary. Equivalence factors convert the areas of different land use types, at theirrespective world average productivities, into their equivalent areas at global average bioproductivity acrossall land use types. Equivalence factors vary by land use type as well as by year.The rationale behind Equivalence factors’ calculation is to weight different land areas in terms of theircapacity to produce resources useful for humans. The weighting criterion is therefore not just the quantityof biomass produced, but also the quality of such biomass, meaning how valuable this biomass is for-6-
humans. Net Primary Production (NPP) values have been suggested for use in scaling land typeproductivity (Venetoulis and Talberth, 2008); however this would not allow incorporating the “quality”criterion in the scaling procedure. Usable NPP data could theoretically be used as weighting factors asthey would allow to track both the quantity and quality of biomass produced by land use types (Kitzes etal., 2009); however usable-NPP data availability and their use in calculating equivalence factors has notbeen tested yet by Global Footprint Network. As such, equivalence factors are currently calculated usingsuitability indexes from the Global Agro-Ecological Zones model combined with data on the actual areasof cropland, forest land, and grazing land area from FAOSTAT (FAO and IIASA Global AgroEcological Zones 2000 FAO ResourceSTAT Statistical Database 2007). The GAEZ model divides allland globally into five categories, based on calculated potential crop productivity. All land is assigned aquantitative suitability index from among the following: Very Suitable (VS) – 0.9Suitable (S) – 0.7Moderately Suitable (MS) – 0.5Marginally Suitable (mS) – 0.3Not Suitable (NS) – 0.1The calculation of the equivalence factors assumes that within each country the most suitable landavailable will be planted to cropland, after which the most suitable remaining land will be under forestland, and the least suitable land will be devoted to grazing land. The equivalence factors are calculated asthe ratio of the world average suitability index for a given land use type to the average suitability index forall land use types. Figure 3 shows a schematic of this calculation.Figure 3 Schematic Representation of Equivalence Factor Calculations. The total number of bioproductive landhectares is shown by the length of the horizontal axis. Vertical dashed lines divide this total land area intothe three terrestrial land use types for which equivalence factors are calculated (cropland, forest, andgrazing land). The length of each horizontal bar in the graph shows the total amount of land availablewith each suitability index. The vertical location of each bar reflects the suitability score for that suitabilityindex, between 10 and 90.For the same reasons detailed above, the equivalence factor for built-up land is set equal to that forcropland, while that of carbon uptake land is set equal to that of forest land. The equivalence factor for-7-
hydroelectric reservoir area is set equal to one, reflecting the assumption that hydroelectric reservoirsflood world average land. The equivalence factor for marine area is calculated such that a single globalhectare of pasture will produce an amount of calories of beef equal to the amount of calories of salmonthat can be produced by a single global hectare of marine area. The equivalence factor for inland water isset equal to the equivalence factor for marine area.Table 2 shows the equivalence factors for the land use types in the 2010 National Footprint Accounts,data year 2007.Table 2: Equivalence Factors, 2007. Cropland’s equivalence factor of 2.51 indicates that world-averagecropland productivity was more than double the average productivity for all land combined. This sameyear, grazing land had an equivalence factor of 0.46, showing that grazing land was, on average, 46 percent as productive as the world-average bioproductive hectare.LAND USE TYPES IN THE NATIONAL FOOTPRINTACCOUNTSThe Ecological Footprint represents demand for ecosystem products and services in terms of these landuse types, while biocapacity represents the productivity available to serve each use. In 2007, the area ofbiologically productive land and water on Earth was approximately 12 billion hectares. After multiplyingby the equivalence factors, the relative area of each land use type expressed in global hectares differs fromthe distribution in actual hectares as shown in Figure 4.Figure 4: Relative area of land use types worldwide in hectares and global hectares, 2007.The Accounts are specifically designed to yield conservative estimates of global overshoot as Footprintvalues are consistently underestimated while actual rather than sustainable biocapacity values are used.For instance, human demand, as reported by the Ecological Footprint, is underestimated because of theexclusion of freshwater consumption, soil erosion, GHGs emissions other than CO2 as well as impactsfor which no regenerative capacity exists (e.g. pollution in terms of waste generation, toxicity,eutrophication, etc.). In turn, biosphere’s supply is overestimated as both the land degradation and thelong term sustainability of resource extraction is not taken into account.-8-
CroplandCropland consists of the area required to grow all crop products, including livestock feeds, fish meals, oilcrops and rubber. It is the most bioproductive of the land use types included in the National FootprintAccounts. In other words the number of global hectares of cropland is large compared to the number ofphysical hectares of cropland in the world, as shown in Figure 4.Worldwide in 2007 there were 1.55 billion hectares designated as cropland (FAO ResourceSTATStatistical Database 2007). The National Footprint Accounts calculate the Footprint of croplandaccording to the production quantities of 164 different crop categories. The Footprint of each crop typeis calculated as the area of cropland that would be required to produce the harvested quantity at worldaverage yields.Cropland biocapacity represents the combined productivity of all land devoted to growing crops, whichthe cropland Footprint cannot exceed. As an actively managed land use type, cropland has yields ofharvest equal to yields of growth by definition and thus it is not possible for the Footprint of productionof this land use type to exceed biocapacity within any given area (Kitzes et al., 2009b). The eventualavailability of data on present and historical sustainable crop yields would allow improving the croplandfootprint calculation and tracking crop overexploitation.Grazing LandThe grazing land Footprint measures the area of grassland used in addition to crop feeds to supportlivestock. Grazing land comprises all grasslands used to provide feed for animals, including cultivatedpastures as well as wild grasslands and prairies, In 2007, there were 3.38 billion hectares of landworldwide classified as grazing land (FAO ResourceSTAT Statistical Database 2007). The grazing landFootprint is calculated following Equation 1, where yield represents average above-ground NPP forgrassland. The total demand for pasture grass, PGR, is the amount of biomass required by livestock aftercropped feeds are accounted for, following the formulaPGR TFR FMkt FCrop FRes(Equation 10)where TFR is the calculated total feed requirement, and FMkt, FCrop and FRes are the amounts of feedavailable from general marketed crops, crops grown specifically for fodder, and crop residues,respectively.Since the yield of grazing land represents the amount of above-ground primary production available in ayear, and there are no significant prior stocks to draw down, overshoot is not physically possible overextended periods of time for this land use type. For this reason, a country’s grazing land Footprint ofproduction is prevented from exceeding its biocapacity in the National Footprint Accounts.The grazing land calculation is the most complex in the National Footprint Accounts and significantimprovements have taken place over the past seven years; including improvements to the total feedrequirement, inclusion of fish and animal products used as livestock feed, and inclusion of livestock foodaid (Ewing et al. 2010; see also the appendix to this paper).Fishing GroundsThe fishing grounds Footprint is calculated based on the annual primary production required to sustain aharvested aquatic species. This primary production requirement, denoted PPR, is the mass ratio ofharvested fish to annual primary production needed to sustain that species, based on its average trophiclevel. Equation 11 provides the formula used to calculate PPR. It is based on the work of Pauly andChristensen (1995). 1 PPR CC DR TE (TL 1)(Equation 11)-9-
where CC is the carbon content of wet-weight fish biomass, DR is the discard rate for bycatch, TE is thetransfer efficiency of biomass between trophic levels, and TL is the trophic level of the fish species inquestion.In the National Footprint Accounts, DR is assigned the global average value of 1.27 for all fish species,meaning that for every tonne of fish harvested, 0.27 tonnes of bycatch are also harvested (Pauly andChristensen 1995). This bycatch rate is applied as a constant coefficient in the PPR equation, embodyingthe assumption that the trophic level of the bycatch is the same as that of the primary catch species.These approximations are employed for lack of higher resolution data on bycatch. TE is assumed to be0.1 for all fish, meaning that 10% of biomass is transferred between successive trophic levels (Pauly andChristensen 1995).The estimate of annually available primary production used to calculate marine yields is based onestimates of the sustainable annual harvests of 19 different aquatic species groups (Gulland 1971). Thesequantities are converted to a primary production equivalents using Eq 11 and the sum of these is taken tobe the total primary production requirement which global fisheries may sustainably harvest. Thus the totalsustainably harvestable primary production requirement, PPS, is calculated asPPS Q S,i PPR i (Equation 12)where QS,i is the estimated sustainable catch for species group i, and PPRi is the PPR value correspondingto the average trophic level of species group i. This total harvestable primary production requirement isallocated across the continental shelf areas of the world to produce biocapacity estimates. Thus the worldaverage marine yield
The 2010 Edition of the National Footprint Accounts calculate the Ecological Footprint and biocapacity of more than 200 countries and territories, as well as global totals, from 1961 to 2007 (Global Footprint Network 2010). The intent of the National Footprint Accounts is to provide scientifically robust and