Transcription
DeltaV Distributed Control SystemWhite PaperAugust 2016DeltaV Operate ThemesThis document provides background on the use of colors, shapes and pattern recognition approaches included in DeltaV OperateTheme displays using the FRSModule Theme dynamos.
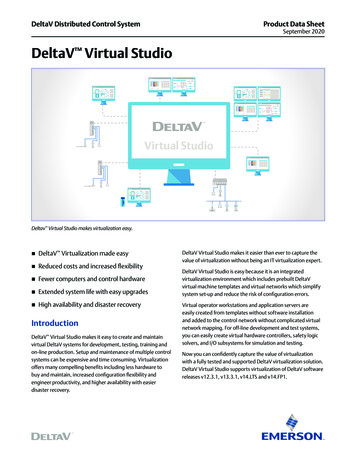
DeltaV Operate ThemesExample original display.August 2016Display with DeltaV Operate Silver Theme.IntroductionDeveloping a strategy for your operator displays involves a lot more than defining a picture type and window size. A recent reportby the Chemical Manufacturers’ Association on the Causes of Incidents attributed 26% of the incidents to Operator Error. Someindividual facilities have informally stated that they attribute a much higher percentage – even up to 66% of incidents on OperatorError. Regardless of the actual percentage, there is an increasing awareness of the role that operators have in the incident-freeoperation of a plant.There is a wide range of university led research on human capabilities that is very relevant to operations. This includes what attractsvisual attention (what do people notice, or not notice), impact of different colors and shapes on visual perception (the ability toquickly find or notice an important object amongst others) and the use of patterns in displays to improve the speed with which aperson can scan a large amount of information. Many of these discoveries are creating a better understanding of how we recognizeand process information and can be applied to improve plant operation.Human Centered Design is the application of research for specific users and tasks, as It is not always clear which general researchresults apply to a particular user, and which do not. The Center for Operator Performance (http://www.operatorperformance.org/) isan industry/university consortium that performs operations specific research, evaluating and measuring the impact on operations.There have also been several process control specific publications that describe many good practices and practical gudelines fordisplay design. These include: EEMUA 201 - Process Plant Control Desks Utilising Human-Computer Interfaces - A Guide to Design, Operational and HumanInterface Issues – Edition 2 ASM Consortium Guidelines – Effective Operator Display Design – 2008 High Performance Operator Graphics - 2008This paper presents display concepts based on this current research and publications for operators. However, new discoveries, andquestions, are still being uncovered. So while this paper presents Human Centered Design display concepts that apply this currentresearch for operators, this is just a step towards creating an operating environment truly optimized for operators –as human beings.It is also important to note that there is not ‘one answer’ to the creation of good operator displays. Deciding what display colors,shapes and styles work well together is more of an artistic decision than a scientific one. In other words, there is no mathematicalequation that you can use to select colors that are effective and ‘look good’ together. The same RGB color can be look differently ondifferent types of monitors, different room lighting, etc.www.emersonprocess.com/deltav2
DeltaV Operate ThemesAugust 2016DeltaV Operate Themes were developed to improve operator visual attention and recognition of important information in operatordisplays, based on current DeltaV monitors and office lighting. Colors, shapes and patterns were created with the help of agraphics artist.DeltaV Operate includes new default global color tables, color sets and dynamos that are coordinated into DeltaV Themes.GeneralKey to picture design is deciding what information should be shown together and how best to present that information to theoperator so that the relative importance of the information is clear.General human factors literature recommends careful use of color coding. Color coding is the practice of using a color to indicatespecific information. For example a red DeltaV alarm is by default a critical alarm. With color coding, a single color to indicate asingle piece of information. This means that red should not also be used both to indicate a critical alarm and to indicate a pump isoff. Similarly if yellow is an alarm color, it should not be used as a pipe or PV color.In addition, the use of color coding should be kept to around 7 colors. While you may find the need to exceed the recommendationof 7 colors, you should strive to limit the excessive use of color coding. If you have displays with a large amount of color coding, ordisplays with unique color coding, it may be helpful to create a color key and add it to the operator graphics where the colors areused. That way, the operator has a quick reference for each color. You can change the default colors used in the DeltaV standardfaceplates by changing the color set used in the Named Colors table.As more items are color coded or when the same color is used to represent multiple process conditions, it becomes more difficultfor operators to visually scan for information and to remember what the different colors mean.While it is recommended that the coded colors (where the color is significant) should be limited, additional colors can be used inyour graphic. For example, you might want to make information more visually distinctive or pictures more appealing through theuse of colors. These colors should be soft (non-saturated) and blend with the display background and static tank colors such thatthey do not visually distract the operator. These additional colors do not count towards the ideal 7 coded colors. Using the DeltaVOperate Themed color sets assist in keeping the colors on the screen in the same color palette.The first step in picture design should be to determine the colors you will deploy throughout your pictures. Alarm colors aretypically the most important colors to define; and therefore, drive your other color selections. The default DeltaV alarm colorsare red, yellow and purple. You can change the default alarm colors by changing the colors in the Alarm Color Table. The colorsselected as alarm colors should only be used for alarms.Alarm colors are defaulted to bright, saturated colors because these colors draw attention. The use of these saturated colors, as wellcyan, bright blue, and bright green, should be limited to items requiring operator attention. For example, a pipe that should notbe empty or a relief valve that is open can be shown in bright blue to make the unusual condition more obvious to the operator. Becareful to minimize your use of saturated colors on a display so that the items that are most important visually stand out.These saturated alarm colors are also classified as hot colors. To create a display that allows alarms to be distinctive, less saturatedcool colors (for example, grays, blues, and greens) should be used.Any status indication shown in a picture should also be distinctive, although typically less important than alarms. DeltaV OperateThemed color sets use a single, saturated color to indicate status.Selection of the picture background color is your next step. Select the background color so that the alarm and status colors aredistinctive. With DeltaV Operate Themed color sets, four different background selections are provided to pick from.Text and numbers must be distinctive on your selected background for optimum readability in the operator’s environment. If youselect a grey background color, text on that background should be a very dark grey to be readable. The section Calculating ColorContrast for Readability provides a calculation we found useful to determine when there is enough contrast between colors to beeasy to read.www.emersonprocess.com/deltav3
DeltaV Operate ThemesAugust 2016The tanks, pipes, and so on, on your picture provide a focal point for operators and help operators quickly recognize and verify thatthey are on the correct picture. Take care to make these items distinctive but not distracting.The colors used, or color theme used, along with what is animated (that is, changes color, visibility and movement) can beeffectively used to draw the operators’ attention.Theme Dynamo ColorsIt is important to define the relative importance of the information shown to the operator. This can vary from plant to plant – or –even process to process and affects the color selections used.The colors used in the DeltaV Operate Themes were selected based on the following relative importance (e.g. impact in attractingoperator attention):1. Alarms2. Abnormal Status Abnormal equipment states - such as when a relief valve is open. Abnormal pipe process color(s) – shows something is/is not in the pipe.3. Process values/information ON/OFF equipment states Process values - Easily readable Some Pipe process color(s) – Option to show what is in the pipe, whether pipe is empty4. Display information Tag name / value label color Large/background equipment color and label color – want to visually ground the user Pipe fixed color - just shows where pipes are in the process, optionally different typesUsing the same themed color set for all objects on the picture, as well as for the picture background color assures you that the colorswill work well together without one color obscuring another.Note: Theme pipe colors were defined for use with line width of 1. For pipes that are thicker, less distinct colors may be needed,unless there is a particular reason to draw attention to that pipe.www.emersonprocess.com/deltav4
DeltaV Operate ThemesAugust 2016Theme Color SetsThe themed color sets are named with the word Theme and the base color for that set (for example, Shades of Tan Theme).Each themed color set contains the complimentary and contrasting colors defined for many possible values. Colors are used to drawattention to important items using contrasts and are used to create a focal point for operators. Colors are also used to keep thesupporting information subtle by using complimentary colors. Keeping the colors to one palette or tone helps to create a pleasingvisual; especially considering the operators must look at one display for many hours and if the display is discordant, then operatoreye strain and mental fatigue can result.Each themed color set has contrasting colors that can be used when animating objects. Since a contrasting color draws attentionto an object, it should be used only when an object is out of range or in alarm. Using a contrasting color too frequently (or fortoo frequent of a change) reduces the effect and will tend to be ignored over time. Using too many contrasting colors can makeremembering what the colors signify difficult.Item nameDescriptionShades of Silver Theme.ftbColors based on a silver display background (default display background color)Shades of Light Blue Theme.ftbColors based on a light blue display backgroundShades of Dark Blue Theme.ftbColors based on a dark blue display backgroundShades of Tan Theme.ftbColors based on a tan display backgroundShades of Dark Grey Theme.ftbColors based on a dark gray display backgroundDefault Dynamo Theme Colors (Silver Theme)Theme Colors Color TableGeneralPicture Background color(224, 226, 235) iFIX 15459040Dynamo background color(235, 236, 241)Display DynamoPV loop background color,light tan (223, 215, 204) iFIX color 13424607SP Work color,dark tan (205,194,182)PV AI/ALM background color,light grey (219, 219, 224)PV level background color,light blue (203, 217, 226)PV foreground dark blue( 60, 98, 145)Status Border outline for dynamos(0, 0, 198) blueAlarm 1 grey-blue(155, 173, 198)Alarm 2 dark grey-blue(123, 146, 173)OUT bargraph foreground blue green(20, 105, 106) iFIX 8284436OUT bargraph background color, light green(131, 180, 172) iFIX 12174233SP, PV, Number values on background(0, 0, 0) blackInformational text -Tag names, EU(14, 50, 96) iFIX 6304270Pipe and TankMain pipe color(107, 141, 175) 11505003www.emersonprocess.com/deltavMain Big Equipment Color,(178, 199, 213)5
DeltaV Operate ThemesAugust 2016Border EdgeColor TableModule select(157,79,0) pumpkinAlternate Colors (not in global color tables)Arrows and Display LinksOff display reference foreground color(206, 223, 239)Arrow 1grey-blue (107, 142, 173)Off display reference edge and arrow color(140,170,198)Arrow 2 (107, 195, 107)greyOther Demo ColorsDisplay Title color(203, 217, 226)Display Title outline(178, 199, 213)Big Equipment outline(25, 47, 61)Alternate Title outline(178, 199, 213) – main tank colorAlternate Title color(203, 212, 217) 14275787- matches levelAlternate main pipe colorgrey (106, 106, 106)Control Information Lineslight grey (198, 198, 198) iFIX 13027014Big EquipmentDark 3 (89, 129, 150)Big EquipmentDark 1 and Highlight color (139, 171, 192)Text on tanks (36, 60, 89 )(same as all informational text)Big EquipmentDark 2 (119, 151, 172)Light Blue Dynamo Theme ColorsTheme Colors Light Blue Color TableGeneralPicture Background color(222,227,239) iFIX 15721438Dynamo background color(227, 232, 242)Display DynamoPV loop background colorsteel blue (185, 198, 215)SP Work colorlight blue(145, 173, 213)PV AI/ALM background color(219, 219, 224)PV level background color(185, 198, 215)PV foreground colordark blue (43, 71, 106) iFIX color 6965035Status Border outline for dynamosblue (33, 33, 165)Alarm 1 alarm greyblue (155, 173, 198)Alarm 2 dark blue greyblue (123, 146, 173)OUT bargraph foregroundblue green (20, 105, 126)OUT bargraph background colorlight green (131, 180, 172)SP, PV, Number values on backgroundblack (0, 0, 0)Informational text -Tag names, EU(14, 50, 96) 6304270www.emersonprocess.com/deltav6
DeltaV Operate ThemesAugust 2016Pipe and TankMain pipe color(107, 141, 175) 11505003Main Big Equipment Color,(178, 199, 213)BorderEdgeColor Light Blue TableModule selectpumpkin (157,79,0)Equipment abnormalblue (0, 0, 255) 16711680Alternate Colors (not in global color tables)Arrows and Display LinksOff display reference foreground color(206, 223, 239)Arrow 1grey-blue (107, 142, 173)Off display reference edge and arrow color(139, 171, 192)Arrow 2grey (107, 195, 107)Other Demo ColorsDisplay Title color(203, 217, 226)Title outline(178, 199, 213)Big Equipment outline(25, 47, 61)Alternate main pipe colorgrey (106, 106, 106)Control Information Lineslight grey (198, 198, 198) iFIX 13027014Big EquipmentDark 3 (89, 129, 150)Big EquipmentDark 1 and Highlight (139, 171, 192)Text on tanks(36, 60, 89 ) (same as all informational text)Big EquipmentDark 2 (119, 151, 172)Dark Blue Dynamo Theme ColorsTheme Colors Dark Blue Color TableGeneralPicture background color(41,65, 99) iFIX 650474Dynamo background color(55, 78, 112)Slate Blue Display DynamoPV loop background colorblueish-grey (98,124,157)SP Work color(148, 182, 214)PV AI/ALM background colorblueish-grey (98,124,157)PV level background colorblueish-grey (98,124,157)PV foreground colorlight tan (223,215,204)Bad status outline for dynamoscyan (0, 202, 202)Alarm 1grey-blue (132,157,183)Alarm 2 lightergrey-blue (165,181,203)OUT bar graph foregroundblue green (48,160,167)OUT bar graph background colorlight green (153,202,187)www.emersonprocess.com/deltav7
DeltaV Operate ThemesSP, PV, Number values on backgroundreally light blue (222, 231 239)August 2016Informational text -Tag names, EU’slight blue (173, 211, 255)Pipe and TankMain pipe color(107, 141, 175) 11505003Main Big Equipment Color(123, 146, 173)BorderEdgeColor Dark Blue TableModule selectlight orange (255,213,174)Equipment abnormalcyan (0, 236, 236)Alternate Colors (not in global color tables)Arrows and Display LinksOff display reference foreground color(156, 174, 198)Arrow 1blue (107, 141, 175)Off display reference edge and arrow color(123, 146, 173)Arrow 2 (206, 219, 231)light blue iFix # 15195086Other Demo ColorsDisplay Title color(204, 214, 225)Title outline(123, 146, 173)Big Equipment outline(25, 47, 61)Text on tanks(41,65, 99)-same as backgroundControl Information Linesdark grey (106, 106, 106) iFIX 6974058Alternate main pipe colordark tan (160, 155, 139)Big Equipment, Dark 1 and Highlight color(156, 174, 198)Big EquipmentDark 3 (98, 124,157)Tan Dynamo Theme ColorsTheme Colors Light Tan TableGeneralDisplay Background(222,219,214) iFIXDynamo backgroundlight tan (228,224,218)Display DynamoPV background colorlight blue (191,198,208)SP Work color(222,231,235)PV AI/ALM background colorlight blue (191,198,208)PV level background colorlight blue ( 191,198,208)PV foreground colordark blue (41, 69, 106) iFIX color 6965035Status Border outline for dynamos blueblue (33, 33, 165)Alarm 1(155,173,198)Alarm 2(123,146,173)OUT bargraph foregroundblue green (20, 105, 126) iFIX color 8284436OUT bargraph background color,light green (135,182,174) iFIX colorwww.emersonprocess.com/deltav8
DeltaV Operate ThemesSP, PV, Number values on background(6,31,49) darkest greyAugust 2016Informational text -Tag names, EU’sdark blue (33,65,118)Pipe and TankMain pipe color(107, 141, 175) 11505003Main Big Equipment Colortan (206, 199, 189)BorderEdgeColor Tan TableAbnormal StatusModule selectcyan (3, 187, 207)Equipment abnormalblue (0, 0, 255)Alternate Colors (not in global color tables)Arrows and Display LinksOff display reference foreground color(214,211,206)Arrow 1grey-blue (107, 142, 173)Off display reference edge and arrow color(148,142,148)Arrow 2(148,142,148) greyOther Demo ColorsBig Equipment outline(25, 47, 61)Text on tanks(36, 60, 89 ) (same as all informational text)Alternate main pipe color(90, 145, 170)Alternate main pipe colorgreyish (148, 143,148)Control Information Lineslight grey (198, 198, 198) iFIX 13027014Big Equipment, Dark 1 and Highlight color(182, 171, 156)Dark Gray Dynamo Theme ColorsTheme Colors Dark Gray Color TableAlarm 1 bar foreground(109, 138, 167)PV background(48, 82, 122)Alarm 2 bar foreground(165, 181, 203)PV background AI/ALM(85, 108, 136)Data value(222, 231, 239)PV background level(85, 108, 136)Dynamo background(53, 53, 53)PV foreground(22, 37, 56)OUT background(32, 113, 117)SPWRK bar foreground(176, 158, 134)OUT foreground(140, 186, 181)Status border(0, 202, 202)Picture background(45, 45, 45)Tag EU(119, 151, 172)Pipe(107, 141, 175)Vessel(77, 82, 88)www.emersonprocess.com/deltav9
DeltaV Operate ThemesAugust 2016BORDEREDGECOLOR DARK GRAYModule select(45, 45, 45)Equipment abnormal(0, 202, 202)Discrete and Analog DevicesAll DeltaV Operate Themes use the same device global color tables.Equipment ON/OFF OPEN/CLOSE colors:Dynamic EquipmentEquipment (pump/valve) outline (117,132,155)Discrete/Analog On color (238,242,249) off-whiteDiscrete/Analog off color (180,185,200) silver-greyDiscrete device global color tables:DeviceControl Color GreyColor table for On/Off colors for Normally Closed/OffDeviceControl2 Color GreyColor table for On/Off colors for Normally Open/OnAlong with the ON/OFF colors, discrete devices can also have one of the positions highlighted as abnormal. The abnormal discreteposition is configured in the dynamo edit form. For example, a relief valve dynamo can be configured such that the OPEN position isabnormal. When the valve is open, the valve outline is wider and the color is changed to the ABNORMAL Color.thrDCEdgeColorSets the value to 1 if the current DC State is the abnormal statethrDCEdgeWidthSets the edge width when DC state is abnormalNamed ColorsAbnormal color defined in this tableThe analog valve dynamo indicates if the valve is open or closed, similar to a discrete valve. The percent that the valve must be opento indicate that it is open is user definable.GN AVLV OpenOUT value above which the analog valve will show as openPatterns Used in Theme DynamosThe theme dynamos provide a few different graphical approaches in data presentation to aid in operator pattern recognition. Eachincorporates spatial orientation and color usage to reduce the operators need to review the numeric data values and focus on theimportant information within the dynamo. Typical operator displays and dynamos rely on operators reading and comparing theprocess values. For example, operators are commonly shown the SP and PV values for loops. From these values, operators aretasked with determining whether the SP and PV are properly tracking, whether there is a deviation worth addressing and how closeto an alarm limit is the PV.Human factors research shows that reading requires users to focus on each value individually. Operators read the values andcalculate the difference in those values one at a time (that is, serially). While focusing on one value, the other values on the screenare ignored. Thus, with only numeric displays, operators must periodically focus on each value and determine whether actionis required.www.emersonprocess.com/deltav10
DeltaV Operate ThemesAugust 2016The combination and normalized bar graphs were inspired from Bullet Graphs, described in the publication Information DashboardDesign – The Effective Visual Communication of Data by Stephen Few.Spatial orientation is also a concept applied to these dynamos. Each dynamo is made up of individual elements. These elements areplaced in the same location across all the dynamos where used. For example, alarm indication is in the upper left corner for all of thedynamos and mode indication is always to the left of the status indication. Consistency of element location creates a fixed spatiallocation within the dynamo for this related information. This is important because when operators can rely on looking to the sameplace, the display is less confusing and they can more quickly scan a display to understand what tags are affected.Combination Bar GraphThe combination bar graph presents PID, AI or ALM information graphically, relative to the defined high and low scale defined in thedynamo. This allows operators to scan a display and understand their approximate values and position in range without needingto read the corresponding numerical values. The combination bar graph indicates the relative values of PV, SP, SP WRK, and alarmlimits (when the corresponding alarm is enabled), based on the defined range. By default, the range used is PV SCALE (OUT SCALEfor AI blocks). The SP and SP WRK indicators are hidden when the function block definition is the AI block.Optionally, a user-defined scale can be configured. The user-defined scale can be defined as values, such as low range 20 andhigh range 80 or can be defined by paths, such as LO LIM and HI LIM. When paths are configured for the range, the range willdynamically adjust in runtime based on the current value of those paths.Operators are provided indication that the dynamo is based on user-defined scales. When user-defined scales have been configuredfor the dynamo, it is indicated with perpendicular lines shown at the ends of the combination bar graph. Perpendicular lines areshown at both ends of the bar graph to indicate that a partial range is defined.Combination Bar Graph.The combination bar graph graphically shows the following key information: Comparison of PV and SP - Shape recognition is used to aid detection. When PV is equal to SP, the PV bar touches theperpendicular SP bar, forming a ‘T’. If the PV is above SP, a ’t’ is shown. Knowing these shapes allows the operator scan a displayand quickly know how PV and SP compare. Comparison of PV and SP, when operation is limited to a small portion of the full range - the user defined scaling can be definedsuch that even a small differences between PV and SP is very visible within the range defined. For example, a temperature bargraph may only show the range of 740 – 755, because this is the range the temperature is normally operated within. The fullPV SCALE may be 0 to 800.www.emersonprocess.com/deltav11
DeltaV Operate ThemesAugust 2016 Comparison of PV and SP to SP WRK - When SP WRK is different from SP, it is shown on the bar graph. This allows operators torecognize the situation where PV is not equal to SP because SP WRK is active and the currently displayed SP value is not beingused by the module. PV and SP relative range - Operators are shown PV and SP are at the appropriate place in range. By default, the full 0 – 100%PV Scale (OUT SCALE for AI) range is shown in the graph. For process values such as temperature or pH where operation isrequired within a small percentage of the overall range, the bar graph can be defined with a partial range. PV and SP value relative to alarm limits - HI, HIHI, LO and LOLO Alarm limits are shown on the bar graph. If the PV or SP is nearan alarm limit, the operator can determine this from the combination bar graph. The indication of these alarm locations isshown subtly (such as in grays), providing alarm limit information without being distracting or creating excessive visual clutter.PV – SP Deviation (comparison) Bar GraphThe deviation bar graph presents PID or ALM information graphically relative to the current SP. This allows operators to scan adisplay and determine which modules have significant deviations between PV and SP, without needing to read the correspondingnumerical values. The deviation bar graph compares the value of PV and the value of SP and displays the deviation. Theperpendicular line representing SP does not move and is always in the center of the bar graph. The greater the deviation, the morevisible the PV diamond becomes.The distance between PV and SP on a bar graph always represents the same amount of deviation from that SP, whether PV is aboveor below SP. Thus a 2% deviation between PV and SP places PV at the same location on the bar graph, whether PV is above, or belowSP. Since SP is fixed in the middle of the bar graph, it is the current SP value that defines the current range of PV shown in thebar graph.By default, the maximum configured bar graph range uses PV SCALE. In runtime, the bar graph always uses this maximum. Sincethe SP value is always in the middle of the graph, when SP is set at 50% of range, the PV diamond at the end of the bar would indicatethat PV was at 0 or 100% of PV SCALE. If SP is then set to 25% of PV SCALE, the PV diamond at the end of the bar graph wouldindicate that PV was at -25% or 75% of PV SCALE. Note that, in this case, PV would be limited to 0 and the diamond would neverreach the bottom of the bar graph range of -25%, because the PV value cannot be outside of the PV SCALE range.Optionally, you can have a user-defined maximum configured bar graph range. The user-defined percent of scale can be defined aseither a number or a path that resolves to percent . If the value is set to 10, it equates to /- 5% of EU range. So the maximum bargraph range would have zero scale at SP minus 5% of EU range and full scale on the bar graph is SP plus 5% of EU range for a total of10%. When using a path, limit the value to between 0 and 100. When a path is configured for the range, the range will dynamicallyadjust in runtime based on the current value of that path.PV-SP Deviation Bar Graph.www.emersonprocess.com/deltav12
DeltaV Operate ThemesAugust 2016The deviation bar graph graphically shows the following key information: Comparison of PV and SP - Shape recognition is used to aid detection of PV deviations. When PV equals SP, only theperpendicular SP line is visible. The greater the deviation, the more visible the PV diamond becomes, starting as an arrow andgrowing into the diamond shape. Knowing these shapes allows the operator to scan a display and quickly know how PV and SPcompare. Pattern recognition to detect the the significance of any PV deviations from SP is possible, when multiple deviation bar graphsare viewed together, since the SP indication is fixed. Comparison of PV and SP, when small deviations are important - the user-defined scaling can be defined such that even a smalldeviation between PV and SP is very visible and provide this information for any SP value. Operators are shown PV and SP at the appropriate place in range. By default, the full 0 – 100% PV Scale range is shown in thegraph. For process values such as temperature or pH where operation is required within a small ercentage of the overall range,the bar graph can be defined with a partial range. PV and SP value relative to alarm limits - HI, DV HI, LO and DV LO Alarm limits are shown on the bar graph. If the PV or SP isnear an alarm limit, the operator can determine this from the combination bar graph. The indication of these alarm locations isshown subtly (such as in grays), providing alarm limit information without being distracting or creating excessive visual clutter.Normalized Bar GraphThe normalized bar graph is a horizontal bar that presents PID, AI or ALM information graphically relative to defined normal rangesof PV SCALE (OUT SCALE for AI). This graph is useful when it is important whether values are in the defined normal range. Thenormalized bar graph divides PV SCALE (OUT SCALE for AI) into three sections. The three sections are always shown the same size,regardless of the percentage of the scale they represent. Thus, if several normalized bar graphs are stacked vertically, the normalsections line up, facilitating pattern recognition for value comparisons based on the defined normal ranges.By default, the low normal value is defined by the block LO LIM parameter and the high normal value is defined by the blockHI LIM parameter. Changing the alarm limit parameters adjusts the percentage of the scale in the three sections during run time.Optionally, user-defined parameters can be configured for the low and high normal values.The normalized bar graph divides PV SCALE (OUT SCALE for AI) into three sections as defined by the High and Low Normal Values.For example, if the full scale is defined as 0 to 100, with LO LIM equal to 10 and HI LIM equal to 70, the three sections would bedefined as 0 – 10, 10 – 70 and 70 – 100. PV and SP are positioned linearly within each section. Therefore, if PV was equal to 5, itwould be shown at the midpoint of the low normal value section. If PV changed to 11, it would be shown o
Alarm 1 grey-blue (155, 173, 198) Alarm 2 dark grey-blue (123, 146, 173) OUT bargraph foreground blue green (20, 105, 106) iFIX 8284436 OUT bargraph background color, light green (131, 180, 172) iFIX 12174233 SP, PV, Number values on background (0, 0, 0) black Informational text -Tag names, EU (14, 50, 96) iFIX 6304270 Pipe and Tank Main pipe color