Transcription
Site Survey ReportPowered by TamoGraphSurvey NameActive DemoSurveyorAndrew RedelLocationFloor 3DescriptionDate(s)Sample active surveyTuesday, October 11, 2011
Active Demo - Floor 4List of SurveysNameDescriptionSurvey 10/11/2011 4:02:04 PM2TamoGraph Site Survey
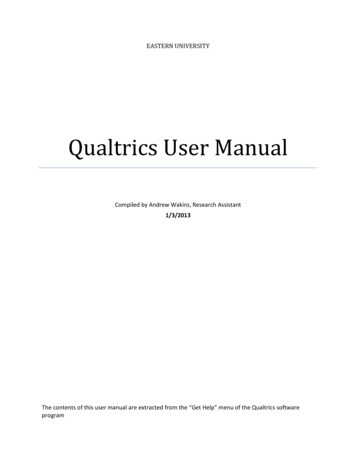
Active Demo - Floor 4Actual PHY RateThe physical layer (PHY) rate is the speed at which client devices communicate with the AP. Whenyou move a computer connected to the AP within the WLAN coverage area, the adapter propertiesdialog in Windows displays the varying connection speed, which may be as high as 450 or 300 Mbpswhen you are close to the AP or as low as 1 Mbps when you are 50 meters away from it. Thedisplayed speed is the actual PHY rate at which the client was connected to the AP during an activesurvey.3TamoGraph Site Survey
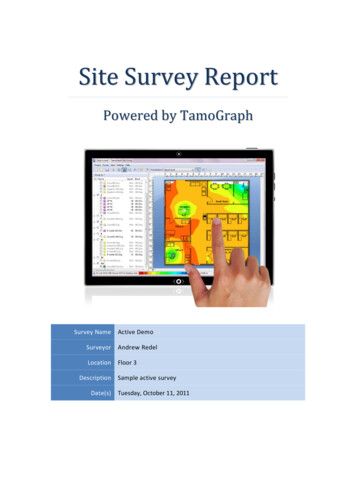
Active Demo - Floor 4TCP Upstream RateThis visualization shows the TCP upstream throughput measured in Megabits per second. This is theamount of useful information that is delivered per second to the application layer protocol from theclient to the server, i.e., upstream. This value does not include protocol overhead.4TamoGraph Site Survey
Active Demo - Floor 4TCP Downstream RateThis visualization shows the TCP downstream throughput measured in Megabits per second. This isthe amount of useful information that is delivered per second to the application layer protocol fromthe server to the client, i.e., downstream. This value does not include protocol overhead.5TamoGraph Site Survey
Active Demo - Floor 4UDP Upstream RateThis visualization shows the UDP upstream throughput measured in Megabits per second. This is theamount of useful information that is delivered per second to the application layer protocol from theclient to the server, i.e., upstream. This value does not include protocol overhead.6TamoGraph Site Survey
Active Demo - Floor 4UDP Downstream RateThis visualization shows the UDP downstream throughput measured in Megabits per second. This isthe amount of useful information that is delivered per second to the application layer protocol fromthe server to the client, i.e., downstream. This value does not include protocol overhead.7TamoGraph Site Survey
Active Demo - Floor 4UDP Upstream LossThis visualization shows the UDP loss that is calculated as the percentage of data that was lostduring transmission from the client to the server, i.e., upstream.8TamoGraph Site Survey
Active Demo - Floor 4UDP Downstream LossThis visualization shows the UDP loss that is calculated as the percentage of data that was lostduring transmission from the server to the client, i.e., downstream. In a WLAN, high UDPdownstream loss values are normal, because the server on the wired side can typically send farmore packets per second than the AP can transmit to the client.9TamoGraph Site Survey
Active Demo - Floor 4Round-trip TimeThis visualization shows the round-trip time (RTT) measured in milliseconds. RTT is the length oftime it takes for a data packet to be sent from the client to the server and back.10TamoGraph Site Survey
Active Demo - Floor 4Associated APThis visualization shows to which AP the client was associated during an active survey. This makes itpossible to analyze client roaming behavior.11TamoGraph Site Survey
Active Demo - Floor 4RequirementsThis visualization shows what requirements set by the user for active surveys are met. The zoneswhere the requirement is not met are marked with the corresponding legend color. If more than onerequirement is not met, only one color will be used.12TamoGraph Site Survey
9 TamoGraph Site Survey. Active Demo - Floor 4 Round-trip Time This visualization shows the round-trip time (RTT) measured in milliseconds. RTT is the length of time it takes for a data packet to besent from the client to the server and back. 10 TamoGraph Site Survey.