Transcription
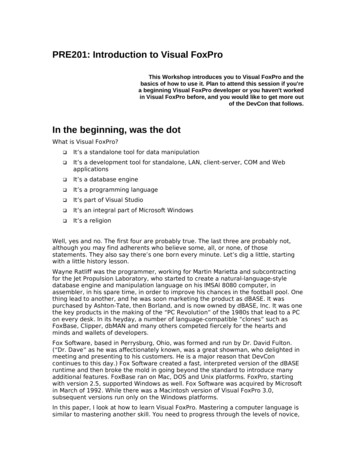
View metadata, citation and similar papers at core.ac.ukbrought to you byCOREprovided by CommonKnowledgePacific UniversityCommonKnowledgeSchool of Professional PsychologyTheses, Dissertations and Capstone Projects12-9-2011The Integrated Visual and Auditory ContinuousPerformance Test: Does the Comprehension ScaleDiscriminate ADHD?Heather TollanderPacific UniversityRecommended CitationTollander, Heather (2011). The Integrated Visual and Auditory Continuous Performance Test: Does the Comprehension ScaleDiscriminate ADHD? (Master's thesis, Pacific University). Retrieved from:http://commons.pacificu.edu/spp/419This Thesis is brought to you for free and open access by the Theses, Dissertations and Capstone Projects at CommonKnowledge. It has been acceptedfor inclusion in School of Professional Psychology by an authorized administrator of CommonKnowledge. For more information, please contactCommonKnowledge@pacificu.edu.
The Integrated Visual and Auditory Continuous Performance Test: Doesthe Comprehension Scale Discriminate ADHD?Abstract(See full text)Degree TypeThesisRightsTerms of use for work posted in CommonKnowledge.CommentsLibrary Use: LIHThis thesis is available at CommonKnowledge: http://commons.pacificu.edu/spp/419
Copyright and terms of useIf you have downloaded this document directly from the web or from CommonKnowledge, see the“Rights” section on the previous page for the terms of use.If you have received this document through an interlibrary loan/document delivery service, thefollowing terms of use apply:Copyright in this work is held by the author(s). You may download or print any portion of this documentfor personal use only, or for any use that is allowed by fair use (Title 17, §107 U.S.C.). Except for personalor fair use, you or your borrowing library may not reproduce, remix, republish, post, transmit, ordistribute this document, or any portion thereof, without the permission of the copyright owner. [Note:If this document is licensed under a Creative Commons license (see “Rights” on the previous page)which allows broader usage rights, your use is governed by the terms of that license.]Inquiries regarding further use of these materials should be addressed to: CommonKnowledge Rights,Pacific University Library, 2043 College Way, Forest Grove, OR 97116, (503) 352-7209. Email inquiriesmay be directed to:. copyright@pacificu.eduThis thesis is available at CommonKnowledge: http://commons.pacificu.edu/spp/419
Running Head: DOES THE IVA COMPREHENSION SCALE DISCRIMINATEADHD?The Integrated Visual and Auditory Continuous Performance Test: Does the ComprehensionScale Discriminate ADHD?A THESISSUBMITTED TO THE FACULTYOFSCHOOL OF PROFESSIONAL PSYCHOLOGYPACIFIC UNIVERSITYHILLSBORO, OREGONBYHEATHER TOLLANDER, B.A.IN PARTIAL FULFILLMENT OF THEREQUIREMENTS FOR THE DEGREEOFMASTER OF SCIENCE IN CLINICAL PSYCHOLOGYDECEMBER 9, 2011APPROVED:B J Scott, PsyD, Chair
DOES THE IVA COMPREHENSION SCALE DISCRIMINATE ADHD?2IntroductionAttention Deficit Hyperactivity Disorder (ADHD) is a developmental neuropsychologicaldisorder that usually first appears in early childhood, with symptoms that cause impairment inmultiple settings (American Psychiatric Association [DSM-IV-TR], 2000). The disorder hasthree subtypes: Predominantly Hyperactive/Impulsive Type, Predominantly Inattentive Type,and Combined Type. Individuals with the Predominantly Hyperactive Type exhibit excessivemotor activity, experience feelings of restlessness and have problems with impulse control.Individuals with the Predominantly Inattentive Type have problems with memory, organizationand sustaining attention to tasks and activities. Individuals with the Combined Type of ADHDexhibit symptoms of both the Hyperactive/Impulsive Type and the Inattentive Type of ADHD.Approximately three to seven percent of children in the United States meet DSM-IV-TRcriteria for ADHD (DSM-IV-TR, 2000). Up to 60% of these children continue to meet criteriainto adulthood, for an estimated adult prevalance rate of 4.4% (Kessler et al., 2006). BecauseADHD is neurological in origin, comprehensive assessment is crucial for making a differentialdiagnosis and determining which treatments may be most effective in reducing impairment(Frazier, Demaree, & Youngstrom, 2004; Pliszka, 2007; White, Hutchins, & Lubar, 2005;Educational Testing Service, 2011). This is because ADHD symptoms overlap with otherneurological conditions and psychiatric disorders, which typically require different treatmentinterventions. Furthermore, about 89 percent of adults with ADHD have, have had, or will havea comorbid psychiatric disorder at some time in their life (Adler, Spencer, Stien, & Newcorn,2008), and it is important to diagnose and treat these additional disorders as well.Current methods of assessing for ADHD include a clinical interview, current andretrospective self-report of symptoms, collateral report of symptoms from others in order toverify childhood onset and impairment in multiple settings (e.g., home and work, or school), and
DOES THE IVA COMPREHENSION SCALE DISCRIMINATE ADHD?3administration of a continuous performance test (CPT; Murphy, & Schachar, 2000). Othercognitive, achievement, and/or neuropsychological testing may also be provided based on thereferral question (Pliszka, 2007; Educational Testing Service, 2011). Symptom validity testingalso is recommended (Quinn, 2003). While the nature of the clinical interview and self and otherreport of symptoms are subjective, continuous performance tests (CPTs) offer a more objectivemeasure of symptoms to aid diagnosis (Frazier, Demaree, & Youngstrom,2004). CPTs are testsof attentional vigilance that require examinees to respond to various computer-generated stimuliover a period of many minutes. After controlling for effort, individuals who make a significantnumber of mistakes on CPTs are likely to have attention problems such as those found inindividuals with ADHD. Commonly used CPTs include Conner’s CPT, the Test of Variables ofAttention (TOVA) and the Integrated Visual and Auditory CPT (IVA). Note, both the originalversion of the IVA and the IVA Plus, which uses a new operating system, are referred to as IVAin this paper.The IVA was developed by Sanford and Turner (2004) “in part to measure the ability toinhibit response after a behavioral pattern of responding was established” (p.11). Theconstruction of this test was based on Barkley’s theory (1993b) that ADHD reflects a deficit inresponse inhibition. Furthermore, Sanford and Turner (2004) believed that a dual stimulus modelwould be more effective than one that requires attention to one infrequent stimulus (an “Xversion”) or one in which the examinee must respond to a stimulus (X) that follows anotherstimulus (A-X). To maximize errors in response inhibition, Sanford and Turner decided to makethe test stimuli as unpredictable as possible. They included both auditory and visual stimuli toincrease the test’s sensitivity in distinguishing between ADHD and non-ADHD populations.With respect to the overall construct of attention, the test creators used Sohlberg and Mateer’s
DOES THE IVA COMPREHENSION SCALE DISCRIMINATE ADHD?4theoretical model of attention (1987) which divides attention into five elements: FocusedAttention, Sustained Attention, Selective Attention, Alternating Attention, and DividedAttention. Based on this model, Sanford and Turner designed the IVA to simultaneously measureresponse control and attention processing in the five domains.The IVA manual states that the test was developed to be similar to the then widely usedConners’ CPT—2nd Edition (Conners’ CPT-II) in format and modality (Sanford & and Turner,2004). However, the response stimuli were different: The Connors’ CPT-II (and the Conners’CPT—3rd Edition now in use) uses the A-X format in only the visual modality, whereas the IVAuses A-X formatting for both visual and auditory stimuli. Furthermore, since it has more clinicalscales, the IVA gives more detailed score reports. Specifically, the Connors’ CPT-II gave scoresfor Vigilance, Impulsivity, and Erraticness by measuring reaction time, errors of commission,and errors of omission. The IVA gives Visual and Auditory Response Control Quotients (VRCQand ARCQ) and Visual and Auditory Attention Quotients (VAQ and AAQ) that are each basedon three subscales. The test data also include Attribute scores, and the Symptomatic scales whichalso have subscales. In addition, the IVA includes a Fine Motor Regulation Scale.Other than those done by the test developers, few studies have been conducted evaluatingthe psychometric properties of the IVA. The test developers claim the IVA has adequatereliability and validity (Maddux & Sime, 2007), however there have been few independent peerreviewed studies evaluating its psychometric properties. Three peer-reviewed studies were foundevaluating the clinical utility of the IVA (Corbett & Constantine, 2006; Quinn, 2003; Tinus,2003). Outside of those three studies, the only other widely available literature on this CPT is theIVA test manual, conference abstracts, and the Mental Measurements Yearbook Review. TheComprehension scale, a subscale of the Symptomatic scale is of particular interest in this study.
DOES THE IVA COMPREHENSION SCALE DISCRIMINATE ADHD?5The test developers stated that it is intended to “identify random responding by measuringidiopathic errors (Sanford & Turner, 2004, p. 10).” Furthermore, the test developers stated thatthe “Comprehension Scale is the single most sensitive subscale in discriminating ADHD” (p.10).However, there are no sources apart from the test manual to support this claim; no independentpeer-reviewed studies evaluating the psychometric properties of the Comprehension scale exist.Based on a review of the literature, there is a need for further evaluation of its psychometricproperties. This study evaluated whether or not there were significant differences between scoresfor an ADHD group and a non–ADHD clinical group. The sensitivity and specificity of theComprehension Scale were measured, as well as the ability of this scale to accurately categorizethose with ADHD compared to using the Verbal Response Control Quotient (VRCQ) and theAuditory Response Control Quotient (ARCQ) only. The goal of examining these psychometricproperties was to evaluate the scale’s ability to accurately detect ADHD within a clinicalpopulation as well as its ability to detect ADHD compared to using the ARCQ and the VRCQonly.Test development and constructionThe IVA manual (Sandford & Turner, 2004) indicates that test developers investigated500 test trials and identified seven types of errors. The types of response errors made were usedto develop each of the scales. Sanford and Turner found that the rates of these response errorswere higher for individuals with ADHD or other attention problems. Measurements of reactiontime as well as accuracy and variability under different conditions “gave rise” to 22 raw scalescores (p.26). The test developers did not clearly specify the different conditions used. Thescores then were conceptually grouped into the Response Control, Attention, Attribute andSymptomatic scales. Sanford and Turner did not elaborate on how test items were conceptually
DOES THE IVA COMPREHENSION SCALE DISCRIMINATE ADHD?6grouped. The test developers then standardized the quotient scores to make them analogous to IQtest scores with a mean of 100 and a standard deviation of 15.Normative sample populationThe test developers used a normative sample of 1,700 individuals. They divided thegroups by gender, then further grouped the participants by age in groups ranging from ages 6 to96, with groups including a wider age range of participants as age increased (Turner & Sanford,1995; g/ivaplus pro.htm). The testdevelopers attempted to have an equal number of males and females in each age group, withabout 30 test subjects per group. The normative data was primarily collected in Virginia, Texas,Michigan, California and Florida. According to the IVA website, the sample “included manydifferent ethnic groups.” However, data on ethnicity for the normative sample was not includedin the manual. Participants were excluded from the study if they “were in therapy, had a historyof LD, hyperactivity or attention problems, who were on any type of medication (other than birthcontrol unless 55 years of age), who had a history of neurological problems (e.g., dementia,stroke, or [traumatic brain injury; TBI]) and those who could not validly complete the test.” Inthe Seventeenth Mental Measurements Yearbook (2007), Maddux and Sime restated theavailable normative data and noted that, while the sample size for each age group is adequate, thelack of available statistics on ethnicity for the normative sample leaves the information about thesample incomplete.In a study presented at the annual Children and Adults with ADHD (CHADD)conference (1995a), Sandford and Turner reported that they found differences in normative dataamong the 5-7, 8-10, and 11-13 year old age groups. Specifically, reaction speed increasedgradually and linearly as the age of test subjects increased. Scores on Vigilance, Prudence,
DOES THE IVA COMPREHENSION SCALE DISCRIMINATE ADHD?7Consistency and Off Task Behaviors improved markedly between the age of 6 and 9. Scores onAuditory Prudence and Visual Vigilance showed the steepest increases. Overall theseimprovements tended to level off at the 11-13 year-old age group. Stamina remained stable forall age groups. Lastly, male participants tended to be faster, while female participants tended tobe more prudent. Neither the statistical methods used to conduct the statistical analysis nor theraw data for each group were specified in the available conference brief. The Comprehensionscale was not mentioned in this study.Validity of the IVASandford, Fine and Goldman (1995) presented their study of the diagnostic andconcurrent validity of the IVA at the American Psychological Association (APA) annualconvention. They found that the IVA’s overall sensitivity and specificity in differentiatingchildren diagnosed with ADHD from “normals” was 92% and 90%, respectively. They foundthat the test’s positive predictive power was 89% and negative predicative power was 93%.Compared to two other CPTs and two ADHD rating scales that were not specified in theconference brief, the IVA had the lowest rate of false negatives (7.7%) and a low rate of falsepositives (10%). The authors found the IVA had “excellent concurrent validity with the otherinstruments used (90%)” (p.1). The authors did not include sample size, demographicinformation, or criteria for inclusion in the ADHD and non-ADHD groups in the conferencebrief.The Seventeenth Mental Measurements Yearbook (2007) provided more information onthe original validity study. Maddux and Sime reported that 26 children diagnosed with ADHDwere in the ADHD group and 31 children were in the control group. The children rangedbetween the ages of 7 and 12. Concurrent validity was examined by comparing the percentage of
DOES THE IVA COMPREHENSION SCALE DISCRIMINATE ADHD?8subjects correctly and incorrectly identified as having ADHD by three different CPTs (includingthe IVA) with participants’ results on two ADHD rating scales. They did not specify which otherCPTs and ADHD rating scales were used in the study. The percentage of participants correctlyidentified by the instruments ranged between 90% and 100% for the different instruments. Asnoted previously, the IVA had the lowest percent of false negatives (7.7%). There was noinformation provided on validity of the Comprehension scale. While the initial validity studiesappear promising, additional studies using a larger, more diverse sample with a wider range ofage groups were recommended to provide a more accurate estimate of the test’s validity.Reliability of the IVASeckler, Burns, Montgomery and Sandford (1995) presented a poster on the test-retestreliability of the IVA at the annual convention of CHADD. Seventy individuals without a historyof neurological or current psychological, learning, attention or self-control problems participatedin the study. The participants ranged from 5 to 70 years of age. Sixty percent were male and fortypercent were female. No other information was provided about selection methods or sampledemographics. No individuals with ADHD were included in this study. Participants wereadministered the test one to four weeks apart. All of the IVA composite quotient scoresdemonstrated “moderate to very strong” test-retest correlations, with r 0.45 to 0.75. Analysis ofthe 22 raw scale scores revealed that 20 scales had significant test-retest correlations, with 18 ofthe 20 scales demonstrating “moderately strong to very strong correlations” (r 0.46-0.88).Overall, the authors found that individuals without ADHD did not show substantial practice orlearning effects. They concluded that changes in IVA scores can be reliably interpreted to reflectreal changes due to medication, treatment or environmental effects. However, further peerreviewed research is needed to support this conclusion.
DOES THE IVA COMPREHENSION SCALE DISCRIMINATE ADHD?9In The Mental Measurements Yearbook, Maddox and Sime (2007) critiqued this testretest reliability study and also condensed the information provided by the original study and inthe manual. Maddux and Sime noted that there is only one test-retest study available for the IVA.As noted above, that study used a small sample size and some participant demographic data werenot specified. The reviewers also pointed out that reliability estimates varied widely, withreliability for composite scale scores ranging from r .02 to .88. No specific information wasincluded on test-retest reliability of the Comprehension scale. They concluded that more studiesthat include an ADHD group, larger sample size and more complete demographic informationare needed for a more accurate estimate of the instrument’s test re-test reliability.ADHD and malingeringQuinn (2003) conducted a study comparing the sensitivity and specificity of the ADHDBehavior Checklist to the IVA for diagnosing ADHD in a college population. She hypothesizedthat the IVA would be more sensitive to simulated malingering than would the ADHD BehaviorChecklist, a self-report measure of hyperactive and inattentive symptoms. Furthermore, shehypothesized that malingerers’ scores would be more deviant than scores for both participantswith ADHD and the control group. Forty-four undergraduates recruited from psychology classeswere randomly assigned to either a control group (n 19) or a feigned malingerer group (n 23). Also, 16 students with ADHD diagnoses were recruited from the university’s Office forStudents with Disabilities. No information was collected regarding psychiatric disorders forparticipants. All participants completed both the ADHD rating scale and the IVA. Quinn used aone-way analysis of variance (ANOVA) with a Tukey HSD post hoc test to assess the ability ofIVA scales (including the Comprehension subscale) to distinguish between the 3 groups. TheIVA was found to have a sensitivity of .81 and a specificity of .91, while the sensitivity andspecificity of the ADHD Behavior Checklist was found to be .69 and .43, respectively. As
DOES THE IVA COMPREHENSION SCALE DISCRIMINATE ADHD?10predicted, the malingering group scored significantly lower on the IVA than did the ADHD orcontrol group. Quinn found no significant differences in scores between the ADHD andmalingering group on the ADHD Behavior Checklist. Quinn concluded that the IVA has greatersensitivity and specificity than the ADHD Behavior Checklist and is more sensitive tomalingering than is the ADHD Behavior Checklist. Quinn noted that using a larger sample sizeand including a community sample and an ADHD group with proportions of the ADHD subtypesmore representative of those found in the general population would enhance this study’sgeneralizability.Other CriticismsTinus (2003) conducted a study to determine the relationship between a self-reportmeasure and performance on the IVA in adults with ADHD or mild TBI (mTBI). Hehypothesized that there would be a different pattern of deficits on the IVA for these two groups.Specifically, individuals with mTBI were expected to report more impairment on the self-reportscale and to demonstrate a positive association between self-report symptoms and performanceon the IVA. Participants were 38 adults diagnosed with ADHD, 41 participants with a history ofmTBI, and a healthy control group comprised of 41 individuals. The ADHD and mTBI groupparticipants were recruited among individuals referred for a psychological or neuropsychologicalevaluation. All groups completed the IVA and the Neuropsychological Impairment Scale (NIS),a self-report scale of neuropsychological impairment. The Full Scale Visual and AuditoryAttention, Full Scale Visual and Auditory Response Accuracy, Secondary Visual and AuditoryAttention, and Secondary Visual and Auditory Response Accuracy scales were found to reflectimpairment for both the mTBI and ADHD groups but not for the control group. A multivariateanalysis of variance (MANOVA) between-group design was used for statistical analysis. A
DOES THE IVA COMPREHENSION SCALE DISCRIMINATE ADHD?11follow-up t-test was used to analyze significant univariate analyses. There were no statisticallysignificant differences in the mTBI and ADHD groups’ response patterns. In contrast, the selfreport scale (NIS) differentiated between the ADHD and mTBI groups on the FrustrationTolerance, Verbal Language Learning and Academic Activities scales. Tinus concluded that theIVA and the NIS tap into different but relevant constructs.Corbett and Constantine (2006) investigated the utility of the IVA as a tool to aiddifferential diagnosis and constructing profiles of attentional abilities for children with highfunctioning autism spectrum disorders (ASD) and ADHD. Three groups of 15 children each (anADHD group, an ASD group, and a healthy control group), balanced for age, gender andethnicity, were given the Autism Diagnostic Observation Schedule (ADOS), the Conners’ ParentRating Scale-Revised (Short Form) and the IVA. Participants also were administered theWeschler Abbreviated Scale of Intelligence (WASI) to ensure they met inclusion criteria of aFull Scale Intelligence Quotient (FSIQ) 70. The authors hypothesized that children with ASDwould show attention and response control deficits similar to children with ADHD. Furthermore,they hypothesized that the IVA would adequately discriminate between children with andwithout attentional symptoms. The authors performed multivariate analyses of covariance(MANCOVA) using age and FSIQ as covariates. They also performed discriminant functionalanalyses to determine the contribution of IVA scores in predicting ADHD classification. Lastly,Corbett and Constantine calculated Pearson product moment correlation coefficients between thefour IVA quotients and the attention and hyperactivity domain scores from the parent reportmeasure. The results revealed the IVA successfully identified attention deficits in each group.The authors found that the participants in both clinical groups had impaired performance on theIVA. Most of the children in the ASD group fell within the IVA’s ADHD-Combined Type
DOES THE IVA COMPREHENSION SCALE DISCRIMINATE ADHD?12category. The only measure that discriminated between the two clinical groups was the VisualResponse Control Quotient, with the ADHD group scoring lower than the ASD group. Corbettand Constantine noted that a larger sample size, matching participants for IQ, and including moreparticipants without ADHD symptoms could help improve the generalizability of this study.HypothesesSandford and Turner (2004) stated in the IVA test manual that the Comprehension scale isthe “single most sensitive subscale in discriminating ADHD” (p. 10). Based on a review of theliterature no peer-reviewed studies exist that specifically evaluate the ability of theComprehension scale to discriminate ADHD. Thus there is a clear need to evaluate thepsychometric properties of the Comprehension Scale of the IVA to determine its sensitivity indiscriminating ADHD, as well as specificity to the disorder.1. It was hypothesized that there would be significant differences between scores of theADHD group and the non-ADHD group on the Comprehension Scale. Specifically,the ADHD group was expected to score significantly lower than the non-ADHDgroup on both Visual and Auditory modalities of the Comprehension Scale.2. Furthermore, based on the test developers’ assertions and initial study it washypothesized that the Comprehension scale would have adequate sensitivity andspecificity.3. Furthermore, based on the test developers’ assertions it also was hypothesized that theComprehension scale would have better sensitivity and specificity than the VRCQand the ARCQ.
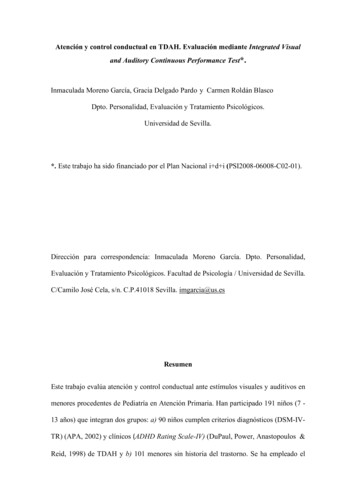
DOES THE IVA COMPREHENSION SCALE DISCRIMINATE ADHD?13MethodParticipants and SettingIVA Comprehension scores from an archival database were examined, along withdiagnostic and demographic information. One hundred and fifty-one records were extracted.Participants ranged from 17 to 60 years of age referred to a university clinical psychologytraining clinic for neuropsychological evaluation, primarily to seek college accommodations.Individuals were administered a comprehensive battery of neuropsychological tests. The sampleincluded 52 (34%) males and 99 (66%) females, with a range of 4 to 20 years of education. Inthe overall sample, 53 (35%) were given an ADHD diagnosis based on DSM-IV-TR criteria; ofthese, 20 (38%) had a comorbid learning disorder and 19 (37%) had one or more comorbidpsychiatric disorders (e.g., anxiety or mood disorder). In the overall sample, 60 (40%)individuals were diagnosed with a learning disorder without ADHD; of these, 11 (7%) had acomorbid psychiatric disorder. See Table 1 for demographic characteristics of the sample. Datafrom individuals diagnosed with Cognitive Disorder NOS were not analyzed in this study.
DOES THE IVA COMPREHENSION SCALE DISCRIMINATE ADHD?14Table 1Demographic characteristics of participant sampleVariableNumberPercent of sampleMales5234Females9966ADHD diagnosis5335ADHD and comorbid learning disorder2038ADHD and 1 comorbid psychiatricdisorder1937Learning disorder only6040Learning disorder and comorbidpsychiatric disorder117For an ADHD diagnosis, the IVA manual suggests that a cutoff score of 85 on theComprehension subscale is the most useful. In this study, the specificity and sensitivity ofadditional cutoff scores were explored: 75 (reflecting moderate impairment), 79 (reflectingmild to moderate impairment,), and 82 (reflecting mild impairment).ResultsUsing SPSS, independent samples t-tests were performed on visual and auditoryComprehension Scores for the ADHD and non-ADHD groups. Even if using a Bonferroniadjustment for multiple analyses, t-tests revealed significant differences between means of thetwo groups for both visual t(149) -2.73, p .007 and auditory subscales t(149) -2.32, p .021. However, there was significant overlap between the means and standard deviations for thetwo groups (see Table 2).
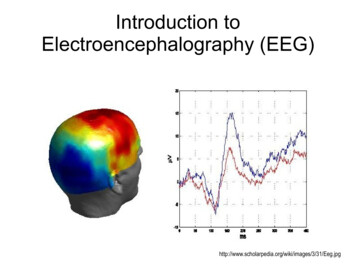
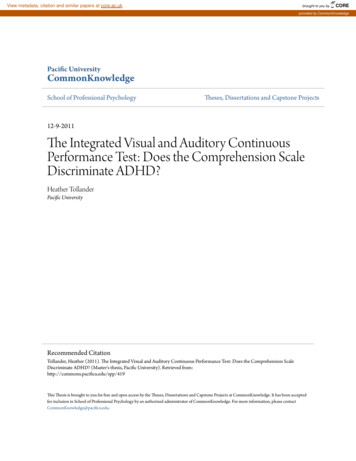
DOES THE IVA COMPREHENSION SCALE DISCRIMINATE ADHD?15Sensitivity and specificity also were calculated based on Visual or AuditoryComprehension scores that fell below the cutoff point. This analysis of sensitivity and specificitywas also intended to help determine the most appropriate cutoff score for an accurate diagnosis.When a cutoff point of 75 was used, the sensitivity, or the test’s ability to correctly identify aparticipant with an ADHD diagnosis, was .38, and the specificity, or the test’s ability to correctlyidentify participants without ADHD, was .76. When a cutoff point of 79 was used, the sensitivitywas .42 and specificity was .78. When a cutoff 82 was used, the sensitivity was .50 andspecificity was .74. Lastly, when a cutoff point of 85 was used as suggested by test developers,the sensitivity was .51 and specificity was .68.
DOES THE IVA COMPREHENSION SCALE DISCRIMINATE ADHD?16Table 2Means, Standard Deviations, and tt–scoresscores for ADHD and Control Groups on ComprehensionScalesADHDSig (two -No ADHDt - scoretailed(n 53)(n 98)78.87 (31.15)91.21(23.73)t(149) -2.732.730.007*Auditory Comprehension 81.17 (29.97)91.65(24.37)t(149) -2.322.320.021*Visual Comprehension*p .025Figure 1. Sensitivity and specificity for various clinical cut off points for the IVAComprehension Scale.Overall, as more stringent cutoff points were used, specificity increased while sensitivitydecreased (see Figure 1). However, it should be noted while this trend was observable, usingdifferent cutoff points resulted in only minimal changes in sensitivity and specificity.
DOES THE IVA COMPREHENSION SCALE DISCRIMINATE ADHD?17One hundred and thirty-three records were analyzed further (the remainder could not belocated due to a physical move of the data). Of these 133, participants also ranged from 17 to 60years of age. This sample included 67 (50%) males and 66 (50%) females, with a range of 4 to20 years of education. In the overall sample, 43 (32%) were given an ADHD diagnosis; of these,12 (9%) had a comorbid learning disorder and 12 (9%) had one or more comorbid psychiatricdisorders. In this sample, 53 (40%) individuals were diagnosed with a learning disorder withoutADHD; of these, 7 (5%) had a comorbid psychiatric disorder. See Table 3 for demographiccharacteristics of this sample.
DOES THE IVA COMPREHENSION SCALE DISCRIMINATE ADHD?18Table 3Demographic characteristics of sample for further analysisVariableNumberPercent of sampleMales6750Females6650ADHD diagnosis4332ADHD and comorbid learning disorder129ADHD and 1 comorbid psychiatricdisorder129Learning di
DOES THE IVA COMPREHENSION SCALE DISCRIMINATE ADHD? 5 The test developers stated that it is intended to "identify random responding by measuring idiopathic errors (Sanford & Turner, 2004, p. 10)." Furthermore, the test developers stated that the "Comprehension Scale is the single most sensitive subscale in discriminating ADHD" (p.10).