Transcription
SLA ANNUALSALARY SURVEYANDWORKPLACE STUDY2008A RESEARCH PUBLICATION OFTHE SPECIAL LIBRARIES ASSOCIATION (SLA)ALEXANDRIA, VIRGINIA, U.S.ACOMPILED AND EDITED BYJOHN LATHAM, M.S.L.S.
2008 BY SPECIAL LIBRARIES ASSOCIATIONINTERNATIONAL HEADQUARTERS331 SOUTH PATRICK STREETALEXANDRIA, VIRGINIA 22314-3501, U.S.A. 1-703-647-4900WWW.SLA.ORGALL RIGHTS RESERVEDREPRODUCTION OUTSIDE OF FAIR USE (SECTION 107 OF THE COPYRIGHT ACT)IS PROHIBITED WITHOUT WRITTEN PERMISSION OF THE PUBLISHER.MANUFACTURED IN THE UNITED STATES OF AMERICAISBN 0-87111-558-1
ContentsPagesINTRODUCTION, METHODOLOGY & KEY FINDINGSCANADA1 – 1213 – 102Chapter One: All Canadian Respondents13 – 32Chapter Two: Primary Responsibility – Administrative/Management33 – 46Chapter Three: Primary Responsibility – CI/Research47 – 60Chapter Four: Primary Responsibility – Reference61 – 74Chapter Five: Primary Responsibility – General Responsibilities75 – 88Chapter Six: Primary Responsibility – Technical ServicesUNITED STATES89 – 102103 – 228Chapter Seven: All United States Respondents103 – 128Chapter Eight: Primary Responsibility – Administrative/Management129 – 148Chapter Nine: Primary Responsibility – CI/Research149 – 170Chapter Ten: Primary Responsibility – Reference171 – 190Chapter Eleven: Primary Responsibility – General Responsibilities191 – 212Chapter Twelve: Primary Responsibility – Technical Services213 – 228SLA EUROPE229 – 254Chapter Thirteen: All United Kingdom Respondents229 – 242Chapter Fourteen: All Other European Respondents243 – 254APPENDIX A – SURVEY INSTRUMENT255 – 266APPENDIX B – CENSUS MAPS OF CANADA AND THE US267 – 270WORKPLACE STUDY EXECUTIVE SUMMARY271 – 276APPENDIX C – STATISTICAL TABLES277 – 304APPENDIX D – HR SUPPLEMENT SURVEY INSTRUMENT305 – 310
Organization of Tables Within ChaptersDEMOGRAPHIC DATATable 1 – Salary Distribution by Region/Census DivisionTable 2 – Salary Distribution by Metropolitan AreasTable 3 – Salary Distribution by Subject Degree FieldTable 4 – Salary Distribution by Library/Information Science DegreeTable 5 – Salary Distribution by Degree HeldTable 6 – Salary Distribution by Years of Library ExperienceTable 7 – Salary Distribution by Years of Total Work ExperienceTable 8 – Salary Distribution by GenderTable 9 – Salary Distribution by Ethnicity/RaceINSTITUTIONAL DATATable 10 – Salary Distribution by Number of EmployeesTable 11 – Salary Distribution by Non-profit StatusTable 12 – Salary Distribution by Business SectorTable 13 – Salary Distribution by Institution/IndustryTable 14 – Salary Distribution by Institution/Industry and Library/Information Center BudgetTable 15 – Salary Distribution by Union v. Non-unionJOB-SPECIFIC DATATable 16 – Salary Distribution by Number of Years with Present EmployerTable 17 – Salary Distribution by Number of Employees Supervised or ManagedTable 18 – Salary Distribution by Primary Job ResponsibilityTable 19 – Salary Distribution by Primary Job TitleTable 20 – Salary Distribution by Library or Information Resource Center SettingTable 21 – Salary Distribution by Library/Information Center Annual BudgetTable 22 – Salary Distribution by Full-time Equivalent Employees in Library/Information CenterTable 23 – Number and Percentage of Employees by Type of Benefits Provided by Institution GroupTable 24 – Health Insurance Plan Provided by Institution GroupTable 25 – Individual Coverage Health Insurance Plan Benefits Provided by Institution GroupTable 26 – Dependent Coverage Health Insurance Plan Benefits Provided by Institution GroupTable 27 – Total Outlay for Health Insurance Benefits by Institution GroupTable 28 – Salary Distribution by Employed/Self-Employed StatusTable 29 – Salary Distribution by Contract Basis at Primary JobTable 30 – Salary Distribution by Number of Part-time Jobs HeldTable 31 – Salary Distribution by Number of Part-time Hours Worked per WeekTable 32 – Salary Distribution by Reasons for Working Part-timeTable 33 – Average Hourly Rate for Part-time Employees by Census Division
SLA 2008 Annual Salary Survey: Introduction, Methodology & Key FindingsINTRODUCTIONScope and PurposeThe objectives of SLA’s 12th annual Salary Survey are to:xcollect and analyze systematic, accurate information about the salaries of speciallibrarians and information professionals;xestablish a data bank to provide salary-related information to SLA members, theiremployers, library and information science students and faculty, library and informationscience professionals generally and human resource and compensation personnel;xenable SLA members to assess their own salaries in light of measurable characteristics, suchas level of education, years of experience, job responsibilities, and geographic location.This report includes the SLA Workplace Study, the objectives of which are to:xenhance the SLA annual salary survey results with additional information about benefits,trends in hiring and expenditure, and changes in job descriptions and competencies ofinformation professionals;xestablish a data bank to provide salary-related information to SLA members, theiremployers, library and information science students and faculty, library and informationscience professionals generally and human resources and compensation personnel.HistorySLA has conducted salary surveys since 1967, triennially from 1967 to 1990, biennially from 1990 to1996 and annually from 1997 to the present. The Association has published the results of this survey inmonograph form since 1982 and in the journal Special Libraries prior to that. Before conducting thesurvey annually, SLA provided abbreviated updates for the years a full survey was not administered.These annual updates were based on a shortened questionnaire and a smaller member sample, andthe results were published in Special Libraries. Since 2003, the entire survey has been conductedonline. In 2004, an online Salary Calculator was added, and in 2005 the SLA Workplace Study wasconducted for the first time. In 2007, SLA Europe members were surveyed for the first time along withmembers located in the U.S. and Canada. The number of respondents, while small in number, providedsignificant data to show tables for U.K. salaries, in Pounds Sterling, as well as tables for other Europeancountries, expressed in Euros.Survey AdministrationThe 2008 survey was again conducted online. The questionnaire was hosted on a secure Web sitemaintained by Association Research Inc. (ARI).In April, an e-mail invitation to participate was sent to all full and student members of SLA located inthe U.S. and Canada, and SLA Europe chapter members. The e-mail was sent to 9,695 members;601 bounced and another 123 opted not to participate in the survey, bringing the total sample sizeto 8,971 members. Each personalized e-mail contained a link to the survey Web site. Additionalfollow-up e-mails were sent in May and June. As in prior years, data from the 2008 salary survey wereedited and tabulated by ARI to ensure respondent confidentiality. A member in good standing of theCouncil of American Survey Research Organizations (CASRO), ARI has extensive experience indesigning, tabulating, and interpreting surveys and also in working with the greater association community.Page 1
SLA 2008 Annual Salary Survey: Introduction, Methodology & Key FindingsA total of 3,937 individuals accessed the online survey and submitted some data. Of that number,3,875 provided enough information to be included in the analytical database.Table 1: Response Rate for SLA Salary ysCompletedResponse 41%41%43%* Conducted online**All U.S. and Canadian members were included in the sample.***All U.S., Canadian, and SLA Europe chapter members were included in the sample.Changes to and Organization of the 2008 Salary Survey ReportA supplemental survey directed to Human Resources (HR) Professionals was distributed in addition to the2008 Salary Survey questionnaire. This Workplace Study is found at the end of the Salary Survey results.For the 2008 report, salary data are reported for an additional major area of responsibility, namely,CI/Research. Included in this group are respondents who listed their primary responsibility as:xxxCompetitive intelligence (CI), business research,Online/electronic/literature researcher, orResearch analyst.The salary survey report is organized so that information is grouped together as follows:Data on the United States and Canada is separated so that all tables relevant to each countryare grouped together. Chapters one through six include Canadian data, while chapters seventhrough twelve are comprised of U.S. data. Data for the United Kingdom respondents are inChapter Thirteen, while data for other European respondents are in Chapter Fourteen.Each chapter represents the data for a specific job description. Chapters one and seven are forall Canadian and U.S. respondents, respectively; chapters two and eight refer to data for thoseserving primarily in an administrative or managerial capacity; chapters three and nine relate todata for reference librarians and professionals; chapters four and ten are for those with “generalresponsibilities,” chapters five and eleven report data for those performing technical services,and chapters six and twelve cover data for “CI/Research.” Approximately 68% of allrespondents fit into one of the five job descriptions above, with the other 32% of respondentsfragmented among the remaining 17 job descriptions.Due to the sample sizes for SLA Europe respondents, only summary tables for allrespondents are included—data by job description are not included.Page 2
SLA 2008 Annual Salary Survey: Introduction, Methodology & Key FindingsThe data within each chapter are divided into three sections: demographic, institutional, andjob-specific. Demographic data relate to personal characteristics of the respondent,institutional data relate to characteristics of the respondent’s employer, and job-specific dataare that which relate to the particular job held by the respondent.SLA Salary CalculatorThis report contains a vast amount of salary data sorted and tabulated by numerous demographic andworkplace characteristics. All of the tables are two dimensional, which limits you to viewing salary byone characteristic at a time—for example, location, job title, or experience—but not all at once.SLA has developed an online interactive tool to analyze U.S. and Canadian informationprofessionals’ salaries based on multiple characteristics. (There were not sufficient data to includeU.K. or other European salaries in the Salary Calculator.) You can select a specific set ofcharacteristics to compare yourself to other professionals. And, you can get instant feedback as youinvestigate how salaries vary based on characteristics such as:xxxxxxxPrimary responsibilityJob titleLibrary/Information Center budgetLibrary experienceNumber of employees supervisedLocation (U.S. Census District or Canadian Region)For profit or not-for-profit organizationThe Salary Calculator incorporates predetermined ranges or brackets, such as “Budget under 100,000,” “ 100,000- 999,999,” and “ 1,000,000 or more.”After you select each criterion, the Salary Calculator will compute the average salary for all surveyrespondents in the database who meet all of the criteria you selected.Not only can you match your current situation, you can run some “what if” scenarios, such as “Howmuch salary might I earn if I moved to a different region, changed responsibilities, and worked in alarger information center?” To avoid mixing U.S. and Canadian denominated salaries, you simplyselect a country and you then will have access to the other selection criteria.The Salary Calculator will not answer every question, but will help you determine your value as aninformation professional.This exciting tool is available exclusively to purchasers of the complete SLA Annual Salary Survey.To access the Salary Calculator, please go to www.sla.org/salarycalculator08 and follow theinstructions. Please remember to use the password that was included in the cover letter thataccompanied this report.Page 3
SLA 2008 Annual Salary Survey: Introduction, Methodology & Key FindingsJOB DESCRIPTIONS AND MAJOR AREAS OF ive/managementCI/RESEARCHCompetitive intelligence, business researchOnline/electronic/literature researcherResearch analystREFERENCEReferenceGENERAL RESPONSIBILITIESGeneral responsibilities (e.g., solo librarians)TECHNICAL SERVICESTechnical servicesAcquisitions, collection developmentCatalogingCirculation, interlibrary loanOTHER RESPONSIBILITIES INCLUDED IN ALL RESPONDENTSAdministrative support/clericalAbstracting, indexing, bibliographic and thesaurus developmentAlert services, current awareness/environmental scanningArchives, conservation, preservationComputer systems specialist, automation, IT administrationDatabase/software designInformation product/database developmentIntranet/portal development, Web content managementKnowledge managementLegal researchPublishing, editing, writingRecords managementSubject specialistTeaching for college/university (library school faculty)Teacher, user trainingVendor/customer service, salesOtherPage 4
SLA 2008 Annual Salary Survey: Introduction, Methodology & Key FindingsJOB TITLEIn each chapter, Table 19 displays salary distributions by job title. These positions are definedbelow:Chief Information Officer, Vice President, Executive – overall responsibility for multipledepartments or areas.Director, Manager – full responsibility for budgeting, supervising and administeringdepartment operations; may include project management, designing and implementinginformation services or Web content.Assistant Manager, Department or Section Head – responsible for administration of aspecific area within the department.Librarian, Information Specialist, Researcher, Analyst – performs professionalinformation services and research with little or no administrative responsibility; mayinclude answering reference questions, cataloging, analyzing and interpreting data.Webmaster – responsible for designing Web site and managing Web content.Support Staff – under general or direct supervision, performs work to assist and support amanager.Professor, Academic Instructor – instructs students, conducts research, represents acommittee.Product Sales Manager or Representative – sells information products or training, mayhave wide range of admin duties.Owner, Principal, Consultant – self-employed in own business.Page 5
SLA 2008 Annual Salary Survey: Introduction, Methodology & Key FindingsDATA CONSIDERATIONS AND TABLE INTERPRETATIONWith the exception of Table 23(benefits information), all data presented in Tables 1 through 33 ofeach chapter are based on work-related earnings, before deductions, for full-time workers as ofApril 1, 2008. Though the 2008 questionnaire included a question about other forms ofcompensation, such as bonuses, commissions, and overtime, those earnings are not included inthe salary data.The basic earnings question in the 2008 survey asked for work-related earnings AND the time unitof pay to account for the increase in contracting and temporary work. In order to include as manycases as possible, the earnings for all full-time workers were then converted into yearly earnings.These work-related earnings are referred to as “salary” throughout the report.Data on respondents who reported that they worked part-time or were unemployed can be found inTables 30 through 33 in each chapter. In many cases, however, those tables have been omitteddue to an insufficient number of respondents.Table rows with fewer than five respondents have been omitted to protect the anonymity ofrespondents and tables with no valid rows have likewise been omitted. Table rows withbetween five and nine respondents do not report data for the 90th percentile due to the algorithmused by the statistical program.All salary-related tables in the salary survey provide earnings data for respondents in the 10th, 25th(first quartile), 50th (median), 75th (third quartile) and 90th percentiles and also report a mean for thetable row.Percentiles are determined by rank ordering all salaries in a given response set from lowest tohighest, with the salary in the middle of the ranking representing the 50th percentile (median), thesalary one quarter of the way up from the lowest salary representing the 25th percentile (firstquartile), etc. The mean is the arithmetic average of all reported salaries as determined bysumming each salary and dividing by the number of cases. The median is often used in salarycomparisons since reporting the center of distribution minimizes the effect of those few people whomay earn dramatically more than their peers. The mean is more sensitive to such outliers and insome cases it is possible that a majority of respondents may earn far less than the mean.In addition to reporting the various percentiles and mean salary for each table row, the salarysurvey also includes the number of respondents in the table row and the mean percent change from2007 to 2008.Importantly, the mean percent changes in this report are calculated only for respondents inthe same job and at the same organization in 2008 that they were in 2007 and do notrepresent the mean percent change from the data in the 2007 survey.Additionally, the final row on all tables is the baseline for all respondents who are being reported onin a given chapter (and thus does not change from table to table). It is not a summary ofrespondents who answered the question being reported on in the table. Likewise, the finalrow of the tables relating to part-time employees included data for all respondents who reportedworking part-time rather than a summary of data for the individual table.Page 6
SLA 2008 Annual Salary Survey: Introduction, Methodology & Key Findings2008 MEAN AND MEDIAN SALARY DATATable 2 below shows the distribution of salaries for all respondents.Table 2: 2008 Basic Annual ntile 25%ThirdQuartile75%Median50%90thPercentile Number MeanMeanPercentChangeAll Canadian 15.4%All U.S. 8125.3%All U.K. 44.2%All Other 0002664,9867.0%*All salaries in Canadian tables are reported in Canadian dollars. The exchange rate on April 1, 2008, was 1.02 Canadian 1 U.S.** All salaries in U.K. tables are reported in Pounds Sterling. The exchange rate on April 1, 2008, was .50 1 U.S.***All salaries in other European tables are reported in Euros. The exchange rate on April 1, 2008, was .63 1 U.S.In the United States, the average mean increase for special librarians and other informationprofessionals was 5.3%, higher than the national rate.The Canadian mean increase is nearly the same at 5.4%.Tables 3A and 3B put the 2007 to 2008 increases in historical perspective for Canada and the U.S.Table 3A: Basic Annual Salaries - Canada ian50%ThirdQuartile90th75% Percentile 055,00065,00080,33897,79231269,971Page 7
SLA 2008 Annual Salary Survey: Introduction, Methodology & Key FindingsTable 3B: Basic Annual Salaries - United States 220012002Page 8
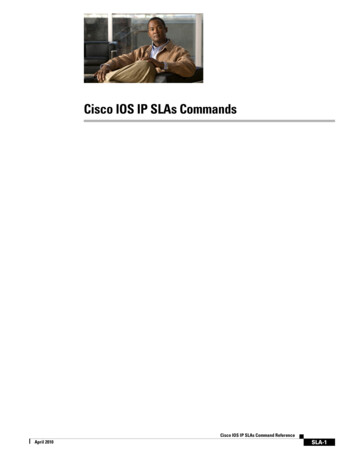
SLA 2008 Annual Salary Survey: Introduction, Methodology & Key FindingsTHE CONSUMER PRICE INDEX AND MEDIAN SALARIESUnited StatesThe U.S. Consumer Price Index (CPI) is compiled by the Bureau of Labor Statistics and is ameasure of the average change over time in the prices of goods and services in major expendituregroups – such as food, housing, apparel, transportation, medical care and entertainment – typicallypurchased by urban consumers. Essentially, it measures the purchasing power of consumer dollarsby comparing what a sample “market basket” of goods and services costs today with what the samesample market basket cost at an earlier date. In terms of income, the CPI adjusted income of anindividual represents how much income is necessary to purchase the same basket of goods todayas at an earlier date.Reported median salaries of special librarians in the United States (Table 4) have outstripped costof living increases over the past 23 years. Using the 1985 median reported salary of 27,280 as abaseline, an information professional would need to earn 54,464 today to have kept pace with theConsumer Price Index. With the median reported income of the 2008 salary survey equal to 66,000, SLA members have actually made significant gains vs. the CPI.Table 4: U.S. Reported Salaries and Historical CPI Comparison70,00060,000Median Salary (U.S. 01992199419961997199819992000Median Salary Reported by SLAPage 92001200220032004Salary Adjusted by CPI2005200620072008
SLA 2008 Annual Salary Survey: Introduction, Methodology & Key FindingsTable 5 provides a detailed explanation of special librarians’ gains vs. the CPI by showing theannual rate of increase in median salaries vs. the annual rate of increase in the CPI. Data arereported only for years in which a salary survey was conducted and the increases in both mediansalary and CPI have been annualized to account for the differing lengths of time between surveys.Table 5: Annualized Increases in Median Salary vs. the CPI - U.S.8.07.06.0Percent 00200120012002Annual Change in Median Salary Reported by 8Annual Change in CPICanadaStatistics Canada compiles a Consumer Price Index for Canada, reflecting the cost of a marketbasket of commonly purchased goods and services to permit the comparison of purchasing powerof money over time. Similar to their U.S. counterparts, Canadian special librarians have graduallyimproved their financial position compared to the CPI over the last 23 years. According to the 2008data, the median salary of Canadian respondents is now 65,000, while the salary necessary tokeep up with the CPI over the last 17 years is the considerably lower figure of 57,184Page 10
SLA 2008 Annual Salary Survey: Introduction, Methodology & Key FindingsTable 6: Canadian Reported Salaries and Historical CPI Comparison70,000Median Salary (Canadian 988199019921994199619971998199920002001Median Salary Reported by ary Adjusted by CPITable 7: Annualized Increases in Median Salary vs. the CPI - Canada8.07.06.0Percent nual Change in Median Salary Reported by SLAPage 1120002001200120022002200320032004Annual Change in CPI2004200520052006
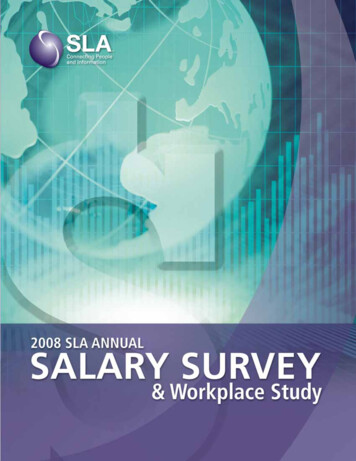
SLA 2008 Annual Salary Survey: Introduction, Methodology & Key FindingsSALARIES OF SPECIAL LIBRARIANS VS.SALARIES OF ALL LIBRARIANSUnited StatesAs Table 8 below shows, the additional training of SLA members has proved rewarding whencompared to the earnings of all librarians. Comparing historical data from the Bureau of LaborStatistics’ Division of Labor Force Statistics and median reported salaries on past salary surveysshows that for 2007, special librarians’ median earnings ( 64,000) exceed the median earnings ofall librarians by just over 20,000 per year.Table 8: U.S. Median Annual Salaries - Special Librarians vs. All Librarians70,00060,000Median Salary (U.S. 0199219941996199719981999Special Librarians Reported by SLA20002001200220032004200520062007All Librarians Reported by BLSCanadaUnfortunately, Statistics Canada has not reported mean weekly earnings for Canadian librarianssince 1996, so it is no longer possible to compare the salaries of Canadian special librarians with allCanadian librarians. However, in 1996, the gap was approximately 25,000 per year and growing.Page 12
CANADAChapter OneAll RespondentsPage 13
SLA 2008 Annual Survey: CANADA – Chapter One (All Respondents)Page 14
SLA 2008 Annual Salary Survey: CANADA - Chapter One (All Respondents)Table 1 - Salary Distribution by entChangeAtlantic - Postal Codes A, B, C, and E38,00040,70565,00077,740.560,3787.5%Quebec - Postal Codes G, H, and J44,90054,87565,00080,64996,5004468,8015.1%Ontario - Postal Codes K, L, M, N, and ies - Postal Codes R, S, and h Columbia - Postal Code V43,50052,50062,00072,00087,0004963,3555.4%All 5.4%Table 2 - Salary Distribution by Metropolitan tChangeMetro Quebec West67,00070,75077,82995,715.682,2534.5%Eastern Central Metro Southwestern 6,30061,12574,50090,750106,8003475,5526.9%British All 5.4%Table 3 - Salary Distribution by Subject Degree ,6154.6%Some college but no degree48,52251,02558,00065,00070,8003159,5175.1%No college45,60052,00060,00070,000.765,3718.7%All 5.4%*All salaries in Canadian tables are reported in Canadian dollars. The exchange rate on April 1, 2008, was 1.02 Canadian 1 U.S.Page 15
SLA 2008 Annual Salary Survey: CANADA - Chapter One (All Respondents)Table 4 - Salary Distribution by Library/Information Science 1761,6383.6%Some college but no degree42,33347,10754,00063,50073,5203356,4915.7%No ll 5.4%Table 5 - Salary Distribution by Degree tChangeBiomedical %Business, Human Resources, 01273,3034.7%Communications/Journalism/ Earth /Literature/ 6.1%Fine and Applied Arts48,50056,00064,00083,200.968,8787.6%Foreign Languages/ Culture eneral phy, al %Social Other45,72150,38363,25073,00092,2164665,3165.9%All 5.4%*All salaries in Canadian tables are reported in Canadian dollars. The exchange rate on April 1, 2008, was 1.02 Canadian 1 U.S.Page 16
SLA 2008 Annual Salary Survey: CANADA - Chapter One (All Respondents)Table 6 - Salary Distribution by Years of Library ian50%ThirdQuartile75%90thPercentileNumberMeanM
establish a data bank to provide salary-related information to SLA members, their employers, library and information science students and faculty, library and information science professionals generally and human resource and compensation personnel; enable SLA members to assess their own sa laries in light of measurable characteristics, such