Transcription
GlassHouse Research12/12/18Accounting Concerns Finally Catch up with the Roll-Up j2 GlobalWho is GlassHouse Research? GlassHouse Research (GHR) is made up of former forensicaccountants/analysts who have worked for prominent hedge funds on Wall Street, as well asboutique forensic accounting firms. Our purpose is to expose public companies that havebeen taking advantage of US GAAP as well as IFRS accounting for their benefit. We seek tofind companies where GAAP (or even worse, non-GAAP) earnings are deviating from trueeconomic earnings of the target firm.Overall, we search for evidence of a “culture of fraud” within public companies.Disclaimer: As of the publication date of this report, GlassHouse, LLC and others that contributed research to this report andothers that we have shared our research with (collectively, the “Authors”) have short positions in, and own put option positionson, the stock of j2 Global, Inc. (JCOM), and stand to realize gains in the event that the price of the stock decreases. Followingpublication of the report, the Authors may transact in the securities of the company covered herein. All content in this reportrepresent the opinions of GlassHouse. The Authors have obtained all information herein from sources they believe to beaccurate and reliable. However, such information is presented “as is,” without warranty of any kind – whether express orimplied. The Authors make no representation, express or implied, as to the accuracy, timeliness, or completeness of any suchinformation or with regard to the results obtained from its use. All expressions of opinion are subject to change without notice,and the Authors do not undertake to update or supplement this report or any information contained herein. Please read ourfull legal disclaimer at the end of the report.1 Page
Initiation of j2 Global, Inc. (JCOM) with a Target Price of 24.77GlassHouse Research focuses on the ill-fated roll-up j2 Global, Inc. (JCOM), which uses amyriad of acquisitions to conceal non-reported organic declines and stagnant earnings. JCOM’s continued use of acquisitions concurrent with declining ROIC and organic growthwill cause its demise: While the company has recently enjoyed double-digit revenue gainsthat have astounded analysts, our own analysis of estimated organic growth detail adeteriorating core company underneath the multitude of acquisitions presented every year.Contemporaneous with unfavorable trends regarding the firm’s RNOA and ROIC metrics,we believe these trends indicate significant risk to the sustainability of future earnings. Acquisition accounting remains suspect at j2 Global, as current accounting concerns nowattach a time catalyst to JCOM’s share-price demise: j2’s once manageable goodwillbalance has grown to a corpulent size on the balance sheet through persistentacquisitions. Furthermore, we find dubious liability transactions within the company’sacquisition accounting that lead us to believe future reserves are being artificially created. Sell-side analysts are fooled by deceptive non-GAAP exclusions that GHR will expose asneither non-recurring nor non-cash expenses: j2 is the benefactor from one of the worstuses of non-GAAP exclusions we have seen in our experience. TTM non-GAAP income( 6.04) now stands 134% above GAAP income of 2.58, representing the highest deviationin JCOM’s history. Persistent material exclusions of intangible amortization expenses,acquisition-related costs, and stock-based compensation obfuscate JCOM’s true economicearnings. j2 has reported suspect accounting practices in addition to retaining lower-tieredaccounting firms in years past: Using auditing firms such as BDO LLP and SingerLewakgive GHR cause for concern as a company of this size and complexity should be using aBig 4 accounting firm. Also, JCOM’s lack of accounting experience in key positions suchas its CFO and anyone on its audit committee should raise red flags for their investors. Premium valuation erroneously based on “adjusted” earnings is unwarranted given thematerial long-term structural issues and near-term accounting risk: Using a sustainableearnings figure detailed in this report, GHR will show why we believe an approximate64.2% downside to JCOM’s current share price is in its future.2 Page
Company Backgroundj2 Global, Inc., together with its subsidiaries, engages in the provision of Internet servicesworldwide. It operates through two segments, Cloud Services and Digital Media.The Cloud Services segment offers cloud services to sole proprietors, small to medium-sizedbusinesses and enterprises and government organizations. This segment provides online faxservices under the eFax, sFax, MyFax, eFax Plus, eFax Pro, eFax Secure, eFax Corporate,and eFax Developer names; on-demand voice and unified communications services under theeVoice and Onebox names; online backup and disaster recovery solutions under theKeepItSafe, LiveDrive, LiveVault, and SugarSync names; email security, encryption,archival, and perimeter protection solutions services under the FuseMail name; emailmarketing services under the Campaigner name; and customer relationship managementsolutions and customer support services.The Digital Media segment operates a portfolio of web properties, including IGN.com,Mashable.com, PCMag.com, HumbleBundle.com, Speedtest.net, AskMen.com,MedPageToday.com, Offers.com, and Everydayhealth.com that offer technology products,gaming and lifestyle products and services, news and commentary related products, speedtesting for Internet and network connections, and online deals and discounts for consumers,as well as professional networking tools, targeted emails, and white papers for ITprofessionals. This segment also sells display and video advertising solutions, as well astargets advertising across the Internet; sells business-to-business leads for IT vendors;promotes deals and discounts on its Web properties for consumers; and licenses the right touse PCMag's Editors' Choice logo and other copyrighted editorial content to businesses.The company was formerly known as j2 Global Communications, Inc. and changed its nameto j2 Global, Inc. in December 2011. j2 Global, Inc. was founded in 1995 and isheadquartered in Los Angeles, California.3 Page
Roll-Up Model Obfuscates True Economic Earnings at j2 Globalj2 Global (JCOM) and its management are currently stuck in an incorrigible state wheremanagement must continue to acquire lackluster companies in order to push its top line toappease Wall Street. The bull case for JCOM lies within management’s ability to leverage itscash from its declining eFax business into turnaround acquisitions on the Digital side of thehouse. The firm is also constantly touted as a major free-cash-flow generator, mollifying itsinvestors and analysts on the street.However, in our report we focus mainly on the unsustainability of JCOM’s persistence ofearnings, in addition to detailing how j2’s cash generation is mainly a farce. While shortsellers have pointed out j2’s fundamental headwinds in the past and for the most part got thetiming wrong, we intend to show in our report newly-found accounting concerns that puts atime-catalyst on JCOM’s ominous future.If JCOM is using acquisitions as an integral part to its growthstrategy and operations, why are analysts allowingmanagement to remove acquisitions costs as one-time items?j2’s management is stuck in an acquiring cycle where it currently enjoys all the benefits listedbelow. However, due to higher interest rates and limited future acquisitions, we believe oncethis acquiring cycle slows down (as we believe it is currently), this will cause the company tounravel over the next year. The acquiring of companies has caused revenues to inorganically rise by doubledigits over the past seven years. Any setbacks to the top line growth will havedevastating effects to the stock price and management knows this. The continued use of acquisitions has quietly masked a deteriorating e-fax divisionthat is the core of JCOM’s business. Management’s lack of disclosures regarding organic revenue makes it extremelyeasy for them to mask unfavorable organic revenue trends from complacent sellside analysts. The concealing of this metric would be akin to a retailer notdisclosing their same-store-sales metrics.4 Page
The use of purchasing assets through acquisitions allows management to tout areported cosmetic Cash-Flow-from-Operations figure that does not take intoaccount cash spent on acquisitions. This allows management to exclude highly substantial amortization expenses(where real cash was spent in the acquisition) from non-GAAP earnings becausethey are incorrectly deemed as “non-cash”. Management is then able to exclude very-much recurring acquisition-related costsfrom non-GAAP earnings because management deems them to be “non-recurring”in nature. However, with 152 acquisitions executed in the last 10 years, we believethese expenses to be highly reoccurring based on this evidence. Furthermore, management can effectively “purchase” its R&D through acquiringcompanies. Therefore, management can now withhold on internal R&Dexpenditures to artificially improve margins. This is apparent at j2 with R&Dmargins falling to a 10-year low under 4% in the most recent TTM period.With all the aforementioned reasons given, it is obvious to us why j2’s management hascontinued motivation to use its acquisition growth strategy. Listed as the first Risk Factor inthe firm’s 10K, here is the excerpt management gives with regards to its growth strategy:Acquisitions and investments in our business have historically played a significant role inour growth and we anticipate that they will continue to do so.We must acquire additional or invest in new or current businesses, products, services andtechnologies that complement or augment our service offerings and customer base inorder to sustain our rate of growth. We may not successfully identify suitable acquisitioncandidates or investment strategies, manage disparate technologies, lines of business,personnel and corporate cultures, realize our business strategy or the expected return on ourinvestment or manage a geographically dispersed company. If we are unable to identify andexecute on acquisitions or execute on our investment strategies, our revenues, business,prospects, financial condition, operating results and cash flows could suffer. [Emphasisadded]5 Page
Here is CEO Vivek Shah detailing future acquisition plans in a recent JCOM earnings call:This is all to say that acquisition is part of our DNA and runs deep inside of thecompany. It's not just me and Scott waving a magic M&A wand. It's a – it'sfundamental to what we do and who we are, and we recruit talent that cansucceed in our environment.While we believe what we've built as an acquisition system is valuable, we're notalone. The marketplace refers to companies like ours with different labels, but theterm often used is a "serial acquirer”.Needless to say, j2 Global is a serial acquirer that tries to turnaround bloated companiesthrough either slashing the acquiree’s workforce or by buying it at a perceived discount.While this strategy can work, what we take issue with is how j2’s acquisitions haveobfuscated true economic earnings at the company. Just as many managers have tried beforewith other roll-ups, we believe that management has touted many farce operating metricsthat do not show j2’s true economic value. As a result, we believe JCOM’s true valuecurrently lies 64.2% below current market price, based on our analysis.6 Page
Estimated Organic Revenue Growth Turns Negative in Recent YearsGlassHouse Research ultimately believes that j2’s organic growth rate is being withheld fromanalysts in order to conceal its deteriorating status. As discussed above, we relate thewithholding of this metric similar to a retailer not disclosing its comps metric. The fact thatmanagement has been so resistant to disclose this metric gives us cause for concern. Below wereveal recent issues regarding JCOM’s lack of disclosures relating to its organic growth rate:1) Not to be found in any of j2 Global’s press releases, management does not point outhow much revenue growth was attributable to acquisitions per period. This is a verycommon excerpt in most acquisitive companies as the earnings release is the firstthing analysts look at when a company reports its quarter.2) The company spent over 200 million on acquisitions in 2017; a highly material figurefor a firm of this size. However peculiarly and with no explanation given, JCOM didnot disclose any pro forma financials for its acquisitions as it has in every year datingback to 2011.1 We found that withholding this data made our own estimations oforganic growth entirely impossible for 2018 (more on this in later sections).3) The company encourages analysts to focus on its non-GAAP earnings, free-cash-flow(sans acquisitions) and adjusted EBITDA metrics instead of what we believe are moreaccurate representations of the company which are organic growth: GAAP earningsand free-cash-flow including acquisitions.4) The firm’s organic growth rate was only previously asked about and discussed datingback to conference calls in 2011. Here, j2’s CFO, Robert Turicchi gave ballparkfigures regarding this rate. Curiously, analysts covering the name have not askedabout this metric dating back over seven years.5) Finally, in the Q4 2010 earnings call, Mr. Turicchi dodged a question regardingorganic growth in 2011. When asked how much of the 2011 revenue growth was fromorganic growth, Mr. Turicchi replied, “Well, as I said, there’s no M&A that is materialto the guidance top or bottom line for 2011.” While this was technically true due toJCOM having limited acquisitions in 2011, this failed to disclose that essentially all of1The last time the firm did not disclose this information was in the 2011 10K when the firm spent a whopping 3.8 million ontotal acquisitions.7 Page
the 29.3% revenue gain that year was due to its PROTUS acquisition made on12/03/10. In other words, no organic revenue growth.We point out these past instances to show how management has been reluctant to disclosethis very important figure even though it would help investors to judge the trajectory of itscore business. While management will tout how this figure is not needed because purchasingcompanies is a part of its core business, we take issue with how the firm continues to excludeamortization expenses or acquisitions costs from their adjusted numbers, though they are sointegral to the company’s future success. JCOM cannot have it both ways in this regard.Obvious to the JCOM investor, total revenues at the firm have grown at a double-digit pacedating back to 2011 (see Table 1, Page 9). However, throughout this period, we calculate anapproximate organic growth figure that has been fairly flat, if not declining, since 2013.Furthermore, we calculate that the recent declines have accelerated in recent periods, leadingus to believe the core business is suffering greatly in stealth. The lack of consistency anddisclosures, based on our experience, can only mean that the core company is sufferingwithout the help of acquisitions.Based on disclosures of proforma financials and revenue contributed from acquisitions inJCOM’s 10K and 10Q filings, GHR is able to calculate a base estimation regarding the firm’sorganic growth (or lack thereof). As discussed above, management did not disclose itsproforma figures regarding its acquisitions in its 2017 Annual Report. However, the 10Kdisclosures did indicate that “For the year ended 12/31/17, these acquisitions2 contributed 34.7 million to the company’s revenues.”Therefore, while the 34.7 million figure provides us with revenue gained from acquisitions in2017, we cannot ascertain the full organic revenue figure because these acquisitions were notall in effect as of 01/01/2017. Moreover, there were prior acquisitions in 2016 that did notfully annualize in 2017, skewing the data even more. Therefore, in order to estimate anaccurate organic growth rate, we need to factor in both revenues acquired during the year aswell as the difference in proforma and reported revenues in the prior year.32This figure only includes revenues from acquisitions made in 2017.If the run rate for an acquisition or group of acquisitions is flat year over year (i.e., the acquisitions generate nogrowth in the following year), the acquisition-related gain received in the next year will be exactly equal to thedifference between proforma and reported revenue for the prior year. Per the 2017 10K, proforma revenueexceeded as-reported revenue by 228.3 million in 2016. Furthermore, 34.7 million was contributed to revenuesfrom acquisitions in 2017.38 Page
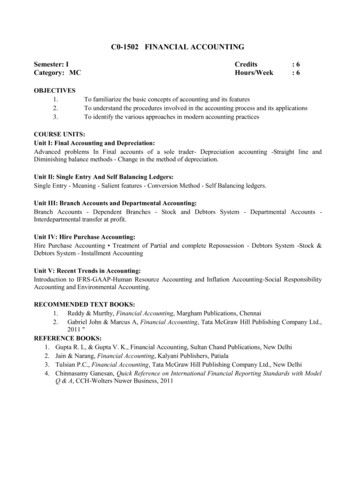
Using these variables, we estimate that JCOM’s organic rate actually declined in 2017 by2.2%, with the rest of the 27.9% reported growth coming from acquisitions. Our calculationof organic growth shows this figure to be declining from a recent high of 7.4% in 2011 to itscurrent value at –2.2% (see Chart 1, below). This trend, combined with the recent lack ofdisclosure regarding the firm’s proforma figures, lead us to believe that organic growth iscontinuing to deteriorate at JCOM within the first 9M of 2018.Chart 1: JCOM Reported Growth Vs. Estimated Organic 0.0%-5.0%2010201120122013Reported Revenue Growth2014201520162017Estimated Organic GrowthTo make things a little bit simpler, let’s only take a look at JCOM’s recent Everyday Healthacquisition that closed on 12/05/16. While this purchase was one of JCOM’s betteracquisitions in terms of future viability, we find that Everyday Health reported revenues ofapproximately 255.8 million in 2016. The target firm’s top-line growth rate also stood near10% YOY. Therefore, if we assume that Everyday Health could potentially report 281.4million4 in FY2017, we then can remove this figure from reported JCOM revenues of 1.12billion to get only 836.4 million in sales (versus 874.3 million revenues in FY2016). Notexactly the high growth company management is proclaiming JCOM to be.4 255.8 million x 110%9 Page
Return on Invested Capital Exhibits Noticeable Decline:GlassHouse Research’s standard measures of accruals are less reliable to identify quality-ofearnings risks at firms that have grown largely by acquisitions. For these firms, we believethat an analysis of EBIT margins, return on invested capital (ROIC) and return on netbusiness assets (RNBA) can help identify changes in a company’s quality of earnings riskprofile.In the Q3 2018 earnings call, CEO Vivek Shah also invites us to look at j2’s return oninvested capital. Although, the company calculates this as “free-cash-flow divided byinvested equity capital.” He then goes on to say that the firm’s ROIC metric has, “rangedbetween 33% and 50% over the past eight years.”First of all, the way management is calculating their ROIC metric is highly misleading andrarely used within the industry.5 If management is only using equity in the denominator tocalculate their internal metric, this would essentially nullify the over 1 billion in debt thefirm has accrued throughout the last seven years. Furthermore, the use of their alreadyadjusted/inflated FCF figure is laughable due to the 1) high volatility nature of free-cashflow and 2) the amount of cash spent on acquisitions being excluded from FCF.65Stated competitor Open Text (OTEX), discloses its ROIC calculation as “EBIT / (Debt Equity – Cash – DeferredTax).6From JCOM’s Q3 2018 Earnings Presentation Slides10 P a g e
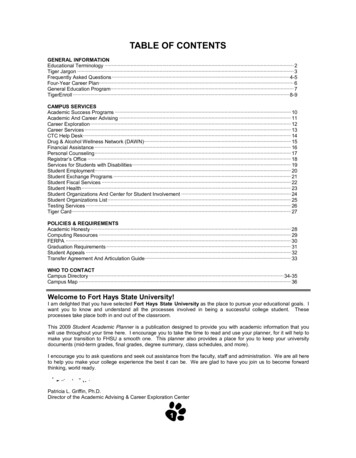
Chart 2: Analysis of Free-Cash-Flow( in millions) 400.0 300.0 200.0 100.0 20132014201520162017TTM (100.0) (200.0) (300.0) (400.0)FCF (CFOA - CapEx - Acquistions)FCF (CFOA - CapEx)Management Given FCFWithin a normal company that uses acquisitions sparingly, we could justify the use of freecash-flow without the impacts of acquisitions. However, the same train of thought cannot beused here with a serial acquirer such as j2 Global. Overall, we believe management may bemisleading when diverting analysts to calculate ROIC in their stated manner. As such, wewill provide the calculation in a variety of metrics. Therefore, our reader can come to theirown conclusions about the long-term sustainability of JCOM’s operating/acquiring model.In our calculations, we used EBIT in our numerator as our earnings proxy. Additionally, wecalculated our metrics using average assets, equity, invested capital (including both equityand debt) and net business assets. In each one of these cases, we observe a precipitous declinein each of these metrics, which contrasts sharply with management’s recent comments (seeChart 3, Page 12). Focusing in specifically on ROIC, where we include both debt and equityunlike j2 management, this metric has declined in a stair-step fashion every year since thecompany took on debt in 2011. And at the end of the fiscal year 2017, this metric decreased208 bps to 16.5%, again the lowest metric reported in the last five years (trailing average25.4%). Exacerbating the issue, this ratio now stands at a new low of 14.1% as of 09/30/18,11 P a g e
exhibiting to our team that the more acquisitions j2 brings on using debt, the less efficient itis becoming.Turning to one of Warren Buffet’s favorite metrics, return on net business assets (RNBA), wefind a similar result of declining profitability. Here we calculate j2 with a current RNBA of15.3%, down 205 bps from the prior year. Again, this is a fiscal-year low for the firm andstands well below the five-year trailing average of 22.6%. For the TTM, metrics are evenworse which stands at 12.8% as of 09/30/18.Chart 3. Return on Capital Metrics (Using EBIT as Earnings 12Return on Assets %20132014Return on Equtiy %20152016ROIC %2017TTMReturn on NBAs %In the latest earnings call, CFO Robert Turicchi discussed leverage and future acquisitions bystating the following:So we remain, I think, somewhat lightly levered, about a little over 2x total debtto trailing 12-month EBITDA So I think that we clearly have the capacity todo almost another turn of leverage. We've talked about maintaining 3x or under12 P a g e
total debt to EBITDA. So that gives us capacity for, call it, another 400-andsome million if necessary. And I think that given how we're structured, we've gotseveral pockets that if we needed to access that capital, we could put it.We can put certainly some of that downstairs at cloud. I think we know the ratestructure there very well, given the fact we have existing trading debt. And wehave historically had bank debt that would essentially is the cloud level, albeitnot in a while And what we really look at is not the marginal cost of capital, which is a fair wayto look at it, but what is our weighted average cost of capital. So that's beingbiased up by the equity. So our WACC is close to 10%. We want to earn a spreadover that WACC when we invest money, hence the roughly 20% returns that welook for in M&A.With a stated WACC of approximately 10%, we believe these declining metrics tell adifferent story from j2’s vociferous CEO and CFO. By going off his stated metric of ROIC(Adjusted FCF / Equity), we can see how analysts may believe things are going smoothly atthe firm. As detailed in the Chart above, we can observe the difference in our own calculatedmetrics. By using FCF that does not take into account acquisitions and only equity as thedenominator, we can see the contrasts between all the stated metrics.This leads us to believe that the recent myriad of acquisitions employed by j2 Global has, inPeter Lynch’s terms, “diworseified” the overall company. Even when faced with a selfreported higher WACC near 10%, j2 management plans to keep the acquisition trainchurning in order to keep the top line moving.13 P a g e
j2 Global’s Acquisition Accounting May Have Employed Springloading TacticsWith the plethora of acquisitions occurring at JCOM, we always remain suspect of serialacquirers who, through the use of business combination accounting rules, may use“springloading” in order to build future reserves. Thus, when analyzing JCOM’s full arsenalof acquisitions dating back to 2010, our analysts paid very close attention to certain liabilityaccounts that could hold augmented reserve accounts. This is in addition to the total amountof goodwill, which would be the offsetting plug. However, due to the fact that JCOMprovides very few disclosures regarding its acquisitions at the individual level, this makes itmuch harder for GHR to fully analyze these accounts with 100% precision. Although, byanalyzing j2’s Everyday Health (EVRY) purchase in late 2016 as well as j2’s acquisitionstaken in aggregate, we intend to demonstrate the magnitude of these accruals.Outsized level of liabilities recorded in Everyday Health acquisition: On 12/05/16, j2 Globalacquired Everyday Health (a former public company with the ticker: EVRY) for 493.7million in cash. According to JCOM’s 2016 10K, the company assumed 59.1 million inaccounts payables and accrued expenses (these two accounts are curiously not broken out).However, when looking at EVRY’s balance sheet in Q3 2016, we find that this line-item hada balance of only 45.1 million as of 09/30/16. Therefore, we find it peculiar that only twomonths later, this account was listed as 31% ( 14.0 million) higher when there doesn’t appearto be any seasonality or corresponding revenue growth to go with it.This is a material level of unexplained liabilities assumed relative to the size of EverydayHealth’s operations. Due to the fact that EVRY was generating TTM GAAP losses of 23.4million as of 09/30/16 (the last quarter the firm was public), we will use operating profits todemonstrate the materiality of our aforementioned figure. The unexplained amount ofacquired liabilities ( 14.0 million) was equivalent to 89.1% of TTM operating profit ( 15.7million) generated through 09/30/16. Because of the materiality of these unexplainedliabilities, we believe that j2 and Everyday Health may have built in, or springloaded,outsized reserves for future use at JCOM.Acquisitions of nonpublic companies portray similar traits: We find similar patterns ofunusually high liabilities recorded in connection with several acquisitions of j2’s acquirednonpublic firms. Because these companies were private before their respective acquisition,there is no way we can assess whether the acquired liabilities appear fairly-sized relative tothe size of the target company’s reported financials. Even still, when taken in aggregate forthe fiscal year, appear to be outsized and growing over time (see Chart 4, on Page 16).14 P a g e
Fiscal Year 2015: JCOM purchased Firstway, Nuvotera, EmailDirect, SugarSync,Popfax, Salesify, LiveVault, and Offers.com among other smaller companies for atotal of 314.0 million in 2015. The amalgamation of all these acquired companieslead to 172.6 million in purchased goodwill, 141.3 million in intangibles and 9.7million in accounts payables and accrued expenses (AP & AE). Thus, we observe thatthe AP & AE balance was only 3.1% of the total consideration; we can use this as abaseline of what we believe is normal for this account. Furthermore, soft assets(goodwill intangibles) made up 100.0% of the total amount spent in the year. Fiscal Year 2016: The company purchased VaultLogix, Callstream, Publicaster,STMP, Integrated Global Concepts, Fonebox and Everyday Health among othersmaller companies for a total of 596.1 million in 2016. The amalgamation of all theseacquired companies lead to 333.2 million in purchased goodwill, 252.9 million inintangibles and 62.2 million in AP & AE. Thus, we observe that the AP & AEbalance jumped up to 10.4% of the total purchase price spent, leading us to believeliability reserves could have been used by management. Moreover, soft assets made up98.3% of the total amount spent in the year. Fiscal Year 2017: Lastly, the company purchased sFax, Wecloud AB, MyPhoneFax,EZ Publishing StreamSend, Humble Bundle, BlackFriday.com, OnTargetJobs andMashable Inc., among other smaller companies, for a total of 203.9 million in 2017.The amalgamation of all these acquired companies lead to 121.8 million in purchasedgoodwill, 118.9 million in intangibles and 28.0 million in AP & AE. Thus, weobserve that the AP & AE balance again spiked higher to 13.7% of the totalconsideration; a trend that our analysts find troubling. Additionally, making a newfive-year high, soft assets made up 118.1% of the total amount spent in the year.15 P a g e
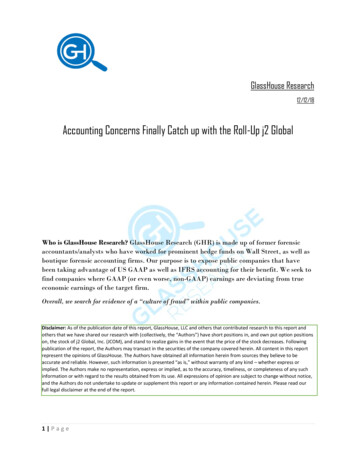
Chart 4: Soft Assets and Liabilities Acquired Relative to Total .0%201320142015Soft Assets20162017AP AEWhat the prior data distinctly shows us is that JCOM is allocating more and more dollarsspent on purchases to acquired AP & AE, according to j2’s 10K. The contra-asset to theseliabilities lies within goodwill, which we see increasing heavily as well over the last five years.This leads us to believe that management could be building robust reserves throughacquisitions, only to release them later to create artificially inflated margins.Soft Assets for JCOM are highly outsized relative to peers: Furthering our analysis on goodwilland intangible assets, let us look at these two accounts as a whole on JCOM’s balance sheet.We would expect these two figures to continue to grow over time as 1) JCOM is a serialacquirer and 2) JCOM is in an industry where soft assets are prevalent over hard assets suchas inventory or PP&E. However, based on our analysis of JCOM’s balance sheet and softassets relative to peers, we believe that JCOM remains at risk for heightened impairment16 P a g e
charges in the future. This is especially true after analyzin
services under the eFax, sFax, MyFax, eFax Plus, eFax Pro, eFax Secure, eFax Corporate, and eFax Developer names; on-demand voice and unified communications services under the eVoice and Onebox names; online backup and disaster recovery solutions under the KeepItSafe, LiveDrive, LiveVault, and SugarSync names; email security, encryption, .