Transcription
Do Socioeconomic Factors Affectthe Volume and Compositionof Catch Basin Debris?Team Trash TalkersYingying Cai, Ching Yan Chan, Andrew Duncan,Josue Gonzalez, Tina Hoang, Brianna Lawrence, Sheryl ParsonsAdvisor: Rebecca ShipeWritten for:Heal the BayCity of Los Angeles Watershed Protection DivisionJune 2012Environmental Science Senior PracticumUCLA Institute of the Environment and Sustainability
Table of Discussion16Conclusion18Literature Cited19Appendices211
AbstractStormwater runoff is the leading cause of water pollution in coastal watersheds. Toensure stormwater quality, Los Angeles retrofitted over 22,000 catch basins with screens toprevent trash from entering the storm drain system. Since commercial zones have the higheststormwater pollution generation rates, we investigated the variation in volume and compositionof catch basin debris according to three socioeconomic factors (ethnicity, population density, andincome), which were broken down into further subcategories. Using U.S. Census data (providedby WPD), we selected a total of ten survey sites, one for each subcategory, in commercial zoneswithin the Los Angeles River Watershed. We calculated debris volume from a database of catchbasin cleaning history (2008-2011) provided by the City of Los Angeles Bureau of SanitationWPD and WCSD and measured composition by taking samples from catch basins with circlegrate screens. We also considered the relationship between trash can availability and debrisaccumulation in catch basins.The only statistically significant findings occurred between the Black and Asianpopulations and the Hispanic and Asian populations. Areas varying in income and populationdensity did not show significant differences in catch basin volumes over the three-year timeperiod. Trash can frequency in areas of different incomes showed a negative correlation withaverage debris volume, while trash can frequency in areas of different population densitiesshowed a positive correlation. Our preliminary study of composition indicated that organicmatter was the main component in all sampled catch basins with slight observable differencesbetween variables.IntroductionIn Los Angeles, rain comes as a mixed blessing. While replenishing water supplies, rainbounces off cement, sloshing across the urban landscape, collecting trash, toxins, and bacteria asit slips into the storm drain system. Los Angeles’s storm drain system delivers urban runoff, aconcoction of various pollutants, directly into the ocean where it degrades beach quality andendangers marine life (Gregory, 2009; Santos et al., 2005). As the leading cause of pollution incoastal watersheds, non-point source urban runoff demands vigorous mitigation efforts (Lau etal., 2001).Under the Clean Water Act, states must establish Total Maximum Daily Loads (TMDLs),outlining the maximum amount of pollutants a waterbody may receive while still available for all2
of its designated uses such as swimming or fishing. Originally adopted in 2001, the Los AngelesRiver Trash TMDL requires Southern California cities to reduce their trash discharge towaterbodies by 10% each year for 10 years, ultimately attaining 0% trash discharge by 2015 (LAStormwater Program, 2001). According to the Water Quality Control Plan, Los Angeles regionalwaters “should not contain floating materials [.or] suspended or settled material inconcentrations that cause nuisance or adversely affect beneficial use” (CRWQCB, 2010). Thenewly implemented Trash TMDL sparked political feuds as the city struggled to quantify andreduce trash discharge. Grappling with noncompliance, the Regional Water Quality ControlBoard amended the Trash TMDL in 2008, changing compliance requirements from a numericalto a technological limit. To meet the revised Trash TMDL, Los Angeles only needs to implement“Best Management Practices” (BMPs) for stormwater control, relying solely on technologicalefficiency.Choosing from a broad range of BMPs, Los Angeles determined that retrofitting catchbasins proved the most feasible and cost-effective. As the access point for urban runoff into thestorm drain system, a catch basin consists of a depression beneath a drain inlet, allowingsediment to accumulate naturally (Pitt and Field, 2004). Modifying catch basins to capture trash,Los Angeles installed coverings on catch basin openings and inserts in catch basin outlets. As of2008, Los Angeles has spent more than 39 million in retrofitting catch basins and intends toretrofit all catch basins throughout Los Angeles (LA Stormwater Program, 2001). While thecatch basin retrofits fulfill the requirements for Los Angeles’s Trash TMDL, trash runoff stillpervades the Los Angeles River during and after storm events.Urbanization increases the percentage of impermeable surface thereby causing anincrease in transportation of polluted stormwater (Ha and Stenstrom, 2003). Furthermore, inheavily populated coastal areas such as Los Angeles beach attendees contribute a significantamount to the marine plastic pollution problem. For example, in Los Angeles County between1973 and 1983 beachgoers doubled to 79 million and are reported to contribute about 75 tons oftrash per week (Pruter, 1987). The pattern of high litter load in population dense areas is evidentagain from a study by the Watershed Protection Division in Los Angeles. Citywide, residentialand commercial areas have the highest percentages of litter-filled catch basins (WPD, 2002).Litter in downtown Los Angeles and adjacent areas pose a severe problem in particular. Eventhough this is not a densely populated area, it serves as a major corridor and destination for manytravels, either on foot or in a vehicle.3
The volume and composition of litter in urban runoff is not uniform across all parts ofLos Angeles; areas of different socioeconomic status in regards to population density, ethnicity,and income may be affected differently during storm events (Lippner et al., 2001). Fearingpolitical implications, very few researchers dare examine the relationship between ethnicity andlitter generation. In general, the literature insinuates that minorities suffer the highest risk forenvironmental health, accumulating higher amounts of waste in their neighborhoods (with theconfounding factor of low income) (Ackerman and Mirza, 2001). Assessing environmentalawareness, Flynn et al. (2006) surveyed different racial groups and found that non-whiteparticipants expressed greater environmental concern for their communities than whiteparticipants, highlighting their political inability to achieve environmental justice.Various studies insinuate a relationship between income and litter generation, but theyrarely directly address it. Characterizing litter generation according to beach users, Santos et al.(2005) determined that areas occupied by people of lower annual income generate twice as muchlitter as areas occupied by people of higher annual income. Marais et al. (2002) examined stormdrain catchments in South Africa, finding an inverse relationship between income and litterloadings in residential areas. The researchers offer an explanation, suggesting that the lowincome communities consist of informal housing and lack a reliable waste removal program. Thestudies suggest that income influences littering patterns by affecting behavior or theinfrastructural ability to properly dispose of trash.A study by the Department of Public Works labeled public education as a BestManagement Practice as it “can be effective at preventing trash from getting into the storm drainsystem [and] can be targeted at problem populations or areas” (LADWP 2004). Studies havedescribed the urban litter problem as behaviorally induced and because of this, education isindeed an effective “non-structural” best management practice; LADWP describes it as acomponent of its “second-best source control BMP’s (Taylor et al., 2006).” In the study byAndre Taylor et al. (2006), it was found that an eight month education campaign done in highlypopulated Australian commercial areas was “modestly successful” at “reducing litter loads” ontothe streets and “modestly successful” at changing the consumers’ behaviors (Taylor et al., 2006).Perhaps because of its short eight month period of duration, this education campaign was only“modestly successful.” Conducting a study over a longer period of time may display differentlittering behavior results; adding anti-littering into school curriculum could test this.4
Using data provided by the Watershed Protection Division (WPD) and Waste WaterSystem Division (WCSD) of the City of Los Angeles Bureau of Sanitation, our project aims todetermine the relationship between socioeconomic factors and catch basin debris volume in theLos Angeles River Watershed. Our hypothesis is that areas of lower socioeconomic status (i.e.,low income, high percentage of people of color, and high population density) will have higherdebris volumes in catch basins compared to areas of higher socioeconomic status. We will alsoexamine the composition of debris within catch basins in these areas to determine ifsocioeconomic factors influence composition. This analysis may reveal the effectiveness of catchbasins as a best management practice for ensuring stormwater quality.MethodologySite SelectionTo select the catch basins for our study, we limited ourselves to sites within the municipalboundaries of Los Angeles, the Los Angeles River Watershed, and commercial areas. Weobtained 2000 Census demographic data from WPD and used ArcGIS to see the spatialdistribution of income, ethnicity, and total population in census blocks within our outlinedboundaries. In ArcGIS, we divided our socioeconomic factors into classification schemes. Forincome, we divided the income range of Los Angeles into tertiles of low income ( 0 - 29,449),medium income ( 29,450 - 54,421), and high income ( 54,422 ). For population density, wedivided the total population of the census block by its area to obtain population density in unitsof number of people per square kilometers. Taking the range of population density for all thecensus blocks within Los Angeles, we divided population density into tertiles of low density (0 4,132 people/km2), medium density (4,133 - 8,999 people/km2), and high density (9000 people/km2). For ethnicity, we selected Asians, Blacks, Hispanics, and Whites as our ethnicgroups of interest. Looking at the number of people of each race per census block, we split therange of each race into four quartiles: the Asian population was classified according to 0-323,324-869, 870-2100, and 2101-4659 Asians per census blocks; the Black population wasclassified according to 0-479, 480-1309 1310-2396, and 2397-4926 Blacks per census blocks;the Hispanic population was classified according to 0-1040, 1041-2276, 2277-3594, and 35959021 Hispanics per census block, and the White population was classified according to 0-1294,1295-2388, 2389-3665, and 3666-6509 Whites per census block. We defined the fourth quartileas the highest concentration of that ethnic group. In ArcGIS, we overlaid our socioeconomic5
factors on a map. From our choices of blocks, we selected a street and used Google Maps toensure our potential sites had the same standard of commercialization. We selected the followingsites for our variables:Income:1. Low Income: 7th Street between Hill Street and Wall Street2. Medium Income: Eagle Rock Boulevard between Colorado Boulevard and RidgeviewAvenue3. High Income: Olympic Boulevard between Hill Street and Wall StreetPopulation Density:4. Low Density: Ventura Boulevard between Encino Avenue and Hayvenhurst Avenue5. Medium Density: Cesar E. Chavez Avenue between Alameda Street and Figueroa Street6. High Density: Cesar E. Chavez Avenue between Evergreen Avenue and St. Louis StreetEthnicity:7. Asian: Broadway Street between Cesar E. Chavez Avenue and Bamboo Lane8. Black: Broadway Street between 3rd Street and 8th Street9. Hispanic: Figueroa Street between North Avenue 52 and South Avenue 6010. White: Ventura Boulevard between Woodman Avenue and Sepulveda BoulevardIn selecting blocks, we only considered one factor and did not control for others i.e. when weselected a block for low income, we did not consider the population density or racial compositionof that block. In essence, we executed our site selections as three separate experiments forsocioeconomic factors of income, population density, and ethnicity. Due to time constraints, wecould not survey for all variable combinations, rendering our project unsuitable for multivariateanalysis.Field SurveyDuring our field surveys, we measured the width, depth, and length of all the catch basinsin our selected sites. From our measurements, we calculated the volume capacity for each catchbasin. We recorded the location of each catch basin and the type of grate covering (circle,diamond, bar, or none). We also recorded the number and location of public trash cans, and6
performed a correlation analysis between the number of trash cans per kilometer and the debrisvolume.Catch Basin Cleaning HistoryAfter selecting our catch basins, we located the catch basin ID in a database provided bythe WPD and WCSD (see Table 1.1). This database contains catch basin cleaning histories from2008 to 2011, stating the predominate type of debris and the extent to which the basin was filled(full, ¾ full, ½ full, ¼ full or clear) at the time of the catch basin cleaning. With the cleaninghistories for our selected catch basins, we calculated the volume of debris in the basin for eachrecorded cleaning. Accounting for the high variability of debris in the basins for each cleaning,we averaged the total debris volume for each catch basin. We then added the average debrisvolume for all the basins within a study site and divided it by the number of catch basins in thesite to obtain average debris volume per catch basin for each study site. For each socioeconomicfactor, we used an analysis of variance (ANOVA) to determine if average debris volume differedaccording to our variables (see Table 1.2).Catch Basin Selection for Composition SamplingFor the composition portion of our project, we narrowed our sample size down by onlylooking at the catch basins that have the most prevalent type of covering grate, the circle grate, toensure uniformity in what debris may penetrate the covering. Within each socioeconomic factor,we selected catch basins with similar volume capacities to further ensure uniformity.CompositionThe composition component of the project involved taking one sample from each site. Asa result, our data only reflects a snapshot of catch basin composition at a single point in time.Without multiple samplings to compare, we could not perform statistical tests for compositionand instead, relied solely on observation.We collected ten catch basin samples, one from each site. The specific catch basins arehighlighted in Table 1.1. Using shovels, sanitation workers from the City of Los Angelesmanually scooped out the contents of our chosen basins and bagged them. If the catch basincontained too much debris to fit in one bag, we were given only a portion of the content. Ifpossible, we were given everything within the catch basin. Debris was compared in units of7
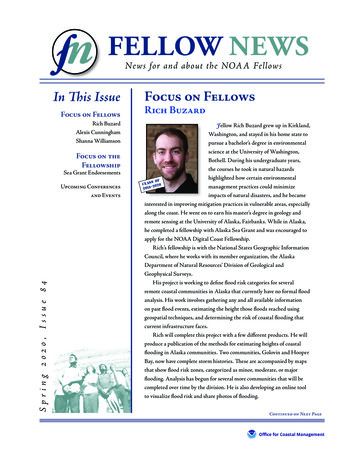
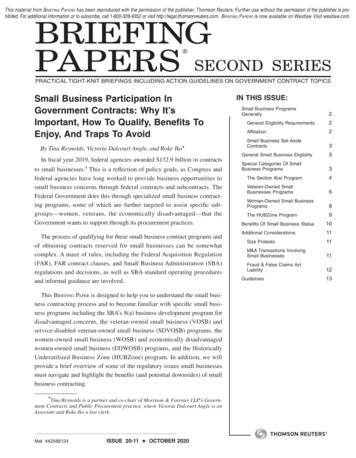
percent weight. The catch basin at the low-income study site was blocked by debris and filledwith water. As a result, the samples obtained from this site were wet and had to be hand-dried inthe lab. For each sample, we separated and weighed the contents according to the classificationcategories in Table 1.3 (below).TABLE 1.3: SORTING CATEGORIESPaperCigarette llaneousPaperPlasticStyrofoamMetalSingle foamMiscellaneous sCatch Basin Debris VolumesWithin the same study site, high variation of averaged debris volumes existed for eachcatch basin, as shown in the appendix in Graphs 1.1-1.3 for our income sites, Graphs 1.5-1.7 forour population density sites, and Graphs 1.9-1.12 for our ethnic sites. We compared the debrisvolumes according to our factors, as shown in Graph 1.4 for ethnicity, Graph 1.8 for populationdensity, and Graph 1.13 for income. We found statistically significant differences between theaverage debris volumes of catch basins with respect to ethnicity (ANOVA; P 0.0005). Furthert-tests revealed statistical differences between the average debris volume for Asian and Blackpopulations and Asian and Hispanic populations, but not between any other ethnicity groups. Nostatistical difference was found between the average debris volumes of populations of people ofcolor and White populations. No statistical difference was found between the average debrisvolumes of high, medium and low income areas (p 0.71). Similarly, no statistical difference wasfound between the average debris volumes of high, medium and low population density areas(p 0.50). For ANOVA analyses and t-tests, see Table 1.4-1.5.8
GRAPH 1.4: DEBRIS VOLUME PER CATCH BASIN IN ALL ETHNICITY (m3)10.50AsiansBlacksHispanicsWhitesGRAPH 1.8: DEBRIS VOLUME PER CATCH BASIN IN ALL POPULATION DENSITYAREAS .8Basin(m3)0.60.40.20.0LowPDMediumPDHighPDGRAPH 1.13: DEBRIS VOLUME PER CATCH BASIN IN ALL INCOME AREAS 210.80.60.40.20LowIncomeMediumIncomeHighIncome9
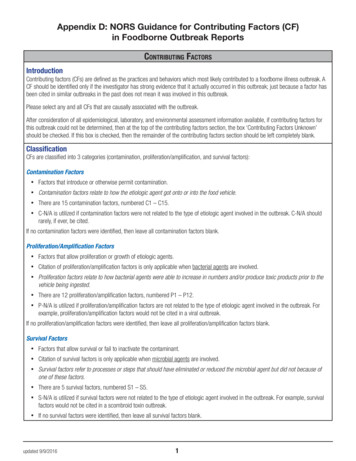
To explain the differences between debris volumes, we examined trash can availability inthe sites. Interestingly, the number of trash cans per km is lowest in the medium income area,with more trash cans in the high income area, and the most in the low income area. Still, therewas a strong negative correlation between the number of trash cans and the average debrisvolume between incomes (r2 0.93), as shown in Graph 1.17a. When looking at populationdensity, the number of trash cans per km is lowest in the medium population density area, withmore trash cans in the low density area and the most in the high density area. There is a strongpositive correlation between the number of trash cans and the average debris volume between thepopulation density sites (r2 0.83), as shown in Graph 1.17a. A correlation analysis between thenumber of trash cans and the average debris volume of each ethnicity site revealed a very weakcorrelation (r2 0.09), as shown in Graph 1.17b.GRAPH 1.17: CORRELATION BETWEEN DEBRIS VOLUME PER CATCH BASINAND TRASH CANS AMOUNTa) IncomeandPopulationDensityAreas60502 kmH20R2 0.8310MLM000.20.40.60.811.21.4DebrisVolume(m3)10
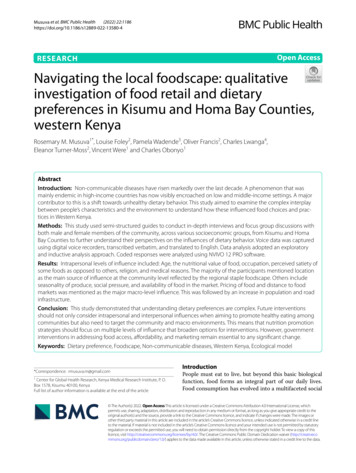
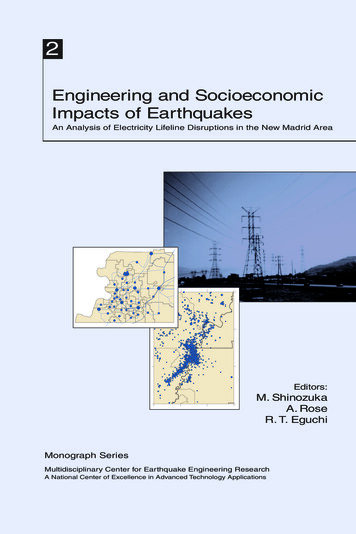
b) EthnicityAreas60R2 positionOnly slight observable differences were found among the composition percentages withinincome and population density. The ethnicity sample sites had varying percentages of organicmatter. Within this socioeconomic factor, the percentage of organic matter differed between49.3% in the White population (Graph 2.12) to 87.4% in the Hispanic population (Graph 2.9).The Black and Asian areas had similar organic matter contributions of 57.0% and 64.4%,respectively (Graph 2.10, 2.11).GRAPH 2.9: HISPANIC ETHNICITY CATCH BASIN lothPaperMetalGlassMiscellaneousHispanics% by WeightOrganic neous87.36%2.58%0.48%0.01%7.59%1.98%0.00%0.00%11
GRAPH 2.10: ASIAN ETHNICITY CATCH BASIN lothPaperMetalGlassMiscellaneousAsians% by WeightOrganic PH 2.11: BLACK ETHNICITY CATCH BASIN lothPaperMetalGlassMiscellaneousBlacks% by WeightOrganic talGlass1.40%27.25%2.61%1.49%Miscellaneous0.79%12
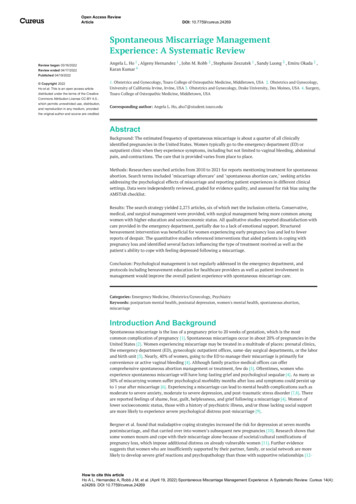
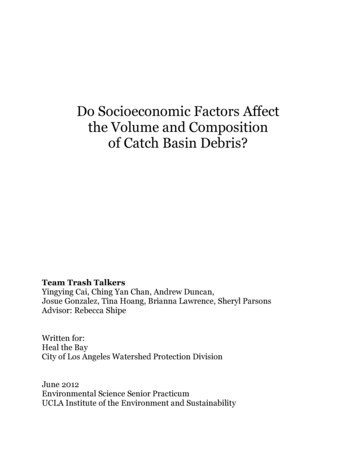
GRAPH 2.12: WHITE ETHNICITY CATCH BASIN lothPaperMetalGlassMiscellaneousWhites% by WeightOrganic neous49.29%21.88%1.13%0.97%25.59%1.03%0.10%0.00%As no major differences were found between socioeconomic factors, the compositiontotals were taken as a whole for all of our study sites. The overwhelming majority among oursamples proved to be organic matter, making up 76.7% of the weight of our samples on average.For all sites combined, organic matter made up 96.6% of the total weight (see Graph 2.1).GRAPH 2.1: ALL SITES COMPOSITION BREAKDOWN (WITH ORGANIC GlassOrganicAll Sites - With OrganicPaperPlasticClothPercentage by Weight1.52%1.49%0.22%13
.04%0.04%96.39%For further analysis of the more clearly anthropogenic pollution sources, we removedorganic matter from the composition totals. With organic matter removed, paper products madeup the majority of the composition (42.1%), followed closely by plastic (41.3%) (see Graph 2.2).GRAPH 2.2 ALL SITES COMPOSITION BREAKDOWN (WITHOUT laneousGlassAll Sites - Without sGlassPercentage by Weight42.1%41.3%6.07%5.57%2.80%1.11%1.02%The most prevalent subcategory of paper was miscellaneous paper, comprised of smallunidentifiable pieces of paper or paper that could not be sorted into one of the othersubcategories. These pieces constituted 25.4% of the total weight and 60.3% of the total paper(see Graph 2.20 below). Cigarette butts made up the second most prevalent subcategorycomprising 10.2% of the total weight and 24.3% of the total paper weight, despite their smallsize.14
GRAPH 2.20: PAPER SUBCATEGORY PERCENTAGE IN ALL eight24698.938.119.66111014The most prevalent subcategory of plastic was miscellaneous plastic. These piecesconstituted 14.3% of the total weight and 34.7% of the total plastic (see Graph 2.21 below). Foodand liquid containers were the second most prevalent subcategory comprising 11.1% of the totalweight and 26.9% of total plastic weight. Single-use bags constituted only 8.99% of the totalweight and 21.8% of the total plastic.GRAPH 2.21: PLASTIC SUBCATEGORY PERCENTAGE IN ALL MiscellaneousPlas3c15
VariableWrappersSingle Use 95DiscussionCatch basin debris volumes varied substantially within the same site, paralleling theCaltrans pilot study on litter management. For two years, Caltrans evaluated litter in catch basinsand observed variability in litter type and amount in the same collection sites and betweencollection sites (Lippner et al., 2001).The socioeconomic factor of ethnicity did affect catch basin debris as seen in thedifferences between the Asian and Black populations and the Asian and Hispanic populations.However, income and population density did not appear to influence catch basin debris. This isin contrast to other studies, which showed that high population densities increased litter amounts(Pruter, 1987; WPD, 2002). Similarly, areas of lower income were reported as generating twiceas much litter than higher income areas (Santos et al, 2005). Our project assumes that litter is thesource of catch basin debris and that higher litter production will result in more catch basindebris.The ethnicity sites for Asian, Black, and Hispanic populations differed by numerousfactors, including type of commercial buildings. The Asian site was located in Chinatown, aprominent tourist attraction noted for its proliferation of inexpensive imports. The stretch weselected for the Asian site mainly consisted of shops and restaurants. Chinatown receives a largenumber of visitors who may litter, accounting for the Asian site’s large volume of catch basindebris. The Black site was located in Downtown Broadway Theater District, which consists ofhistoric theaters and shops. The reduced debris in the Black site, compared to the Asian site, maybe due to municipal attention given to the Black site in order to preserve the historic integrity ofthe Theater District. Our Black site also crosses into the Jewelry District. Compared to stores thatprovide waste materials such as food containers or plastic bags, jewelry stores may produce lesswaste and littering potential. The Hispanic site was located in Highland Park, which is lesscommercialized than the Asian site. Residential houses could be seen a block over from ourselected street. The Hispanic site consisted mainly of one-story shops, but we did encounter achurch and school. The degree of commercialization may have accounted for the differencesbetween the Asian site and Hispanic site.16
We then looked at trash can availability to explain differences in debris volume. Thecorrelation analyses between the number of trash cans and debris volume within a site showedopposing trends. For income, debris volume was negatively correlated with trash can amountwhile for population density, debris volume was positively correlated with trash can amount. Theincome correlation can be explained by the concept that more trash cans will result in less litterand thus less debris in the catch basins. The population density correlation can be explained bythe concept that providing more trash cans may encourage increased trash generation and thus,more litter. For ethnicity, there was no correlation between debris volume and trash can amount,showing that trash can availability did not influence debris volume. However, it is interesting tonote that the Asian, Black, and Hispanic sites had similar numbers of trash cans: 45 trashcans/km, 39 trash cans/km, and 49 trash cans/km, respectively. Confounding factors such asstreet sweeping frequency, volume of foot traffic, and trash pickup frequency may also exist,affecting the validity of the correlation trends.Our composition results revealed that organic matter dominated catch basin debris (byweight) for all sites.Previous studies also identified suspended sediment as the largestconstituent of runoff (James, 2002).Although natural in source, this debris could beproblematic. Consisting of decaying leaves, soil, sediment, and suspended sediment, organicmatter absorbs nonpolar chemicals and transports them into the stormwater system during rainevents. Over 50% of toxic chemicals in stormwater are adhered to suspended sediment,signifying the need for sediment control as a means to reduce metal runoff (Lau et al. 2001).After organic matter, paper and plastic were the next most dominant contributors to catchbasin debris. Since the most prevalent subcategory for both paper and plastic were miscellaneousand unidentifiable, we suggest further research with a more precise classification system that isable to identify the pieces that we could not.Our composition analysis also showed that items larger than the openings (1.9 cmdiameter) in the circle grate coverings are getting into the catch basins. This problem may resultfrom the design of the covering, which is engineered to swing inward at the bottom edge whendebris builds up outside of it to prevent flooding on the streets during a storm event. Streetcleaning frequency may also be related to this issue; if sweeping is not frequent enough, anddebris builds up outside of the grate, the grate will cave in, allowing large debris to fall inside.Finally, the openings are large enough for cigarette butts to easily flow through. The toxins17
present in cigarette butts are disproportional to their small size and have large harmful effects onaquatic life (Novotny et al., 2009).ConclusionVery little is known about the quantity and characterization of litter in the storm drainsystem (Marais et al. 2001). Our study attempted to clarify the ambiguous nature of this debrisand contribute to the current, yet scarce, literature. We analyzed catch basin debris – the streetmaterial that is swept into catch basins and theoretically can enter the storm system – accordingto socioeconomic factors of income, population density, and ethnicity. We hypothesized thatareas of low income, high population density, and people of color will have higher quantities oftrash within their catch basins. Our results yielded no statistical significance between income andpopulation density levels. Only the ethnic groups: Asians versus Blacks and Asians versusHispanics were statistically different in catch basin content volume. Interestingly, catch basindebris volume increased with number of trash cans when grouped by population density anddecreased with number of trash cans when grouped by income. Analyzing composition byweight, we found that organic matter dominated catch basins, with paper and plastic products asthe second most prevalent constituents.Due to our study’s limitations, we recommend further research of catch basin content inorder to identify (and potentially control) the highest polluting areas and trash type. Furtherresearch should focus on the potentially confounding factors identified in our discussion, such asthe effects of other socioeconomic factors, street cleaning frequency, and foot traffic. Furtherstudies may also look into the variation between catch basin content and volume in noncommercial areas, such as areas z
2008, Los Angeles has spent more than 39 million in retrofitting catch basins and intends to retrofit all catch basins throughout Los Angeles (LA Stormwater Program, 2001). While the catch basin retrofits fulfill the requirements for Los Angeles's Trash TMDL, trash runoff still pervades the Los Angeles River during and after storm events.