Transcription
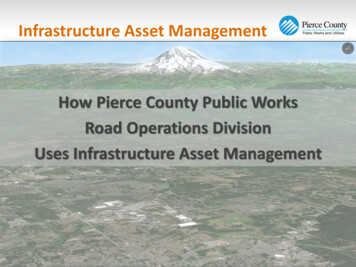
Infrastructure Asset ManagementHow Pierce County Public WorksRoad Operations DivisionUses Infrastructure Asset Management1
Pierce County Public WorksRoad Operations Division 29.5M Annual Budget 164FTEs 24Seasonal Employees 3Facilities 10 Active Pit Sites (no active mining) 210 Vehicles and Equipment 3,150Lane Miles 22,200 Catch Basins 550 Miles of Pipe2
Why Do Asset Management Now?3
Current Example using Technology4
Save Money and Improve EffectivenessPavement Expenditures(adjusted for actual inflation) 9,300,000.00 9,100,000.00 8,900,000.00 8,700,000.00 8,500,000.00 8,300,000.00 8,100,000.00 e 12012201320145
Pierce County Road Operations Work Flow ChartHouses Asset Data Including:- Asset Definitions- Asset LOS goals- Asset service history - Asset cost history- Asset inventories- Asset conditionPerformanceReportingKPI’sKey PerformanceIndicatorsCost Accounting Data & ReportingSupports: DOLFIN; DCIS; City Billing; FASTERLevel-Of-Service GoalsPlanned vs. ActualRMSRoad MaintenanceManagement SystemCMMSComputerizedMaintenanceManagement SystemAllLEM & Production DataConditionAsset Condition Inspection DataWorkThrough-putWork ExecutedIn-FieldInspections ExecutedIn-FieldDelivery OfEssential ServicesLegendHouses Labor, Equip & Material Data Including:- LEM Inventories- LEM unit costs- Task Standards- Production Standards- Planned Production - Actual Production- Planned Costs- Actual Costs- Employee Time- Employee DataLeaveRequest SystemEmployee InfoEmployeeResourcesSchedulingSystemWeekly/Daily WorkSchedulesCore SystemSupply InfoSupplyInventory SystemTool & MaterialResourcesCore ProcessSupport SystemRequest ForAction SystemEquipmentPM SystemCustomer Serviceand/or Urgent NeedsEquipmentResourcesCore Output6Support Activity
Pierce County’s 8 Elements of Assessment ManagementLarge initial investmentAvailable InformationField and office resource activityWork must integrate throughhardware/software Elementsof AssetManagementReplacementModelCostDataProcedures, metrics,business rules housedin your manuals andCMMS systemPrimarily ADT, population infoPayrolland/or costaccountingsystem
Asset Condition Rating Scale per Function StandardDefect SeverityA 0 - 3 None to lowB 4 - 6 ModerateC 7 - 9 HighWork OrderPrioritizationNo Work NecessaryNo or tolerable defects;, nowork warranted at this timeWork Order CreatedLow to moderate priority;should be completed ascompeting priorities allowDefect Extent1,4,7 Single or Isolated ( 10%)2,5,8 Several or Sporadic (10-50%)3,6,9 Predominant (50-100%)PerformanceMeasuresProvide understanding ofasset condition in terms easilyunderstood by the public: Very GoodCondition Good ConditionWork Order CreatedModerate to high priority;should be completed as soon aspracticable. Condition mayaffect another asset. Fair Condition Poor ConditionUrgent Work &EmergenciesEmergencies are responded toimmediately; emergency workorders are not created as part ofan assessment rating process8
Condition Assessment Tools4.Receive Real-Time Updates1.Take data from GIS3.Edit Asset andInspection Data2.Data Becomes Discoverablein iOS Application9
Condition Assessment Tools – Assessment Dashboard10
Asset Management Save MoneyCatch Basin Asset Management 2003 – 2009: Catch Basin Cleaning - 70.17 2010: Catch Basin Cleaning and Inspection - 119.00 2011: Catch Basin Cleaning and Inspection - 97.65 2012: Catch Basin Cleaning and Inspection - 70.34 2013: Catch Basin Cleaning and Inspection - 58.442010 to 2013 we saw a 24% drop in overall costfor the inspection and cleaning of ourstormwater drainage infrastructure11
The ChallengesLeading Change Cultural anchors Loyalty to legacy systems Perceptions of criticism Localized compare/contrast reactions Learning to trust the instrumentation spatial disorientation reference Preserving trust between management and staff Reward and rally the early adopters Celebrate the short term wins Be patient12
Questions?Bruce WagnerPierce County Public WorksRoad Operations Managerbwagner@co.pierce.wa.us 253-798-6051Bryan ChappellPierce County Public WorksWater Quality Supervisor13bchappe@co.pierce.wa.us
Asset Management Save Money 11 Catch Basin Asset Management 2003 -2009: Catch Basin Cleaning - 70.17 2010: Catch Basin Cleaning and Inspection - 119.00 2011: Catch Basin Cleaning and Inspection - 97.65 2012: Catch Basin Cleaning and Inspection - 70.34 2013: Catch Basin Cleaning and Inspection - 58.44