Transcription
FLOW CYTOMETRY RESOURCE GUIDE
ABOUT POLYSCIENCES INC.Polysciences, Inc. is a world leader in the development of particle-based solutionsfor diagnostics, bioprocessing and instrument standardization. Our capabilities in lifesciences, coupled with our expertise in specialty chemicals and electronics, allow us toaddress the unique requirements of advanced applications in medical devices, biosensorsand nanotechnology. We are your source for organic, inorganic, biodegradable, magnetic,fluorescent, dyed and specific antibody and general protein coated particles.CORPORATE LOCATIONSOur U.S. corporate headquarters and main manufacturing facilities are situatedon 7 acres with 50,000 square feet of space located about 20 miles north ofPhiladelphia, as well as corporate locations around the world. We are ready tomeet your global needs.Polysciences, Inc.400 Valley RoadWarrington, PA 18976info@polysciences.comPolysciences Europe GmbHBadener Str. 1369493 Hirschberg an der Bergstrasse, Germanyinfo@polysciences.dePolysciences Asia Pacific, Inc.2F-1, 207 DunHua N. Rd.10595 Taipei TAIWANinfo@polysciences.twBangs Laboratories, Inc. (wholly owned subsidiary of Polysciences, Inc)9025 Technology DriveFishers, IN 46038-2886info@bangslabs.comISO CERTIFICATIONSPolysciences has been certified by American Management Technology, Inc. as havingdemonstrated that our Quality Management System complies with the requirementsof both ISO 9001:2008 and ISO 13485:2003 for the manufacture, processing, anddistribution of microspheres and related products.
www.Polysciences.com1
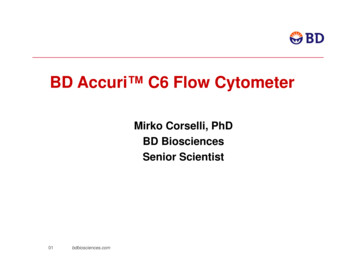
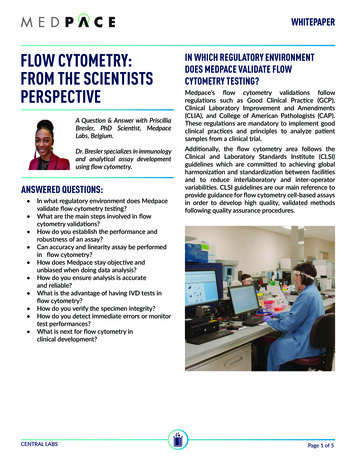
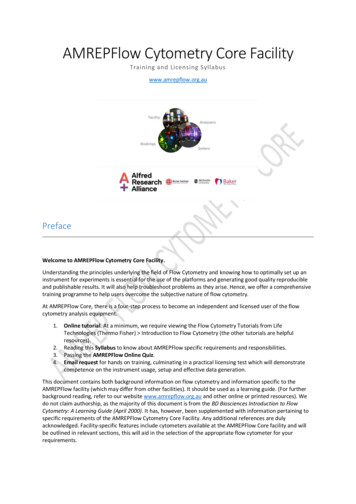
INTRODUCTIONFlow cytometry is a complex but highly informative technology that permitsevaluation of cells, subcellular compartments / organelles and microparticles.The instruments that make theseanalyses possible house a complexarchitecture of lasers, detectorsand fluidics that work in concert toprovide detailed information aboutthe samples that are analyzed.Information regarding every particlethat passes the flow cell is collected,including relative size (forwardscatter - FSC), internal complexity(side scatter - SSC) and fluorescence.Instruments are often equipped with2 or more lasers and 2 detectorsper laser, much like the configurationdescribed in Table 1.Sheath er BeamFigure 1: Alignment of particles with laser beam in the flow cell.Bandpassfilter488/10575/26PE-TR595 LP610/20PerCP-Cy 5.5685 LP695/40PE - CY 5655 LP660/20PE - CY 7735 LP780/60APC-660/20APC - CY 7735 LP780/60Table 1: Sample configuration for a BD LSRII cytometer, includingviolet (405nm) laser / detector add-on.685LP595LPLP505530/30550 LPFITC0/3053633(20mW)505 LPPEPE-Texa610 s Re/20d488 5/50PE450/50505 LP575-VIO 5255VIO 450573405nm(50mW)m8n m48 r beaseLaDetectorPE-Cy5760/206-CyPE 0/60655LP78LPDichoricmirrorLaserFigure 2: Concept of 488nm optical array1. Shapiro HM. (2003) Practical Flow Cytometry, Fourth Edition. John Wiley & Sons: Hoboken. (ISBN:0-471-41125-6)2Polysciences Flow Cytometry Resource Guide
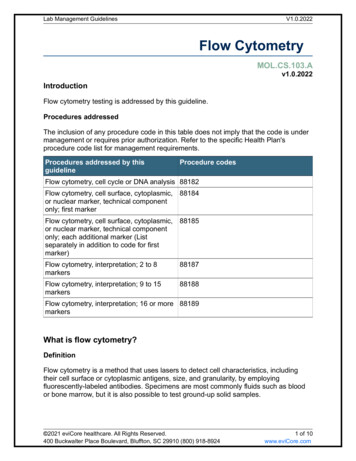
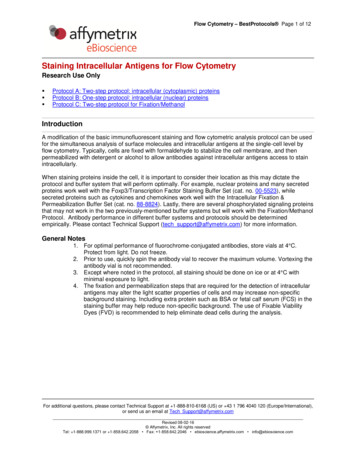
Data may be displayed in single- or multiparametric format with associated statistics,per the typical dual parameter dot plot (FSC / SSC) and single parameter fluorescencehistogram in Figure 3.Figure 3:3b. Fluorescence (FITC) histogram of singlets from the FSC/SSC gateshown in 3a.3a. FSC / SSC dot plot with gated singlets populationand associated statistics:P2Population%ParentFSC-A MedianFSC-A CVSSC-A MedianSSC-A CVPopulationFITC-A MedianFITC-A CVP186.0134,8295.543,4364.4P252,17814.5Though unstained cells will yield characteristic scatter patterns that can be readilyidentified in a FSC / SSC dot plot (Figure 4a), fluorescent reporters and stains are usedindividually or in combination to provide specific information about the expressionof various surface or intracellular markers, metabolic state, membrane integrity, etc.In a classic immunophenotyping example, Figure 4b demonstrates the exclusion ofgranulocytes and monocytes, and the analysis of CD45 expressing lymphocytes stainedwith an anti-CD45-APC-Cy 7 Ab.Lymphocytes28.8SSC-AFigure 4b: SSC / APC-Cy 7 fluor dot plot of stainedCD45 lymphocytes.Increasing internal complexitySSC-AIncreasing internal complexityFigure 4a: FSC / SSC dot plot of unstained leukocytes (lysed RBCwhole blood)CD45 62.4780 60 Red-A CD45 APC-H7FSC-AIncreasing sizeIncreasing fluorescence / CD45 expressionwww.Polysciences.com3
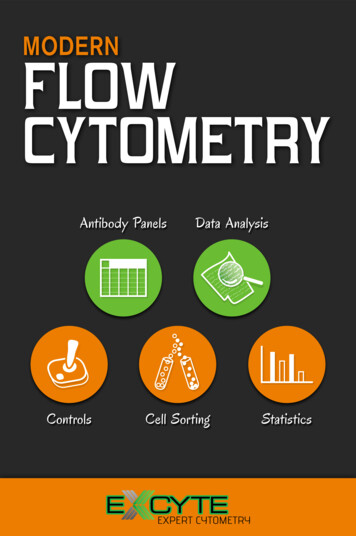
INSTRUMENT QUALIFICATION & QCWithin the life sciences, there is a heavy reliance on analytical instruments to makedecisions related to research, manufacturing and, for clinical applications, patientcare. As this is important work that demands accurate, reliable and relevant data,instruments must be thoughtfully selected, thoroughly qualified, and have capabilitiesverified throughout their active lives. Qualification is a comprehensive process that isundertaken to ensure that each instrument meets expected capabilities, and is suitedto its intended use. It features thorough performance tests, which upon completion,will serve as a foundation for ongoing instrument QC and proficiency programs.Following qualification, the instrument QC program is intended to provide anaccurate picture of instrument status, and provide confidence in resulting data.Specific QC tests should be relevant in type and frequency to the work beingperformed, and the maintenance and service history should also be considered. Ifcertain components or subsystems have been shown to be less stable, these maywarrant more rigorous surveillance.Each day should begin with a general system check that provides an indicationthat subsystems and components are functioning. Additional tests should then beperformed to address the specific use of the instrument. In particular, more stringentQC is required for quantitative assays.Figure 5: QC processRun microsphere standardsRecord and Track QC dataPASS:Approve for useFAIL:Troubleshoot & CorrectService Visit4Polysciences Flow Cytometry Resource Guide
Figure 6: Example of a basic QC program for a 2 laser cytometerFrequencyDailyDaily forquantitativeDaily forquantitative; orWeeklyWeeklyProduct & Catalog CodePurposeCoverageDataFull Spectrum (#BLI885) orQuantum QC (#BLI725)Basic check of system;Laser alignment checkAll lasers /detectorsChart channel values; RecordCVsQuantum MESF (Seepage 10)Run at specific PMTs for quantitativeexpression analyses: Linearity, resolution, detection threshold, alignmentspecificdetectorConfirm resolution; Recordlinearity; Chart detectionthreshold and CVQuantum QC (#BLI725)For qualitative analyses; Linearity, resolution, detection threshold,alignmentAll lasers/detectorsConfirm resolution; RecordLinearity; Chart detectionthreshold and CVTime delay checkDelay between laser1 (488nm)and laser 2(635nm)Confirm time delayTime Delay Standard(#BLI830)A basic program like the example in Figure 7 ensures surveillance of the complete system,i.e. the optics (lasers, detectors, flow cell alignment), fluidics (observation of flow rates,time delay confirmation), and associated computing. Recording values for certain parameters in Levey Jennings charts can readily confirm satisfactory performance, or aid in identifying both random errors (electronic noise, air bubbles, etc.) and systemic errors (bias,shifts and trends due to temperature fluctuation, laser deterioration, misalignment, etc.) sothat corrective action may be taken. Thresholds may be developed for watchful monitoring(A) or intervention (B), Figure 7.Figure 7: Sample Levey Jennings chart for a single fluorescence channelAcceptablerangeAchannelsB29 30 31 32 33 34 35 36 37 38 39 40 41 42 43 44 45 46 47 48 49 50 51 52 53 54 55day1. Green CL, Brown L, Stewart JJ, Xu Y, Litwin V, McCloskey TW. (2011) Recommendations for the validation offlow cytometric testing during drug development: I instrumentation. J Immunol Methods; 363(2):104-119.2. Perfetto SP, Ambrozak D, Nguyen R, Chattopadhyay P, Roederer M. (2012) Quality assurance for polychromaticflow cytometry using a suite of calibration beads. Nature Protocols; 7(12):2067-2079.3. Turner KL. Instrument Qualification, QC and Standardization. The Latex Course, September 2012.4. United States Pharmacopeia, Chapter 1058 , Analytical Instrument Qualification, Rockville, USA, 2008.www.Polysciences.com5
STANDARDIZED INSTRUMENT SET-UPWhile the extremely sensitive nature of flow cytometers permits the analysisof micron-scale (or smaller) and dimly fluorescent particles, it also makes themsensitive to even the most subtle changes in cell samples, instrument operation,and the laboratory environment. For these reasons, it is imperative that instrumentconfiguration and operating conditions be standardized as much as possible, and thatsuitable reference materials are used for tests and assays.The use of reference beads can ameliorate differences in range, relative scale andreporting units, as well as daily fluctuation due to electronic noise, and ambienttemperature and humidity. As one example, Quantum QC may be used to set up alldetectors by positioning a specific peak at a relevant target channel value.Figure 8: Use Quantum QC to define window of analysis i.e. upper & lower fluorescence limitsQuantum QC150Dyed Window of Analysis6Polysciences Flow Cytometry Resource Guide105
Table 2: Products for Instrument Set UpCatalog CodePDSName# beadsBLI725725Quantum QC8Full spectrum BlankBLI885885Full Spectrum 1Full spectrumBLI512, 515, 518, 521510Right Reference StandardsSee Table 3892Fluorescence Reference Standards1-3FluorescenceFITC, PE, PE-Cy 5, or APC1See Page 7Figure 9: Quantum QC 05PE-Cy5104105102VIO 450103APC-Cy7-H1. Purvis N, Stelzer G. (1998) Multi-platform, multi-site instrumentation and reagent standardization. Cytometry;33(2):156-65.SEE COMPENSATION SECTION (PG 10 )FOR SET-UP RELATED TO COMPENSATIONwww.Polysciences.comE7
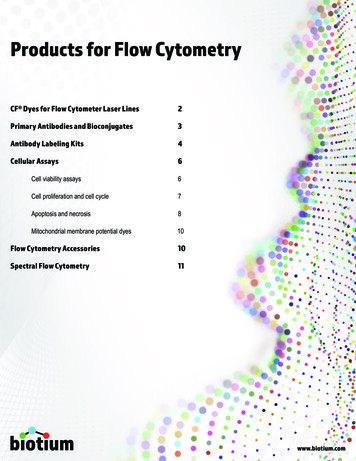
INSTRUMENT SET-UP: SMALL PARTICLESCurrent applications in flow cytometry extend beyond the analysis of lymphocytes,and push cytometers to their limits of detection for particle size and fluorescence.Small particle analyses, including platelet and endothelial-derived microparticles,microvesicles or microbial species, require modified processes and specializedinstrument set-up. Our small bead calibration kits can aid in: determining an instrument’s limit of size detection;assessing background particulates and developing modified preparatoryprocesses (e.g. fluid filtration)small particle size calibrationrefining instrument settings (threshold, PMT, windows extension)Micron Kit – YG105Figure 10: Micron Bead Calibration Kit - LSRII settingsFSC log 536 - Threshold 200SSC log 247 - Threshold 200FITC log 346 - Threshold 2001046.0 µmSSC-H1.0 µmCount1030 50 100 150 200Micron Kit – YG – Combined3.0 µm3.0 µm6.0 µm1021.0 µm102103104105FITC-H1021031041050.8 µm150SSC-H100500.5 µm0.8 µm0.5 µm0.2 µm0Count25 50 75 100Submicron Kit – YG – Combined0.2 µmSubmicron Kit – YG – Combo200(x 1,000)Figure 11: Submicron Bead Calibration Kit - LSRII settingsFSC log 500 - Threshold 200SSC log 494 - Threshold 200FITC log 587 - Threshold 200250FSC-H102103FITC-H8104105102Polysciences Flow Cytometry Resource Guide103FITC-H104105
Figure 12: Nano Bead (100nm) & submicron bead calibration kits- BD FACSCanto II settingsSSC log 500 - Threshold 200FITC log 650 - Threshold 300Windows Ext. 2.0 Events: 5000800 nm500 nm200 nm100 nm200 nm500 nm800 nm100 nmTable 3: Small Bead Calibration KitsCatalog CodePDSNameNominal DiametersBLI833916Micron Bead Calibration Kit1.0μm, 3.0μm, 6.0μmBLI832916Submicron Bead Calibration Kit0.2μm, 0.5μm, 0.8μmBLI834916Nanobead Calibration Kit50 nm, 100 nm1.Arraud N, Gounou C, Turpin D, Brisson AR. (2016) Fluorescence triggering: a general strategy forenumerating and phenotyping extracellular vesicles by flow cytometry. Cytometry; 89(2):184-95.2.Kong F, Zhang L, Wang H, Yuan G, Guo A, Li Q, Chen Z. (2015) Impact of collection, isolation and storagemethodology of circulating microvesicles on flow cytometric analysis. Exp Ther Med; 10(6):2093-2101.www.Polysciences.com9
INSTRUMENT SET-UP: COMPENSATIONDue to the nature of the cytometer (sensitive detection, specific filter sets) and thefluorophores themselves (broad emission bands), fluorescence typically spills overinto regions beyond that covered by the intended detector. The most pronouncedcarryover tends to be into longer wavelengths (i.e. is red-shifted), though it can oftenbe observed to a lesser extent at shorter wavelengths.Multicolor analyses necessitate the correction of spectral overlap for eachfluorochrome and detector. Compensation is performed by electronically subtractingthe percentage of fluorescence signal that is equivalent to the carryover.Proper compensation requires reference materials that represent the actualfluorophore combinations of stained cells. Polysciences offers both fluorophore matched microspheres and microspheres with capture Abs or functional groups forlabeling with reactive fluorophores or fluorescent antibody conjugates. Figure 13illustrates the use of microsphere standards to develop a compensation matrix.Figure 13: Fluorescence Carryoverdetector 2Using compensation, carryover fluorescence iselectronically “subtracted” from unintended detectorsso that the measured signal is as pure as possible. Thisfigure illustrates the carryover of Fluorophore A intothe Fluorophore B detector, as well as the carryoverfrom Fluor B into the Fluor A detector. A compensationmatrix might be:Fluorescencedetector 1BAFluor A – 2% Fluor BFluor B – 1% Fluor AWavelength10Fluor AFluor BOverlapCarryover into detector bandPolysciences Flow Cytometry Resource Guide
Table 5: Compensation Standard ProductsCatalog CodePDSProductBindsBLI820820FITC/PE Compensation StandardPre-labeled with FITC/PESee pg. 13890Fluorescence Reference StandardsPre-labeled with designated fluor pg.13BLI550-552,556850Simply Cellular Compensation StandardsIgG from Mouse, Rat or Human, as notedBLI835835,850Simply Cellular anti-Mouse for Violet LaserIgG from MouseBLI553-554854Protein A, Protein G AntibodyBinding BeadsSee PDS 854 for IgG affinitiesBLI450-451853Viability Dye Compensation StandardsAmine-reactive dyesFigure 14: Compensation Matrix - Simply Cellular anti-Mouse IgG Bead for Violet Laser produces comparable data when compared to cells.10105410103105103105104210010310421000 102103104105 515/20 Violet-A : CD45 V500102010541030103104105 605/40 Violet-A : CD11b eFluor605NC10200 102103104105 515/20 Violet-A : CD45 V500510 605/400103104105Violet-A : CD11b eFluor605NCCompensated with: Stained Cells1041041035101010520 102103104105 515/20 Violet-A : CD45 V50021030 102103104105 515/20 Violet-A : CD45 V500DetectorsValue (%)104515/20 Violet - 450/50 Violet32.6105103605/40 Violet - 450/50 Violet3.060104450/50 Violet - 515/20 Violet7.42605/40 Violet - 515/20 Violet33.51450/50 Violet - 605/40 Violet0.05515/20 Violet - 605/40 Violet0.053DetectorsValue (%)04515/20 Violet - 450/50 Violet31.93605/40 Violet - 450/50 Violet0.00450/50 Violet - 515/20 Violet6.86605/40 Violet - 515/20 Violet32.06450/50 Violet - 605/40 Violet0.16515/20 Violet - 605/40 Violet0.0953100 102103104105 515/20 Violet-A : CD45 V5000105104100103104105 605/40 Violet-A : CD11b eFluor605NC1020100100 102103104105 515/20 Violet-A : CD45 V5001051010210401010401033 605/40 Violet-A :CD11beFluor605NC 605/40 Violet-A :CD11beFluor605NC 605/40Violet-A :CD11b eFluor605NC 605/40Violet-A :CD11b eFluor605NC105 450/50 Violet-A :CD3 PacificBlue 450/50Violet-A :CD3 Pacific Blue 450/50 Violet-A :CD3 PacificBlue 450/50Violet-A :CD3 Pacific Blue 450/50 Violet-A :CD3 PacificBlue 450/50 Violet-A :CD3 PacificBlue 450/50Violet-A :CD3 Pacific Blue 450/50Violet-A :CD3 Pacific BlueCompensated with: Stained Violet Beads0103104105 605/40 Violet-A : CD11b eFluor605NC103230 10100 102103104105 515/20 Violet-A : CD45 V5000104105 515/20 Violet-A : CD45 V5001. Perfetto SP, Chattopadhyay PK, Lamoreaux L, Nguyen R, Ambrozak D, Koup RA, Roederer M. (2006) Aminereactive dyes: an effective tool to discriminate live and dead cells in polychromatic flow cytometry. J ImmunolMethods; 313(1-2):199-208.2. Turner K, Isaiah S, Schretzenmair R, Tijerina J, Bantly A. (2011) Novel compensation standard for the violet laser.CYTO, Baltimore, MD, May 21-25, 2011. (www.bangslabs.com)www.Polysciences.com11
STANDARDIZED SAMPLE PREPClassic immunophenotyping involves fairly straightforward sample preparation.Following collection of the blood sample, there may be a depletion or enrichmentstep (e.g. via density centrifugation, RBC lysis, antibody-coated magnetic particles[e.g. BioMag anti-leukocyte particles]), in addition to fixation and staining. Thoughthe specific steps may be routine, sample preparation should be thoughtfullydesigned and standardized as cellular processes, expression of certain markers, cellviability, microvesicle counts and size distribution may be sensitive to temperature,fixatives, lysing agents, etc. Changes in reagents, handling or storage conditions mayresult in alterations in samples and resulting data.As an additional note on sample preparation, flurophore selection is an importantfactor, where markers with low expression are labeled with bright fluorochromes, andthose that express at high levels are labeled with dimmer reporters. Considerationshould also be given to the size of the fluorescent reporter in the context of potentialsteric effects (e.g. PE MW 260,000; FITC MW 389), stability, nonspecific binding andspectral overlap. (See Table 4.)1. Aasebo E, Mjaavatten O, Maudel M, Farag Y, Selheim F, Berven F, Bruserud O, Hernandez-Valladares.(2016) Freezing effects on the acute myeloid leukemia cell proteome and phosphoproteome revealedusing optimal quantitative workflows. J Prote. Mics; Epub Apr. 20.2. Stewart JC, Villasmil ML, Frampton MW. (2007) Changes in fluorescence intensity of selected leukocytesurface markers following fixation. Cytometry A; 71:379-385.3. Carter PH, Resto-Ruiz S, Washington GC, Ethridge S, Palini A, Vogt R, Waxdal M, Fleisher T, NoguchiPD, Marti GE. (1992) Flow cytometric analysis of whole blood lysis, three anticoagulants, and five cellpreparations. Cytometry; 13(1):68-74.4. Kong F, Zhang L, Wang H, Tuan G, Guo A, Li Q, Chen Z. (2015) Impact of collection, isolation and storagemethodology of circulating microvesicles on flow cytometric analysis. Exp Ther Med; 10(6):2093 - 2101.5. Edinger M. Multicolor Flow Cytometry: Principles of Panel Design. BD Biosciences.6. Maecker H, Trotter J. Selecting Reagents for Multicolor Flow Cytometry, Application Note. BDBiosciences, 2009.12Polysciences Flow Cytometry Resource Guide
Single-color Fluorescence Reference Standards are labeled with specific fluorochromes to exhibit the same spectralcharacteristics as labeled cells. They may be used to QC a specific path of the optical system, to optimize filter sets forfluorophores and to establish a test-specific Target Channel Value for instrument set-up.Visible Spectrum405nm488nm633nm532nmTable 4: Fluorescence Reference Spectrum ProductsCatalogCodeDescriptionBLI890Certified Blank BLI897Emission(nm)MWExcitation (nm)PurposeAcridine Orange265500526DNA/RNABLI886Alexa Fluor 488643499519conjugateBLI887 Alexa Fluor 6471300652668conjugateBLI901Allophycocyanine (APC)104k650660conjugateBLI914APC-Cy 7104k650767conjugateBLI898Chlorophyll (a b)8014 (a)907 (b)430,453642,662plantpigmentreferenceBLI895Cy 5792649666conjugateBLI906DAPI277350470DNA (A-T)BLI913Far-Out onjugateBLI894Hoechst 33342616346375,390dsDNABLI916Pacific Blue 339410455conjugateBLI899PE (R-Phyoerythrin)240k480, 565578conjugateBLI908PE-Cy 5240k480,565,650670conjugateBLI889PE-Cy onjugateBLI892Propidium Iodide668536617DNAintercalatorBLI905T.M. Rhodamine(TRITC, TAMRA)430557576conjugateBLI893Texas Red (Sulforhodamine)625589615conjugateBLI915Violet Laser (Glacial Blue)-360450referencewww.Polysciences.com13
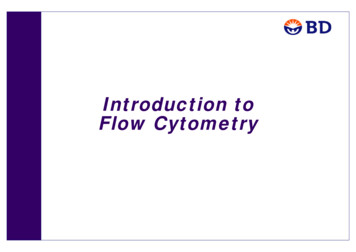
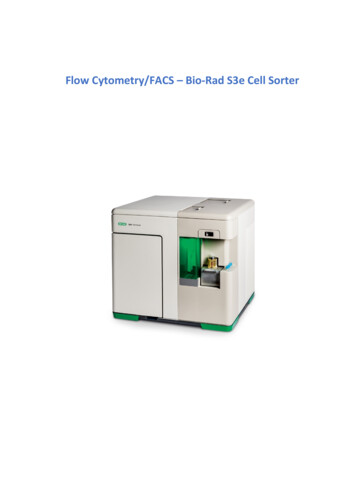
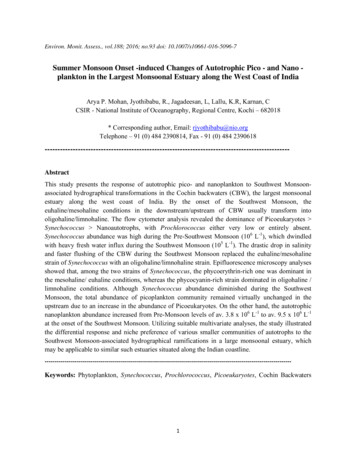
QUALITATIVE & QUANTITATIVE ASSAYSMany immunophenotyping assays are qualitative in nature. For these types ofstudies, cells are stained for a certain marker, and the shift over an unstainedpopulation is used to determine relative expression (low, mid, high) or presenceof the marker in general (positivity). In these types of studies, bead standards canbe used to define the window of analysis, and to serve as reference points for acomparison of results. (see pg. 6-7).Some applications require true quantitation of cell surface markers, intracellularproteins, etc., as with pharmaceutical trials that determine changes in cellularmarker expression levels or distribution in response to administration of a particulardrug. For these types of expression studies, kits such as Quantum MESF andQuantum Simply Cellular (QSC) permit the quantitation of fluorescence signal,and by extension, determination of antibody binding to the surface marker orexpressed protein. Read more about these systems in our literature on QuantitativeFluorescence Cytometry.Counts50Figure 15: Quantum MESF histogram and QuickCal analysis template0BlankM1M5M4M3M20200400600800FL1-HBangs Laboratories, Inc.Quantum MESFLot# xxxxQuickCal v 2.3Acquisition DateEntry DateBeadMESF/ABCBlankBead #1Bead #2Bead #3Bead #4042111501853558158861Channel11360496634752Rqd beads2.75dd/mm/yydd/mm/yy4 Mod Factor41024 Scalex 2log(y)log(y) 2 x*log(y)Plot (Normalized to 256)Calibration8100 3.624385 13.1362 326.1990124158.51000000 188560.51537625122.33534483942.34.176612 17.44414.728824 22.36185.201017 27.050617.73084 0Make/Model:PMT Setting:Antibody Used:Linear Regression:1.0000Detection Threshold:#SampleName1 Sample 12 Sample 23 Sample eincompleteincompleteincompleteincompletem b corr 100000.016082.179410.99999Mod LUE!#VALUE!0#VALUE!#VALUE!60120180240Histogram ChannelsPolysciences Flow Cytometry Resource Guide1000
Table 6: Quantitative Cytometry ProductsCatalog CodeDescriptionFluorophoreMWBLI488Quantum MESF Alexa Fluor 488Alexa Fluor 488643BLI555, 555pQuantum MESF FITC-5FITC389BLI827Quantum MESF R-PEPE240kBLI828Quantum MESF PE-Cy 5PE-Cy 5240kBLI822Quantum MESF Cy 5Cy 5792BLI647Quantum MESF Alexa Fluor 647Alexa Fluor 6471300BLI823Quantum MESF APCAPC104kCatalog CodeDescriptionCapture AntibodyBindsBLI815QSC anti-Mouse IgG (Fc)anti-Mouse IgG (Fc-specific)Mouse mAb (Fc)BLI816QSC anti-Rat IgG (Fc)anti-Rat IgG (Fc-specific)Rat mAb (Fc)BLI817QSC anti-Human IgG (Fc)anti-Human IgG (Fc-specific)Human mAb (Fc) 1. Maecker HT, Trotter J. (2006) Flow cytometry controls, instrument setup and the determination of positivity.Cytometry; 69A:1037-1042.2. Randlev B, Huang L-C, Watatsu M, Marcus M, Lin A, Shih S-J. (2010) Validation of a quantitative flow cytometerassay for monitoring HER-2/neu expression level in cell-based cancer immunotherapy products. Biologicals;38(2):249-259.www.Polysciences.com15
NOTES16Polysciences Flow Cytometry Resource Guide
Some other products that may be of interest:Cell Cycle AnalsisMicroparticle AnalysisSize EstimationImaging StandardsCell Viability StandardsConcentration StandardsWe are here for you; let us know how we can help. Bangs Laboratories Printed 2016400 Valley Road Warrington, PA 18976 info@polysciences.com 800-523-2575
400 Valley Road Warrington, PA 18976 info@polysciences.com 800-523-2575
Flow cytometry is a complex but highly informative technology that permits evaluation of cells, subcellular compartments / organelles and microparticles. . Shapiro HM. (2003) Practical Flow Cytometry, Fourth Edition. John Wiley & Sons: Hoboken. (ISBN:0-471-41125-6) 6 9 5 / 4 0 1 0 / 2 0 8 6 9 5 L 5 3 0 / 3 0 6 3 2 7 8 0 / 6 0 6 0 / 2 5 5 / 5 .