Transcription
Environ. Monit. Assess., vol.188; 2016; no.93 doi: 10.1007/s10661-016-5096-7Summer Monsoon Onset -induced Changes of Autotrophic Pico - and Nano plankton in the Largest Monsoonal Estuary along the West Coast of IndiaArya P. Mohan, Jyothibabu, R., Jagadeesan, L, Lallu, K.R, Karnan, CCSIR - National Institute of Oceanography, Regional Centre, Kochi – 682018* Corresponding author, Email: rjyothibabu@nio.orgTelephone – 91 (0) 484 2390814, Fax - 91 (0) 484 --AbstractThis study presents the response of autotrophic pico- and nanoplankton to Southwest Monsoonassociated hydrographical transformations in the Cochin backwaters (CBW), the largest monsoonalestuary along the west coast of India. By the onset of the Southwest Monsoon, theeuhaline/mesohaline conditions in the downstream/upstream of CBW usually transform intooligohaline/limnohaline. The flow cytometer analysis revealed the dominance of Picoeukaryotes Synechococcus Nanoautotrophs, with Prochlorococcus either very low or entirely absent.Synechococcus abundance was high during the Pre-Southwest Monsoon (106 L-1), which dwindledwith heavy fresh water influx during the Southwest Monsoon (105 L-1). The drastic drop in salinityand faster flushing of the CBW during the Southwest Monsoon replaced the euhaline/mesohalinestrain of Synechococcus with an oligohaline/limnohaline strain. Epifluorescence microscopy analysesshowed that, among the two strains of Synechococcus, the phycoerythrin-rich one was dominant inthe mesohaline/ euhaline conditions, whereas the phycocyanin-rich strain dominated in oligohaline /limnohaline conditions. Although Synechococcus abundance diminished during the SouthwestMonsoon, the total abundance of picoplankton community remained virtually unchanged in theupstream due to an increase in the abundance of Picoeukaryotes. On the other hand, the autotrophicnanoplankton abundance increased from Pre-Monsoon levels of av. 3.8 x 10⁶ L-1 to av. 9.5 x 10⁶ L-1at the onset of the Southwest Monsoon. Utilizing suitable multivariate analyses, the study illustratedthe differential response and niche preference of various smaller communities of autotrophs to theSouthwest Monsoon-associated hydrographical ramifications in a large monsoonal estuary, whichmay be applicable to similar such estuaries situated along the Indian ---------------------------------Keywords: Phytoplankton, Synechococcus, Prochlorococcus, Picoeukaryotes, Cochin Backwaters1
1. IntroductionSmaller autotrophic plankton consist of pico - (0.2 - 2 μm) and nano - (2 - 20 μm) size rangesinhabiting the euphotic ocean surface layer. Earlier studies showed that autotrophic picoplanktonoccurs abundantly in the oceanic/oligotrophic environments where they contribute more than 50% ofthe gross primary production (Stockner and Antia 1986; Li 1983; Li and Wood 1988). More recentresearch evidenced that autotrophic picoplankton are abundant in the nutrient-rich waters such ascoastal and estuarine waters as well, though their proportionate contribution to the gross primaryproduction in such environments is lower than the large-sized phytoplankton (Philip et al. 1999;Badylak and Philips 2004; Mitbavkar and Anil 2011; Mitbavkar et al. 2012). On the other hand, thesignificant contribution of nanoplankton to the gross phytoplankton biomass and production innutrient-rich coastal and estuarine waters is well accepted (Qasim 2003; Madhu et al. 2007;Jyothibabu et al. 2013; 2014). In recent years, the presence and ecological role of the smallerphytoplankton in marine ecosystem are increasingly accepted, as they form the base of the complexmicrobial plankton food web, the important functional entity in recycling and transfer of organicmatter to the higher trophic levels (Pomeroy 1974; Azam et al. 1983; Lampitt et al. 1993;Cermeno etal., ochlorococcus,Synechococcusandpicoeukaryotes. Prochlorococcus and Synechococcus are considered the most abundantphotosynthetic organisms in the ocean, contributing significantly to the global primary production(Veldhuis et al. 1993; Burkill et al. 1993; Partensky et al. 1996). Further studies on this subjectidentified several strains of Synechococcus from rivers, lakes, estuaries and seas from various partsof the world, leading to the general belief that Synechococcus are more diverse than Prochlorococcus(Fuller et al. 2003; Ahlgren and Rocap 2006; Mitbavkar et al. 2012). Available information on thetaxonomic composition and diversity of autotrophic pico-eukaryotes and nanoplankton isconsiderably lesser than autotrophic picoplankton. Available information indicates autotrophicflagellates as the main component of pico-eukaryotes, whereas smaller diatoms also contribute to theautotrophic nanoplankton community (Fuller et al. 2003; Ahlgren and Rocap 2006; Mitbavkar et al.2012).The present study area, Cochin backwaters/estuary, is significantly influenced by heavy rainfallduring the Southwest / Summer Monsoon (June - September) and, therefore, categorized as a typicalMonsoonal Estuary where the total water inflow into the system is several orders of magnitude largerthan the estuarine volume (Vijith et al. 2009). Information regarding the ecology and distribution ofautotrophic pico- and nanoplankton and their response to the Southwest Monsoon rainfall and2
freshwater influx in the Cochin backwaters remains vague and incomplete considering that relevantstudies addressing the issue have not been undertaken. As large hydrographical changes are usual inthe Cochin backwaters during the Southwest Monsoon, attempts are made in this paper to understandthe response of the smaller autotrophic plankton to rapid hydrographical changes. Using state-ofthe-art equipment such as Flow Cytometry and Fluorescence Microscopy, we studied the autotrophicpicoplankton and nanoplankton in the Cochin backwaters to understand their (a) distribution ecologyin different salinities from marine to freshwater conditions during the Pre-Southwest Monsoon (b)their response to significant hydrographical changes that occur during the onset of the SouthwestMonsoon and (c) their distribution pattern during limnohaline/limnetic conditions that ensuethroughout the Southwest Monsoon.2. Materials and Methods2.1Study AreaCochin backwaters/estuary (CBW) is the largest of its kind along the west coast of India (Figure 1).It is situated between 9 30’ to 10 20’N and 76 13’ to 76 5’E. The estuary occupies an area of 130km2 and has two permanent inlets into the Arabian Sea – a wider one at Kochi compared to the otherat Azhikode in the north. Tidal incursion from the Arabian Sea (tidal range of 1m) contributes aregular flow of salt water into the Cochin backwaters. Tidal influence is dominant during the nonmonsoon period and more emphatic in the downstream region; its amplitude diminishes considerablytowards the upstream (Madhupratap 1987). The main source of freshwater into the Cochinbackwaters are six rivers (Pamba, Achancoil, Manimala, Meenachil, Periyar and Muvattupuzha), ofwhich the first three drain into the southern part of the system.Typically, the Southwest Monsoon rainfall begins in the study domain during the first week of Juneand peaks during mid-June to August (Qasim 2003). During the peak Southwest Monsoon, heavyrainfall (40 - 50 cm in a few hours) occurs in the region (Qasim 2003) and salinity reaches near zerovalues over most parts of the CBW (Jyothibabu et al. 2006). The gross phytoplankton biomass andproduction in the Cochin backwaters are very high and remain largely constant all through the year,due to a qualitative shift in the phytoplankton community during the Southwest Monsoon conditions(Qasim 2003; Jyothibabu et al. 2006). In order to develop conclusive information on the response ofsmaller plankton to various hydrographical settings in the Cochin backwaters, we adopted thestandard salinity grouping designed for estuarine conditions by McLusky (1993), based on whichwaters/zones were grouped as (a) euhaline (salinity 30), (b) polyhaline (salinity 25 to 32), (c)mesohaline (salinity 5 to 18), (d) oligohaline (salinity 0.5 to 5) and (e) limnetic (salinity 0.5).3
2.2. SamplingAltogether 14 locations were sampled along the salinity gradients in the Cochin backwaters. Thefrequency of sampling in the study area was designed in such a way that the community response ofsmaller autotrophic plankton to stratified/high saline conditions during the Pre-Southwest Monsoon,hydrographical transition phase during the onset of the Southwest Monsoon and thelimnohaline/limnetic conditions during the Southwest Monsoon could be quantified. In order toaccomplish this, a typical Pre-Southwest Monsoon hydrographical setting in the Cochin backwaterswas sampled on May 26, 2011. The second sampling in the study area was carried out on June 3,2011, intended to capture the signals of hydrographical transition from the Pre–Southwest Monsoonto the Southwest Monsoon. Typical limnohaline conditions existing in the Cochin backwaters duringthe Southwest Monsoon were captured on June 9 and 15 in 2011. The field sampling was carried outon a power boat, and the sampling began at Kochi (location 1) by 10AM and ended atThannermukkom (location 14) by 1 PM (Figure 1). A SEACAT SBE 19 plus V2 portable CTD(Conductivity, Temperature, and Depth) profiler was used to record the vertical salinity and DO(dissolved oxygen) distributions in locations. As the study area is shallow, water samples werecollected from just below the surface ( 1m) using a Niskin sampler and used for quantifying variouschemical and biological parameters.2.3. Climatic and Environmental FactorsRainfall data representing the study domain was obtained from Indian Meteorological Department,Pune. The daily rainfall data for the two major revenue districts encompassing the Cochinbackwaters (Ernakulum and Alappuzha) were considered in the present study to show the drasticincrease in rainfall and its connection to the hydrographical transformations by the onset of theSouthwest Monsoon. The salinity values recorded by CTD sensors was presented to show the rapidhydrographical changes that occur in the Cochin backwaters as the Southwest Monsoon sets in bythe first week of June. The turbidity levels in different sampling locations were measured using aturbidity meter (Eutech Model TN 100) based on nephelometric principles. Dissolved inorganicmacronutrients (Nitrate – NO3, Phosphate - PO4, and Silicate - SiO4) were measured followingstandard colorimetric techniques (Grasshoff et al. 1983).2.4.Biological ParametersWater samples for the analysis of phytoplankton total chlorophyll a was filtered through Milliporemembrane filters (0.2m), followed by chlorophyll extraction with 90% acetone and itsmeasurement by a Trilogy Turner fluorometer following standard procedure (UNESCO 1994). Flow4
Cytometric samples of autotrophic pico – and nanoplankton populations were preserved with 1%glutaraldehyde solution and stored in liquid nitrogen until analysis was initiated (Vaulot et al. 1996).Prior to the analysis, batches of thawed samples were homogenized with a laboratory test tubeshaker. Samples were then analyzed in a BD Accuri C6 Flow Cytometer to quantify autotrophic pico- and nanoplankton. Yellow-green fluorescent beads (2 µm and 6 µm, Polysciences) were used tostandardize the measurements. The Flow Cytometry facilitated the quantification of autotrophicsmaller plankton based on the forward light scatter (FLS; proxy for cell size) and cellularfluorescence from photosynthetic pigments (chlorophyll a, phycoerythrin and phycocyanin). Forconfirmation of the Flow Cytometric measurements, microscope slides were prepared randomlybased on standard procedures and scanned under an Epifluorescence microscope (Olympus IX 71)with a blue excitation filter set (Bloem et al. 1986). The present study considered yellow-orangefluorescence emission for the phycoerythrin-rich Synechococcus strain and red for the thephycocyanin-rich one, as observed under a blue excitation light (Ernst 1991; Callieri et al. 1996).2.5.Statistical Analyses2.5.1. Cluster / SIMPROF and NMDSCluster/ SIMPER and NMDS were used to segregate the observations of different parameters intoclusters based on their similarity/homogeneity. The data or observations in one cluster indicate theirsimilarity whereas their placement in different clusters show their dissimilarity. The data of planktoncomponents were initially standardized and log (X 1) transformed to normalize the differences innumerical abundance (Clarke and Warwick 1994).2.5.2. Redundancy Analysis (RDA)RDA was used to elucidate the interrelationships between the smaller autotrophic planktoncomponents and their environmental variables. Initially, the data was processed using DetrendedCorrespondence Analysis (DCA) to select the suitable ordination technique. The result of DCAshowed axis gradient length 2, which suggest linear multivariate RDA suitable for the present data(Birks 1998; Leps and Smilauer 2003). The biological variables were log transformed prior to theanalysis. The ordination significance was tested with Monte Carlo permutation tests (499unrestricted permutations) (p 0.05). The results of the RDA are presented in tri-plots in which thesamples are displayed by points and environmental and biological variables by arrows. Arrows forenvironmental and biological variables indicate the direction in which the corresponding variableincreases (Leps and Smilauer 2003).5
3.Results3.1. Rainfall and Environmental ParametersThe pattern of rainfall during the study period from May 22 to June 15 in 2011 is presented in Figure2a. Similarly, the distribution of salinity and dissolved oxygen in the Cochin backwaters recordedduring the study period has been depicted in Figure 2b-e. It is evident that during the Pre-SouthwestMonsoon the study area was characterized by very low / nil rainfall with stratified water column. TheCTD profiles during the period presented typical estuarine features in the study domain withpolyhaline conditions in the downstream stretches (location 1 and 2), mesohaline conditions in themiddle stream locations (locations 3 to 8) and oligohaline conditions in the upstream region(locations 9 to 14).The Southwest Monsoon rainfall in the study domain began on 30th May, a few days earlier thanexpected. Heavy rainfall was recorded during the onset of the Southwest Monsoon rainfall in the firstweek of June and later it diminished erratically with highs and lows. The rapid increase in rainfallduring the onset of the Southwest Monsoon caused a drastic decline in the salinity of the studydomain. During Monsoon 1 sampling in the first week of June, the Cochin backwaters transformedinto limnohaline/ oligohaline in the upstream/downstream stretches and presented a drastic decline inthe average salinity in the study area (salinity av. 0.49 0.9) (Figure 2 and Table 1). Oligohalineconditions prevailed in locations 1 to 6 (salinity 0.66 - 1.24), and limnohaline conditions in locations7 to 14 (salinity 0.5).The average salinity in the Cochin backwaters further decreased during Monsoon 2 sampling andwas the lowest of all (av. 0.26 1.9), with oligohaline conditions prevailing in locations 1 and 2 andlimnetic conditions in the rest (locations 3 to 14). The average salinity in the system Monsoon 2(salinity av. 0.26 1.9) was found to be even lower during the Monsoon 3 collection (salinity av.0.28 1.7). During Monsoon 3 collection, oligohalinity prevailed in locations 1 to 3 and limneticconditions in the others (locations 4 to 14). The turbidity values recorded during different collectionsare presented in Table 1.The water column during the Pre-Southwest Monsoon was clearest amongall the observations, as evidenced by the lowest turbidity values during the study period (Table 1).The turbidity level significantly increased as the Southwest Monsoon progressed in the studydomain. The turbidity in the study area was the highest during Monsoon 1 (av. 40.65 0.8 NTU),decreased during Monsoon 2 (av.14.9 0.6 NTU) and then increased during Monsoon 3 (av. 24.2 1.1 NTU).6
3.2. Silicate, Nitrate and PhosphateSilicate was high in the Cochin backwaters throughout the observations. The average silicateconcentration in the study area was high even during the Pre-Southwest monsoon (av. 38.64 9.62µM), the period with lowest river discharge (Table 1). Silicate concentration sequentially increasedfrom Pre-Southwest Monsoon (av. 38.6 0.2) to Monsoon 1 (av. 111.95 0.1 µM) to Monsoon 2(av. 117.55 0.1 µM) and Monsoon 3 (av.128.50 0.1 µM). Like silicate, the nitrate level was alsohigh in the Cochin backwaters throughout the sampling session and a clear sequential increase fromone session to the next was not evident. The nitrate concentration was the highest of all samplingduring Monsoon 3 (av. 27.78 0.2 µM) followed by Pre-Monsoon (av. 20.31 0.6 µM), Monsoon 2(av. 16.98 0.1 µM) and Monsoon 1 (av. 9.44 0.5 µM).The concentration of phosphate wasfound to be low and comparable during all the sampling sessions. The lowest phosphateconcentration was found during Monsoon 3 (av. 0.1 0.6 µM), followed by Pre-Southwest Monsoon(av. 0.227 0.5 µM), Monsoon 1 (av. 0.240 0.5 µM) and Monsoon 2 (av. 0.3 0.3 µM).3.3. Segregation of Locations Based on Environmental ParametersBased on the environmental parameters recorded in 14 locations in the Cochin backwaters during theweekly sampling, several clusters of locations were identified. During the Pre – Southwest Monsoonsampling, 3 clusters of locations were identified in the study area (Figure 3 a-c). Locations close tothe Kochi inlet (locations 1 and 2) were assembled in cluster 1, which was characterized bypolyhaline waters with higher concentrations of phosphate, lower concentrations of nitrate and lowerturbidity compared to the rest of the locations. Locations in the mesohaline waters with moderatelevels of silicate and turbidity were grouped as cluster 2 (locations 3 to 8). Locations in theoligohaline waters with the highest level of silicate and turbidity and the lowest concentration ofphosphate were grouped as cluster 3 (locations 9 to 14).During Monsoon 1 sampling, a significant change was noticeable in the hydrography of the Cochinbackwaters from that of the Pre–Southwest Monsoon conditions (Table 1). During this period,locations in the entire study area were grouped into two clusters: locations closer to the Kochi inletunder some influence of saltwater intrusion from the Arabian sea formed cluster 1 (locations 1 to 6)and the remaining locations dominated by freshwater (locations 7 to 14) formed cluster 2 (Figure 3df). The cluster 1 locations were oligohaline with relatively high phosphate and low nitrate, silicateand turbidity. Oligohaline waters with high silicate and turbidity and low phosphate prevailed incluster 2.7
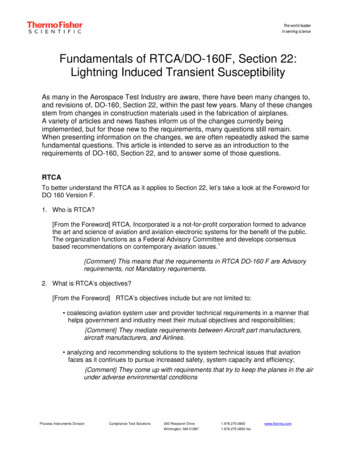
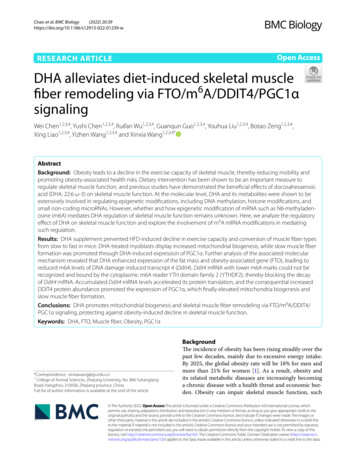
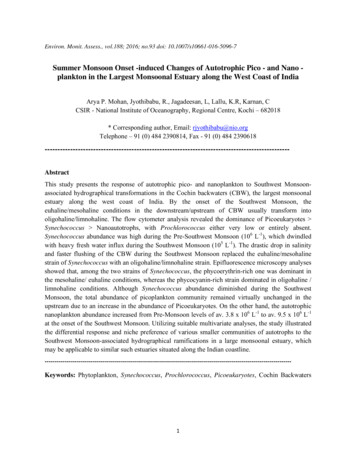
During Monsoon 2 sampling, saline water intrusion was confined only to locations very close to theKochi inlet (Figure 4a-c). As a result, the entire sampling locations were characterized by a smallcluster 1 (locations 1 and 2) and a large cluster 2 (locations 3 to 14). Cluster 1 was characterized byoligohaline conditions with low nitrate and turbidity, and high silicate. On the other hand, cluster 2showed limnetic conditions with high silicate, nitrate and turbidity. The clustering of locations basedon Monsoon 3 collection was considerably similar to Monsoon 2 with a small cluster (cluster 1)formed of locations 1 to 3 and a large cluster (cluster 2) formed of locations 4 to 14 (Figure 4d-f).Evidently, cluster 1 represented the oligohaline conditions and cluster 2 limnohaline (Figure 4f).3.4. Biological factors3.4.1. Chlorophyll aThe chlorophyll values were generally high in the study area ( 1.5 mg m-3) in all the weeklysampling sessions (Table 1). The temporal variations in chlorophyll during the four weekly samplingsessions showed relatively high values in the Pre-Monsoon period (av. 4.81 0.6 mgm-3), a peak inMonsoon 1 (av. 12.56 0.6 mgm-3), and a subsequent drop in Monsoon 2 (av. 2.68 0.3 mgm-3) andMonsoon 3 (av. 1.65 0.8 mgm-3). Like chlorophyll, phaeopigments were also high in the studyarea throughout the observations.3.4.2. SynechococcusA typical flowcytogram of pico - and nanoplankton community inhabiting the Cochin backwaters ispresented in Figure 6a. The samples collected during the four weekly sampling sessions showed thehighest abundance of Synechococcus during the Pre-Monsoon sampling (av. 41.5 0.8 x 10⁵ L-1)(Figure 5). In the subsequent sampling sessions, Synechococcus cell abundance markedlydiminished, as evident during Monsoon 1 (av. 9.7 0.6 x 10⁵ L-1), Monsoon 2 (av. 8.5 0.5 x 10⁵ L1) and Monsoon 3 (av. 2.2 0.4 x 10⁵ L-1).The random analysis of the picoplankton samples using epifluorescence microscopy showed aqualitative shift in Synechococcus community in different salinity regimes (Figure 7). Thephycoerythrin-dominant community (yellow-orange color) was dominant during the pre SouthwestMonsoon (high saline) conditions, whereas it was a phycocyanin-dominant one (red color) during theSouthwest Monsoon (low saline/ limnetic) conditions. Even though a qualitative shift inSynechococcus community occurred in the Cochin backwaters during the Southwest Monsoon, theirtotal abundance was strongly linked to the salinity distributions. High saline conditions favored theabundance of Synechococcus community whereas Southwest Monsoon conditions declined their totalabundance (Figure 8).8
3.4.3. PicoeukaryotesThe picoeukaryotes community represented in the flow cytogram is depicted in Figure 6. The patternof distribution of the pico-eukaryotes was different from that of the Synechococcus (Figure 8, Table1). The abundance of pico-eukaryotes was higher during the Pre-Monsoon (av. 2.1 0.9 x 10⁷ L-1) ascompared to Monsoon 1 (av. 1.6 0.5 x 10⁷ L-1 cells ml-1). However, during the subsequentsampling in Southwest Monsoon, the pico-eukaryotes abundance increased, as found duringMonsoon 2 (av. 3.2 0.9 x 10⁷ L-1) and Monsoon 3 (av. 3.8 1.2 x 10⁷ L-1). Though there was adecline in the abundance of pico-eukaryotes during the period of Monsoon 1 sampling, their overallabundance increased as a response to high freshwater influx (Figure 8).3.4.4. Autotrophic NanoplanktonAutotrophic nanoplankton temporal distribution pattern was similar to autotrophic pico-eukaryotes.The abundance of nanoplankton was high during the Pre–Southwest Monsoon (av. 3.8 0.8 x 10⁶ L1) as compared to Monsoon 1 (av. 3.1 1.2 x 10⁶ L-1). However, the abundance of autotrophicnanoplankton significantly increased in the subsequent sampling sessions during Monsoon 2 (av.10.6 0.5 x 10⁶ L-1) and Monsoon 3 (av. 9.7 1.5 x 10⁶ L-1). Similar to the autotrophic picoeukaryotes, the abundance of autotrophic nanoplankton displayed a negative relationship withsalinity.3.4.5. ProchlorococcusThe abundance of Prochlorococcus was either negligible or absent in the Cochin backwaters. Verylow occurrence of the organism was noticed in locations in close proximity with the inlets, and thattoo without any clear temporal trend. As their occurrence was highly irregular and confined to a fewlocations in the inlet locations, their distribution and interrelationship with salinity was not attemptedby statistical treatments involved in Tri-plot (Figure 9).4.Discussion4.1. Hydrographical Transformation during the Southwest MonsoonIt is well accepted that the downstream of the Cochin backwaters behaves as an extension of theArabian Sea during the Pre-Southwest Monsoon due to active intrusion of saline water while theupstream remains in low saline conditions due to fresh water influx from rivers (Madhupratap 1987).This typical estuarine hydrographical setting in the Cochin backwaters was prevalent during thepresent Pre-Southwest Monsoon sampling also. During this period, the hydrography of the Cochinbackwaters showed polyhaline waters in the downstream stretches, mesohaline waters in the central9
part and oligohaline waters in the upstream regions, as evident in the cluster analysis of locationsbased on similarities in their environmental factors. This essentially represents a gradual dilution ofhigh saline Southeastern Arabian Sea waters ( 34) from the downstream to the upstream of theCochin backwaters during the Pre-Southwest Monsoon.The southwest Monsoon rainfall in the study domain typically begins during the first week of June,which rapidly transforms the Cochin backwaters from truly estuarine to limnetic (Qasim 2003;Jyothibabu et al. 2004). This feature was clearly captured in the present sampling; as a few days ofheavy rainfall during the first week of June significantly transformed the hydrography of the Cochinbackwaters into a fresh water dominant system with oligohaline conditions in the downstream andlimnetic conditions in the upstream during Monsoon 1 sampling. The dominance of freshwater inthe Cochin backwaters further increased during Monsoon 2 and 3 sampling sessions, causing a fewdownstream locations to become oligohaline and turning all the rest of the locations limnohaline.This indicates that the onset of the Southwest Monsoon rainfall causes rapid transformation of thestudy domain into a freshwater dominant one. As monsoon rainfall persists for longer time scales,the entire Cochin backwater area becomes dominated by the freshwater with only a few downstreamlocations remaining oligohaline and the rest turning limnohaline.4.2. Response of plankton to hydrographical changesSignificantly high levels of nitrate and silicate, primarily contributed by several rivers that emptyinto the system, are usual in the Cochin backwaters all through the year, (Jyothibabu et al. 2006).There are several non-point sources such as agricultural and aquaculture along the banks of theCochin backwaters that too contribute to the nutrient budget of the system (Saraladevi et al. 1983).The high nutrient level in the Cochin backwaters supports significantly high phytoplankton biomass,mainly contributed by nanoplankton (Madhu et al. 2007; Jyothibabu et al. 2014). This typical featurein nitrate and silicate levels of the Cochin backwaters was reflected well in the present study also asthere were significantly high levels of nitrate and silicate throughout the sampling session.During the Pre-Monsoon sampling, even with surplus nutrients available in the Cochin backwaters,the total phytoplankton biomass was moderate (av. 4.8 mg m-3) compared to the Monsoon 1sampling session (av. 12.6 mg m-3). The relatively stable environmental conditions during the PreMonsoon period allows the zooplankton to diversify and increase their stock, causing a moreeffective feeding interaction and grazing pressure on phytoplankton (Madhupratap et al. 1987;Jyothibabu et al. 2014). The increased zooplankton grazing of phytoplankton (top down control)could be a potential reason for the moderate level of chlorophyll a during the Pre-Monsoon sampling10
when environmental conditions remained conducive for phytoplankton growth. Earlier studies haveshowed that herbivorous copepods and microzooplankton consume a major part of the phytoplanktonstock during high saline and relatively stable hydrographical settings (Tan et al. 2004; Jyothibabu etal., 2006). On the other hand, much of the phytoplankton stock is left unconsumed in the Cochinbackwaters during the Southwest Monsoon conditions due to significantly low occurrence ofmicrozooplankton (1/9 of the Pre-Monsoon) and herbivorous meso-zooplankton (1/8 times of thePre-Monsoon).The qualitative shift in larger phytoplankton community in the Cochin backwaters associated withthe Southwest Monsoon has been noticed in many studies (Qasim et al. 2003; Jyothibabu et al.2006). During the onset of the Southwest Monsoon, a large phytoplankton community dominated bychain-forming diatoms from the upstream freshwater region are transported downstream and becomewidespread in the Cochin backwaters. This feature was consistent with the present observation inwhich a remarkable increase in total chlorophyll was observed during the Monsoon 1 sampling. Thesnapshots of the microscope slides showing large chain-forming phytoplankton community duringMonsoon 1 sampling is presented as supplementary material 1. This provides clear evidence for thepredominance of large chain-forming diatoms during the onset of the Southwest Monsoon,contributing significantly to a significant increase in the total chlorophyll concentration ( 10mgm-3)during the period.4.2.1. Response of autotrophic pico- and nanoplanktonIn tropical estuarine waters, the contribution of Synechococcus to the total phytoplankton carbonbiomass ranges from 9 to 29% and considered to be an indication of the estuarine hydrodynamics(Mitbavkar and Anil 2011; Mitbavkar et al. 2013). During the Pre-Southwest Monsoon, theabundance of Synechococcus was significantly higher in the polyhaline/limnetic conditions in theCochin backwaters. In marine environments, Synechococcus prefers nutrient-rich environments andoccurs abundantly in the well-lit portion of the euphotic zone (Partensky 1996). During theSouthwest Monsoon, a qualitative shift in Synechococcus community was evident in the Cochinbackwaters with phycoerythrin-rich (PE–rich) marine strains abundant in the polyhaline downstreamregion and phycocyanin–rich (PC-rich) mesohaline/limnohaline strain in the low saline/upstreamregions. Similarly, the highest abundance of Synechococcus was found in the mesohaline region(location 3-7) of the Cochin backwaters during the Pre-Southwest Monsoon, where both strainscontributed to the high abundance. It was observed earlier that Synechococcus strain abundant inoceanic waters ar
The flow cytometer analysis revealed the dominance of Picoeukaryotes . Samples were then analyzed in a BD Accuri C6 Flow Cytometer to quantify autotrophic pico - and nanoplankton. Yellow-green fluorescent beads (2 µm and 6 µm, Polysciences) were used to standardize the measurements. The Flow Cytometry facilitated the quantification of .