Transcription
PASS Sample Size SoftwareNCSS.comChapter 286Operating Characteristic Curves forAcceptance Sampling for AttributesIntroductionThe Operating Characteristic Curves for Acceptance Sampling for Attributes procedure is a companionprocedure to the procedure Acceptance Sampling for Attributes. This procedure is used view graphically theprobability of lot acceptance versus the lot proportion defective for a given sample size and acceptancenumber. Plots with multiple curves for multiple sample sizes or multiple acceptance numbers may begenerated using this procedure.In this procedure, the lot size can be assumed to be infinite (or continuous) and use the binomialdistribution for calculations, or the lot can have a fixed size, whereupon the calculations are based on thehypergeometric distribution.286-1 NCSS, LLC. All Rights Reserved.
PASS Sample Size SoftwareNCSS.comOperating Characteristic Curves for Acceptance Sampling for AttributesTechnical detailsDefine N to be the lot size (possibly infinite), n as the size of the sample to be drawn, and c to be the acceptancenumber (the highest number of nonconforming units for which the lot will still be accepted). Let X denote thenumber of nonconforming units in the sample. If the lot size is assumed to be infinite, the probability ofacceptance, Pa, for a given lot proportion defective, p, is given by𝑐𝑐𝑃𝑃𝑎𝑎 𝑋𝑋 0𝑛𝑛!𝑝𝑝 𝑋𝑋 (1 𝑝𝑝)𝑛𝑛 𝑋𝑋𝑋𝑋! (𝑛𝑛 𝑋𝑋)!If the lot size is finite, the hypergeometric distribution is used, where, for each X,where M [Np].𝑀𝑀 𝑁𝑁 𝑀𝑀 ℎ(𝑋𝑋; 𝑁𝑁, 𝑀𝑀, 𝑛𝑛) 𝑋𝑋 𝑛𝑛 𝑋𝑋𝑁𝑁 𝑛𝑛The probability of acceptance is given by𝑐𝑐𝑃𝑃𝑎𝑎 ℎ(𝑋𝑋; 𝑁𝑁, 𝑀𝑀, 𝑛𝑛)𝑋𝑋 0286-2 NCSS, LLC. All Rights Reserved.
PASS Sample Size SoftwareNCSS.comOperating Characteristic Curves for Acceptance Sampling for AttributesExample 1 – Generating an Operating Characteristic CurveSuppose a quality engineer is to receive a lot of 500 units. The engineer is considering sampling 50 units andwould like to examine the operating characteristic curve for an acceptance number of 3. To begin, theengineer will examine the full range of lot proportion defectives (0 to 1).SetupIf the procedure window is not already open, use the PASS Home window to open it. The parameters for thisexample are listed below and are stored in the Example 1(a or b) settings file. To load these settings to theprocedure window, click Open Example Settings File in the Help Center or File menu.Design TabLot Size (N) . 500Sample Size (n) . 50Acceptance Number (c) . 3Proportion Defective Range . 0 to 1 by 0.01OutputClick the Calculate button to perform the calculations and generate the following output.Plots SectionPlots 286-3 NCSS, LLC. All Rights Reserved.
PASS Sample Size SoftwareNCSS.comOperating Characteristic Curves for Acceptance Sampling for AttributesNumeric ReportsNumeric Results Solve For:Probability of AcceptanceLot Size (N): 500 SampleAcceptanceSizeNumberProportionProbability ofncDefectiveAcceptance 0.000000.000000.000000.00000286-4 NCSS, LLC. All Rights Reserved.
PASS Sample Size SoftwareNCSS.comOperating Characteristic Curves for Acceptance Sampling for 00005030.980.000005030.990.000005031.000.00000 ncProportion DefectiveProbability of AcceptanceSample Size. The size of the sample drawn from the lot.Acceptance Number. The largest number of nonconforming items from the sample of size n forwhich the lot should still be accepted.The proportion of the items of the lot that is assumed to be defective.The probability that the lot will be accepted, given the corresponding sample size, acceptancenumber, and assumed proportion defective.286-5 NCSS, LLC. All Rights Reserved.
PASS Sample Size SoftwareNCSS.comOperating Characteristic Curves for Acceptance Sampling for AttributesReferences Montgomery, D. C. 2013. Introduction to Statistical Quality Control, 7th Edition. John Wiley & Sons.Kenett, Ron S. and Zacks, Shelemyahu 2014. Modern Industrial Statistics, 2nd Edition. John Wiley & Sons. WestSussex, United Kingdom. Each line gives the probability of acceptance based on the corresponding proportion defective.Since the probability of acceptance is close to 0 when the lot proportion defective reaches 0.2, theProportion Defective Range is changed to 0 to 0.2 by 0.002, and the procedure is run again.Plots Section (Example 1b)Plots This second chart gives a nice range for the Lot Proportion Defective relative to the Probability ofAcceptance.286-6 NCSS, LLC. All Rights Reserved.
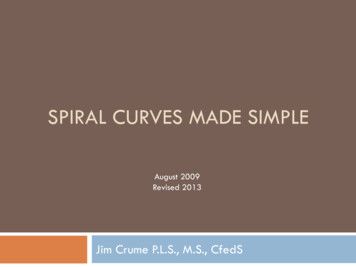
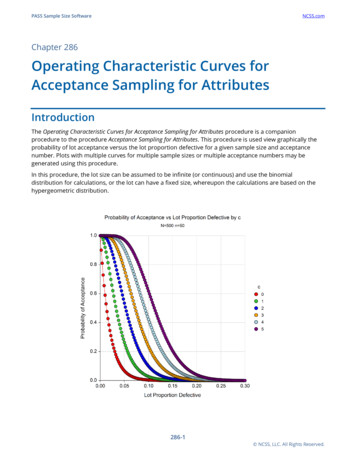
PASS Sample Size SoftwareNCSS.comOperating Characteristic Curves for Acceptance Sampling for AttributesExample 2 – OC Curves for Various Acceptance NumbersContinuing with Example 1, suppose the quality engineer would like to see various curves for differentvalues of the acceptance number. In particular, the engineer would like to examine acceptance numbers of0, 1, 2, 3, 4, 5.SetupIf the procedure window is not already open, use the PASS Home window to open it. The parameters for thisexample are listed below and are stored in the Example 2 settings file. To load these settings to theprocedure window, click Open Example Settings File in the Help Center or File menu.Design TabLot Size (N) . 500Sample Size (n) . 50Acceptance Number (c) . 0 1 2 3 4 5Proportion Defective Range . 0 to 0.3 by 0.002OutputClick the Calculate button to perform the calculations and generate the following output.Plots This plot shows the operating characteristic curve for each acceptance number.286-7 NCSS, LLC. All Rights Reserved.
PASS Sample Size SoftwareNCSS.comOperating Characteristic Curves for Acceptance Sampling for AttributesExample 3 – Validation using Kenett and Zacks (2014)Kenett and Zacks (2014), pp. 260-261, give an operating characteristic curve example in which the samplesize is 50, and the acceptance number is 1.SetupIf the procedure window is not already open, use the PASS Home window to open it. The parameters for thisexample are listed below and are stored in the Example 3 settings file. To load these settings to theprocedure window, click Open Example Settings File in the Help Center or File menu.Design TabLot Size (N) . InfiniteSample Size (n) . 50Acceptance Number (c) . 1Proportion Defective Range . 0 to 0.18 by 0.001OutputClick the Calculate button to perform the calculations and generate the following output.Plots This plot matches the plot shown in Kenett and Zacks (2014).286-8 NCSS, LLC. All Rights Reserved.
PASS Sample Size SoftwareNCSS.comOperating Characteristic Curves for Acceptance Sampling for AttributesExample 4 – Validation using Montgomery (2013)Montgomery (2013), p. 657, gives an operating characteristic curve example in which the sample size is 89,and the acceptance numbers are 0, 1, and 2.SetupIf the procedure window is not already open, use the PASS Home window to open it. The parameters for thisexample are listed below and are stored in the Example 1 settings file. To load these settings to theprocedure window, click Open Example Settings File in the Help Center or File menu.Design TabLot Size (N) . InfiniteSample Size (n) . 89Acceptance Number (c) . 0 1 2Proportion Defective Range . 0 to 0.08 by 0.001OutputClick the Calculate button to perform the calculations and generate the following output.Plots This plot matches the plot shown in Montgomery (2013).286-9 NCSS, LLC. All Rights Reserved.
PASS Sample Size Software NCSS.com Operating Characteristic Curves for Acceptance Sampling for Attributes 286-5 NCSS, LLC. All Rights Reserved. 50 3 0.52 0.00000