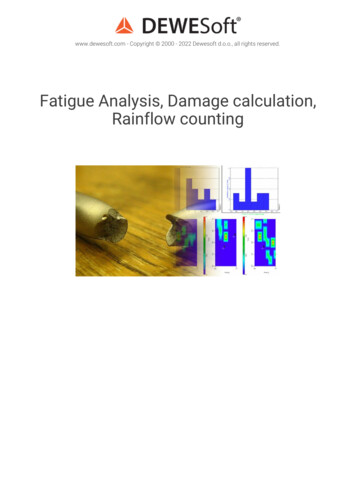
Transcription
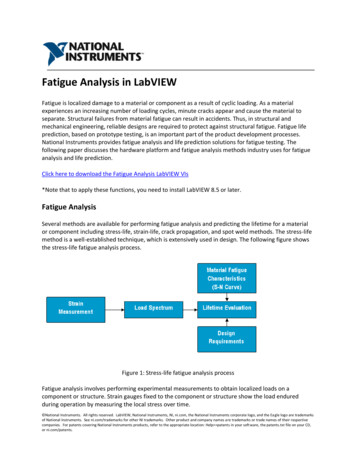
Fatigue Analysis in LabVIEWFatigue is localized damage to a material or component as a result of cyclic loading. As a materialexperiences an increasing number of loading cycles, minute cracks appear and cause the material toseparate. Structural failures from material fatigue can result in accidents. Thus, in structural andmechanical engineering, reliable designs are required to protect against structural fatigue. Fatigue lifeprediction, based on prototype testing, is an important part of the product development processes.National Instruments provides fatigue analysis and life prediction solutions for fatigue testing. Thefollowing paper discusses the hardware platform and fatigue analysis methods industry uses for fatigueanalysis and life prediction.Click here to download the Fatigue Analysis LabVIEW VIs*Note that to apply these functions, you need to install LabVIEW 8.5 or later.Fatigue AnalysisSeveral methods are available for performing fatigue analysis and predicting the lifetime for a materialor component including stress-life, strain-life, crack propagation, and spot weld methods. The stress-lifemethod is a well-established technique, which is extensively used in design. The following figure showsthe stress-life fatigue analysis process.Figure 1: Stress-life fatigue analysis processFatigue analysis involves performing experimental measurements to obtain localized loads on acomponent or structure. Strain gauges fixed to the component or structure show the load enduredduring operation by measuring the local stress over time. National Instruments. All rights reserved. LabVIEW, National Instruments, NI, ni.com, the National Instruments corporate logo, and the Eagle logo are trademarksof National Instruments. See ni.com/trademarks for other NI trademarks. Other product and company names are trademarks or trade names of their respectivecompanies. For patents covering National Instruments products, refer to the appropriate location: Help patents in your soft ware, the patents.txt file on your CD,or ni.com/patents.
A load spectrum describes the statistical distribution of the service load experienced during theoperating life of a component, represented by a stress range histogram. Load spectra represent thecomplex load history of a component or structure by a series of cyclic events with simple constantamplitude loads associated with fatigue damage.The damage contribution is calculated by comparing the experimental measurements with materialfatigue data from laboratory tests on material specimens. Fatigue analysis typically uses a material S-Ncurve, also known as a Wohler curve, to describe the fatigue characteristics of a material, where S is thecyclical stress and N is the number of cycles to structural failure.Using the fatigue characteristics, the total damage to a material or component can be estimated for aparticular load history. You can use this to evaluate the lifetime of a material or component and verify ifthe design requirements are satisfied.Stress MeasurementUse a strain gauge to record the stress on a material or component when performing fatigue analysis.Refer to the Measuring Strain with Strain Gages tutorial on the NI Developer Zone Website for moreinformation about using strain gauges.Load SpectrumThere are two methods to compute the load spectrum for a material or component: time-domain andfrequency-domain.Rainflow cycle counting is a time-domain method to convert an irregular load history into a stress rangehistogram (load spectrum). Refer to the ASTM E–1049 Standard Practices for Cycle Counting in FatigueAnalysis for more information about rainflow cycle counting. The following figure shows a rainflow cyclecounting matrix plot,which represents the load spectrum from rainflow cycle counting for a material orcomponent.2www.ni.com
Figure 2: Rainflow cycle counting matrix plotThe parallel approach in the frequency domain can also be used to obtain a load spectrum. The powerspectral density (PSD) is the most common approach to represent the service load. Based on the PSD,you can obtain the stress range probability density function (PDF) using a number of fatigue models. Thestress range PDF can be converted into a stress range histogram. There are two common empiricalmethods to estimate load spectra: the narrow band (Bendat) method and broad band (Dirlik) method.Stress-Life Based Damage EstimationFor high-cycle fatigue, you can estimate the damage to a material or component, based on the nominalstress-life method, using stress cycle counting and Palmgren-Miner linear damage summation. Thismethod assumes that all stresses in the component are less than the elastic limit at all times and thenumber of cycles to failure is large.Stress-life based damage estimation involves the following steps:Figure 3: Stress-life based damage estimation processMaterial S-N CurveAn S-N curve characterizes the fatigue behavior of materials. An S-N curve indicates the number ofcycles a material can sustain under repeated loading at a given stress level before fatigue occurs. Thefollowing figure shows a typical material S-N curve.3www.ni.com
Figure 4: A typical material S-N curveYou can produce an S-N curve by testing specimens under bending loads in a laboratory. If experimentalS-N data is unavailable, you can estimate the S-N behavior of a component using the ultimate tensilestrength and other manufacturing details. Once you determine the ultimate tensile strength of a givenmaterial, you can approximate the fatigue strength at 10e3 cycles and at the fatigue limit life on the S-Ncurve. You can refine the calculation further by considering other factors such as loading, surface finish,size, and S-N curve reliability.Palmgren-Miner RuleAn S-N curve defines the lifetime (number of cycles to failure) of a material, at given stress with constantamplitude. In practice, the service lifetime estimation of a component accounts for fatigue failure forloads of varying amplitude, represented in a load spectrum. The Palmgren-Miner rule is a linearcumulative damage estimation method for irregular and repeated loading using a material S-N curve.According to the Palmgren-Miner rule, the total damage, D, is linear sum of the damage fraction at anystress level, Si, in the load spectrum. The total damage is given bywhere Ni is the number of cycles to failure at stress level Si on the material S-N curve and ni is thenumber of cycles with stress amplitude Si in the load spectrum.You can represent the damage fraction at any stress level, Si, in the load spectrum using a damagedistribution plot, as the following figure shows.4www.ni.com
Figure 5: Damage distribution plotAnalysis VisLabVIEW Fatigue Analysis consists of a set of VIs for stress-life based fatigue analysis. Analysis functionsinclude peak and trough detection, rainflow cycle counting, rainflow histogram matrix, load spectrumestimation, S-N curve generation, and stress-life based damage estimation.These VIs are designed for use in each step of the stress-life based fatigue analysis process, as thefollowing figure shows.5www.ni.com
[ ] Enlarge ImageFigure 6: VIs used in fatigue analysis processvfa peak and trough count VI reduces a measured load signal into a sequence of peaks and troughs,which you can further use for cycle counting.vfa rainflow cycle counting VI generates a histogram of cyclic stress (load spectrum) from an irregularload history with only peaks and troughs according to the ASTM E–1049 standard.vfa rainflow classifying VI converts the histogram of cyclic stress from rainflow cycle counting into arainflow matrix.vfa load spectrum (rainflow) VI generates a load spectrum from a measured load signal using therainflow cycle counting method.vfa load spectrum (narrow band) VI generates a load spectrum from the PSD of a measured load signalusing the narrow band (Bendat) frequency-domain method.vfa load spectrum (broad band) VI generates a load spectrum from the PSD of a measured load signalusing the broad band (Dirlik) frequency-domain method.vfa base line S-N curve VI generates an S-N curve based on the ultimate tensile strength of a material.vfa S-N curve modifying VI modifies a base line S-N curve with a weighting factor by consideringloading, surface finishing, specimen size, notch effect, and reliability.vfa damage estimation VI estimates the damage caused under a given load spectrum based on amaterial S-N curve.vfa S-N curve plot VI draws a material S-N curve on an X-Y graph.6www.ni.com
vfa histogram bar plot VI draws a histogram bar plot on a 3D surface graph using load spectrum data.Click here to download the Fatigue Analysis LabVIEW VIs*Note that to apply these functions, you need to install LabVIEW 8.5 or later.7www.ni.com
Fatigue analysis typically uses a material S-N curve, also known as a Wohler curve, to describe the fatigue characteristics of a material, where S is the cyclical stress and N is the number of cycles to structural failure. Using the fatigue characteristics, the total damage to a material or component can be estimated for a particular load history.