Transcription
BONNEVILLEPOWERADMINISTRData Center DashboardDemonstrationNovember 30, 2013A Report of BPA’s Energy Efficiency Emerging Technologies InitiativePrepared forMira Vowles - Project ManagerBonneville Power AdministrationPrepared byTed BrownSr. Energy Management AnalystSeattle City Light[Report Number]Contract #54185ATION
An Emerging Technologies for Energy Efficiency ReportThe following report was funded by the Bonneville Power Administration (BPA) as an assessment of the state oftechnology development and the potential for emerging technologies to increase the efficiency of electricity use.BPA is undertaking a multi-year effort to identify, assess and develop emerging technologies with significantpotential for contributing to efficient use of electric power resources in the Northwest.BPA does not endorse specific products or manufacturers. Any mention of a particular product or manufacturershould not be construed as an implied endorsement. The information, statements, representations, graphs anddata presented in these reports are provided by BPA as a public service. For more reports and background onBPA’s efforts to “fill the pipeline” with emerging, energy-efficient technologies, visit the E3T website athttp://www.bpa.gov/energy/n/emerging technology/.AcknowledgementsThis demonstration project would not have been possible without the contributions of the pilot project participantsand the support of their respective organizations:Dean Collins, Projects Director, The Westin Building ExchangeRobert Cowan, Director of Facilities Engineering, Fred Hutchinson Cancer Research CenterJim Walker, Facilities Engineer, Fred Hutchinson Cancer Research CenterChris Lewis, Sr. Project Manager, Fred Hutchinson Cancer Research CenterSteve LeVeck, Data Center and Network Operations Supervisor, Fred Hutchinson Cancer Research CenterMark Van Horn, Manager, Data Center Services, King County Information TechnologyRick Gideon, Data Center Architect, King County Information TechnologyJavad Maadanian, Energy Management Analyst Supervisor, Seattle City LightLucie Huang, Senior Energy Management Analyst, Seattle City LightMira Vowles, Project Manager, Bonneville Power AdministrationAbstractThis project was a regional demonstration sponsored by the Bonneville Power Administration and Seattle CityLight. The funding they provided assisted each demonstration site in the purchase and installation ofhardware and software required to implement a dashboard system at its data center operation. Thesedashboards, also referred to as Data Center Infrastructure Management (DCIM) systems, track data centeroperations in real-time. They provide actionable information and analyses for management of IT equipment,space allocation, power systems, and cooling systems. BPA and SCL conducted the demonstration project toevaluate how DCIM systems could be used by operators as a tool for managing energy consumption, howthey could assist in quantification of energy savings for utility incentive programs, and to highlight bestpractices for maximizing the value of this emerging technology.BONNEVILLE POWER ADMINISTRATIONPublication Number Month Year
Table of ContentsExecutive Summary . 1Project Background . 2Dashboard Technology Overview. 2Methods . 3Demonstration Sites. 3Dashboard System Selection . 4Findings . 5Implementation . 5Dashboard Costs . 6Dashboard System Uses . 6Operational Efficiency Gains . 8Actions Taken . 10Key Dashboard Features . 10Energy Conservation Measures . 11Conclusions and Recommendations . 11Utility Incentives for Dashboard Implementation . 12Dashboard System Best Practices . 12Parameters to Monitor . 12Implementation Tips. 15Value of Dashboard Systems for Electric Utilities . 15Future Potential for Utility Use of Dashboard Systems . 15References . 17Appendix 1: Dashboard System Requirements . 18Appendix 2: The Westin Building Exchange Summary . 19Appendix 3: Fred Hutchinson Cancer Research Center Summary . 21Appendix 4: King County Government Data Center Summary . 23BONNEVILLE POWER ADMINISTRATIONPublication Number Month Year
Executive SummaryThe Bonneville Power Administration (BPA) and Seattle City Light (SCL) sponsored the Seattle City Light DataCenter Dashboard Demonstration, a regional demonstration project, to fund and assist three demonstration sitesin the purchase and installation of hardware and software required to implement a dashboard system at each oftheir data center operations. These dashboards, known within the sector as Data Center InfrastructureManagement (DCIM) systems, can track information technology (IT) equipment status and can provide actionableinformation and analyses for management of IT equipment, data center space, power, and cooling.BPA and SCL conducted the demonstration project to develop publicly-available references and to identify bestpractices in the implementation of this emerging technology as a tool to optimize data center operations andenergy consumption. The project had the additional objective of outlining benefits for utility efficiency programsthat accrue from adoption of dashboard systems in data centers. The pilot also sought to determine whetherplacement of a physical dashboard monitor in the data center would have any effect on operators’ energyconsumption. The pilot approached this as a very open-ended exercise to see how data center operators could orwould use a dashboard system to optimize their operations.Because most of the participants in this pilot represented the facilities function of their respective organizations,results primarily focused on increasing the efficiency of data center cooling systems. Two of the three sitesparticipating in this pilot succeeded in producing significant cooling system energy savings. The site that has notachieved energy savings to date is in the process of implementing a charge-back mechanism and accountingsystem for each business unit utilizing its data center. It will use this system to encourage virtualization anddeployment of only those servers that are actually needed. The site’s staff expects to reduce the physical servercount by 5% to 10% through use of the dashboard to better manage equipment use in the data center.The pilot illustrates that a dashboard system is a very effective tool for facility operators. While these systems didnot provide direct control of the data center cooling systems, they did empower motivated facility operators withthe data needed to effectively optimize energy use without negatively impacting reliability of the data center. Thesystems proved very effective in enabling operators to document operational savings to management andprovided confirmation of the maintenance or improvement of desired environmental conditions. As another keybenefit, the use of a dashboard system also facilitated measurement and verification of efficiency measures inthese pilot sites, as well as at other data centers that have implemented efficiency measures. In one case, thefacility operator would not have pursued efficiency measures without the verification of performance provided by adashboard system.Despite these benefits, SCL does not currently plan to offer incentives solely for implementation of a data centerdashboard because a monitoring dashboard still relies on intervention by the facility operator to act on the systemdata and to implement efficiency measures. On the other hand, installations of dashboards that directly controlcooling systems are eligible for incentives under SCL’s custom incentive program. Those incentives are based onthe expected kilowatt hour (kWh) energy savings from using a control system that better matches cooling systemoperations to the actual cooling load of the data center. Monitoring-only dashboard costs are, however, eligible forinclusion in the calculation of incentive funding for efficiency efforts that include installation of a dashboard alongwith other measures, such as hot/ cold aisle separation.The dashboard systems have significant potential for future utility program use in estimating savings from ITequipment efficiency measures; most IT equipment currently in use does not scale power consumption with actualcomputer utilization. Development of new technologies for power management of IT equipment will likelynecessitate more granular power monitoring in order to offer utility incentives appropriate for encouragingadoption of power management technologies.Ultimately, each participant in this pilot indicated that the use of a dashboard system enabled him/her to moreefficiently operate his/her data center. These systems centralize data that is currently stored in disparate formats,or not being collected at all. They enable an organization to focus more on optimizing operations and utilization oftheir data center.BONNEVILLE POWER ADMINISTRATION1Publication Number Month Year
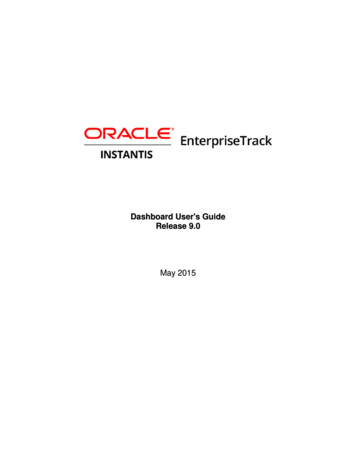
Project BackgroundData center and information technology (IT) operations are significant consumers of energy throughout the UnitedStates and in the Pacific Northwest. According to research conducted in 2013 by the Northwest Power andConservation Council, enterprise and mid-tier data center loads in the region exceed 300 megawatts, and couldnearly double in the next decade. This project was intended to investigate how utilities can become moreengaged with data center operators, while providing a tool to encourage, verify and document higher data centerefficiency. Learning the manner in which data center operators and utilities can best leverage dashboardtechnology to increase efficiency will significantly benefit the region’s power supply.Figure 1: Northwest Power and Conservation Council projected load growth of enterprise and mid-tier datacentersDashboard Technology OverviewSeveral stakeholders are typically responsible for a data center’s operations. In most organizations, responsibilityfor the data center tends to be divided among two or three primary stakeholders. IT is responsible for servers,networking, storage, and software applications running in the data center. The facilities group is usuallyresponsible for the power and cooling infrastructure of the data center. The third group of stakeholders, whoselevel of involvement varies by organization, includes the finance or executive management team.Data Center Infrastructure Management (DCIM) or dashboard products currently available tend to serve onegroup very well and are less than optimal for the other stakeholders. The “holy grail” for dashboard systems wouldbe a single application that captures the metrics and key performance data desired by each of these groups. TheDCIM market is rapidly moving to address this need, but commercial DCIM applications still tend to be those builtfor either IT or facilities groups. While additional modules or connections to other applications are often availableto address the needs of other data center stakeholders, they still frequently focus on only one organizational needin the application.BONNEVILLE POWER ADMINISTRATIONPublication Number Month Year2
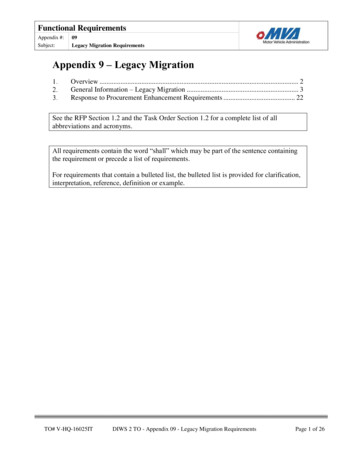
DCIM tools monitor, measure, manage and/or control data centerutilization and energy consumption of all IT-related equipment(such as servers, storage and network switches) and facilityinfrastructure components (such as power distribution units[PDUs] and computer room air conditioners [CRACs]).*EnvironmentalMonitoringAssetSpace / CapacityManagementPlanning*Gartner Research definitionFigure 2: Dashboard/DCIM definition and scopeThe table below illustrates examples of organizational units, their typical areas of responsibility in managing thedata center, and a small sample of dashboard applications with a primary focus on the needs of each group.OrganizationalUnitDCIM UsesExampleApplicationsIT / Operations / FinanceFacilitiesAsset managementCapacity managementNetwork utilizationPower & environmental monitoringAlarmingAlarmingControl of HVAC / power infrastructurePower & environmental monitoringTrending of data pointsCA TechnologiesEmerson – Trellis / IBMNlyteRaritan DC TrackBuilding Management System “Add-ons”Automated Logic Corp., ATS, JCI, SiemensAPC - StruxureWareEmerson Site ScanFieldViewSynapsenseVigilentTable 1: Dashboard functionality and example applicationsMethodsSeattle City Light (SCL) recruited sites to participate in the demonstration based solely on an agreement that theywould report on their experiences in the selection and use of a dashboard system. SCL did not require the sites toimplement energy efficiency measures to qualify for participation in the pilot. Each site received funding ofapproximately 25% - 45% toward the cost of its dashboard system. The demonstration had as its end goal theprovision of qualitative information about the uses of dashboards for data center energy management and theiruses in support of utility incentive programs.Demonstration SitesSCL approached a number of prospective sites about participation in the pilot. It had difficulty identifying sites inthis sector that would be willing to publish results and to meet timeline goals for the demonstration project, andultimately, had to extend timelines several times in order to complete the pilot. This reflects the pressures andconflicting priorities faced by data center operators in maintaining day-to-day support of an organization’scomputing needs with the desire to better manage data center operations.BONNEVILLE POWER ADMINISTRATIONPublication Number Month Year3
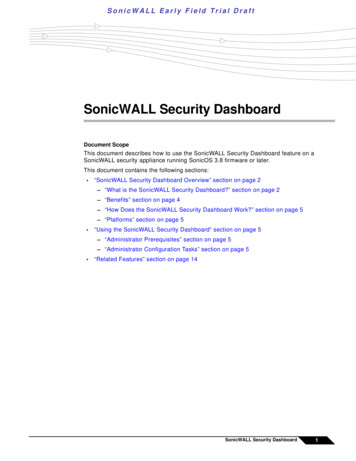
Seattle City Light ultimately selected the following three sites for this pilot project: The Westin Building Exchange Colocation suiteFred Hutchinson Cancer Research CenterKing County Government Data CenterFacilities personnel primarily represented two organizations participating in the pilot; the IT operations sectionprimarily represented the third organization.Dashboard System SelectionEach site developed its own criteria for selection of the dashboard system that would be implemented. However,each participant’s system had to be able to capture a minimum prescribed set of environmental and powerconsumption parameters (see Appendix 1) to participate in the pilot. Each site was also required to post aphysical display monitor of the dashboard in the data center or in an area visible to data center operators/stakeholders (IT staff, customers).The sites used these dashboards to provide tracking of energy consumption by end use (IT equipment andHeating, Ventilation, & Air Conditioning (HVAC) systems) within the data center. SLC also required each site tohave dashboard systems that would track environmental conditions in the facility as well as weather conditions.Tracking these factors through the dashboard system allows for analysis of independent variables, such asweather, on HVAC system operations. Tracking environmental conditions in the data center facilitates analysis ofhow changes in set points can impact HVAC and IT energy consumption.Trending energy consumption of IT equipment, especially by Power Distribution Unit (PDU) or individualequipment Rack Power Distribution Unit (rPDU), provides the capability to analyze energy conservation measuresat the rack or device level.Each organization chose its dashboard system based on the manner in which systems are currently designed andsold in the marketplace. The participants representing facilities departments installed dashboards that wereextensions of systems provided by vendors of building management systems. The organization represented bythe IT operations group deployed a dashboard primarily designed for space and asset management that hadbeen merged with a separate application designed to track power and cooling systems.Each participant chose a system that provides a graphical representation of the data center’s floor plan displayingkey indicators of real-time power usage and environmental conditions.BONNEVILLE POWER ADMINISTRATIONPublication Number Month Year4
Figure 3: Westin Building Dashboard floor plan viewSome dashboards include the ability to graphically display rack and/or power utilization to quickly represent thestatus of data center capacity to stakeholders.Figure 4: King County Data Center Floor Plan GraphicFindingsImplementationInstallation of dashboard systems can be quite complex. The more granular the data acquired by the dashboard,the greater the complexity of setting up the system. Dashboard systems that track only power and environmentalconditions are generally easier to implement than a system that includes asset, space, network, and IT equipmentutilization. This is especially true of systems requiring manual entry and configuration of assets and monitoringpoints. For example, manually collecting server and Power Distribution Unit (PDU) plug relationships andserver/network port relationships for hundreds to thousands of servers represents a significant data collection taskfor existing staff.Those dashboard systems fully installed by the vendor generally experienced smoother and fasterimplementation. Implementations that depended on existing staff and involved documentation of asset detailsoften experienced delays due to conflicting organizational priorities. Centralization of these details greatlyenhanced an organization’s ability to manage the data center, but creating that database while maintainingoperations of the facility was no small task.Integration of dashboard data from external sources also presented some difficulties for incorporation intodashboard systems. Despite the use of open communication protocols, operators reported occasional difficultiesimporting and maintaining data feeds from existing building sensors into their dashboard systems.BONNEVILLE POWER ADMINISTRATIONPublication Number Month Year5
One participant stated that a dashboard system of some sort should be a standard practice or a requirement foroperating a reliable data center. Participation in the pilot did require each site to deploy additional environmentaland power monitoring sensors above those they would have utilized on their own. Several of the initial monitoringplans specified just a few wall-mounted temperature sensors located in the data center space. The pilot requiredmonitoring of space temperatures at the server rack inlet and outlet, which allowed operators to better manageand optimize operation of their cooling systems to meet cooling requirements of the IT equipment. At theconclusion of the study, all sites indicated that they felt the additional sensors were worthwhile and that theyincreased the value and usability of their systems.Dashboard CostsThe cost of implementing a dashboard system is very difficult to quantify. The wide variation in types of systemsand pricing models employed by manufacturers makes it virtually impossible to evenly compare costs. In additionto the capital expenses, implementation can be very time-consuming and can impose additional hidden costs,particularly in cases in which an organization’s existing staff will complete the bulk of the dashboard installation.An installation that is completed 100% by a system vendor at a high initial capital cost may have a lower total costthan one installed by internal staff.The table below presents system costs broken out on per-square-foot and per-monitoring-point bases fordashboard installations funded by this project, as well as for one other DCIM demonstration project previouslyfunded by Seattle City Light. Examining dashboard system costs on the basis of data center size or number ofpoints monitored highlights the wide range of costs for these systems.Data Center TypeCost per SquareFootCost perMonitoring PointColocation data center; all-inclusive for hardware andsoftware 19.46 596Enterprise data center; 3 years of software maintenanceincluded 13.29 1,049Enterprise data center; 3-year agreement for 125 racks –monitors only IT equipment. Cooling power & statusmonitored separatelyEnterprise data center; leverages existing buildingmanagement system 8.67 694 7.20 1,385Table 2: Dashboard system cost breakdownDashboard System UsesThe participants in this pilot consisted primarily of the facilities and IT operations departments of their respectiveorganizations. Not surprisingly, most dashboard system uses revolved around optimization of environmentalconditions (cooling) of the data center.The Westin Building facilities management team used its dashboard as the basis for a comprehensive airflowoptimization project. This effort included installation of hot and cold aisle separation and adjustment of set points(increased supply air temperatures). Without the monitoring of data center operations provided by the dashboard,these measures would never have been implemented. The presence of the dashboard system allowed the facilityto optimize operations while ensuring the maintenance of environmental conditions in accordance with theService Level Agreements (SLAs) that are part of the lease agreement between the Westin and its customers.The dashboard also provided verification of improved performance and energy savings to The Westin Buildingmanagement and Seattle City Light.BONNEVILLE POWER ADMINISTRATIONPublication Number Month Year6
Verification of the efficiency gains has led The Westin Building management to expand adoption of the dashboardto other data center spaces it operates. It is also pursuing additional efficiency measures and utility incentivesbased on the successes documented through the pilot dashboard installation.Westin Suite 2020 Data Center Energy Use160140Start of Suite 2020 energymanagement projectCondenser control changesto "summer" schedule120kW100806040Completion of Suite 2020containment project2002/1/12 0:00 3/2/12 0:00 4/1/12 0:00 5/1/12 28/120:0010/28/120:0011/27/120:0012/27/120:00TOTAL CRU Energy Use kWFigure 5: CRAC Power Trend data provided by The Westin Building dashboard for verification of energy savingsKing County’s data center greatly valued the visibility the dashboard provided into real-time data centeroperations by IT and operations staff from offsite locations. King County’s data center is in a leased facility outsideof the main county offices. It is staffed 24x7 by county IT operations staff, but many stakeholders and managersof the data center work in offices not located at the facility. Their ability to access real-time operational detailswhen not physically on-site has simplified the process of managing the facility, and has improved effectivetracking of operations. IT managers use the dashboard to cross-reference electrical charges from their landlord,manage capacity and IT equipment deployment, and to track power usage.The Fred Hutchinson Cancer Research Center (FHCRC) installed its dashboard as part of a new data centerbuild-out in an existing building. The facilities staff used the dashboard extensively in the commissioning processto optimize operations of the supply fans. Once operational, the data center facilities staff used the dashboard toinstitute a supply temperature reset strategy to further reduce airflow and to provide additional use of outside air“free cooling” in the data center.The IT staff at FHCRC also uses the dashboard to assist in capacity planning and to assist in decisions regardingphysical server deployment in the data center. IT has been using the dashboard for capacity management, spaceplanning, and tracking utilization.FHCRC also reported that use of the physical dashboard monitor at the data center has been a key element incommunicating the story of the data center’s efficiency and reliability to management and stakeholders. As a highprofile cancer research center, FHCRC conducts an average of two data center tours per week. Its dashboard isnow the focal point for these tours. It provides a concise, detailed view of the data center’s role in supporting itscore research work.Bob Cowan, Director of Facilities at FHCRC, reports:“We believe we have one of the most energy efficient data centers in the world and the dashboard allows us todemonstrate that and to even improve upon the inherent energy efficiency in the design. We’ve had over twoBONNEVILLE POWER ADMINISTRATIONPublication Number Month Year7
hundred IT and facilities specialists tour the data center and the starting point is always the dashboard; it allowsthe story to be told, the energy efficiency to be shown, and the design concepts to be demonstrated in onegraphically pleasing way. We believe our data center will set the standard for the future, and the dashboard iscentral to this design shift that is shaping the future of data centers.”Figure 6: Fred Hutchinson Dashboard GraphicOperational Efficiency GainsThis pilot revealed themes of better tracking and centralization of information about each data center. Each sitereported that its dashboard greatly improved its ability to manage and track data center operations andperformance. Personnel spent less time physically walking the floor of the facilities to monitor operations. Thepresence of a dashboard system greatly enhanced the accuracy and consistency of data collection from eachfacility.Access to more readily-accessible information about each facility has facilitated the examination of opportunitiesto improve operations and efficiency. The dashboards have also simplified and enhanced the tracking andreporting of key operational metrics about the data centers to participants’ executive management teams.BONNEVILLE POWER ADMINISTRATIONPublication Number Month Year8
Figure 7: Quarterly report of data center environmental conditions provided by King County dashboardThe dashboards’ detailed data about HVAC system operations and the data center environment provide earlywarnings for potential issues with equipment/space conditions. Dean Collins, Project Director at The WestinBuilding, reported “I can tell by looking at the dashboard if a tenant has left a door open in the cold aisle.”Figure 8: Tabular view of aisle temperatures from The Westin Building dashboardBONNEVILLE POWER ADMINISTRATIONPublication Number Month Year9
The dashboards also facilitate visualization of the potential impacts of new equipment deployments and quickassessment of the impacts of operational changes in the data center. Participants identified the ability to quicklygenerate reports and to trend operational parameters over user-selected time intervals as key benefits of thedashboard systems.Actions TakenAll of the participants have integrated use of the dashboard into daily management of their data centers. They areall more closely monitoring their facilities’ energy use now that it is part of their stream of operational data. Each ofthe data centers is monitoring PUE* (Power Usage Effectiveness) in real time. Sudden changes in the PUE of afacility can indicate cooling syste
Data Center Dashboard Demonstration November 30, 2013 A Report of BPA's Energy Efficiency Emerging Technologies Initiative Prepared for . hardware and software required to implement a dashboard system at its data center operation. These dashboards, also referred to as Data Center Infrastructure Management (DCIM) systems, track data center