Transcription
Presentation Title inFirstQuarter 2021Title CaseEarningsPresentationPresentation subtitleinsentence casePresenter NameEvent namexx Month 201x 201X Virtu Financial. All rights reserved. Not to be reproducedor retransmitted without permission. Compliance #XXXX-XXXX 2021 Virtu Financial. All rights reserved.
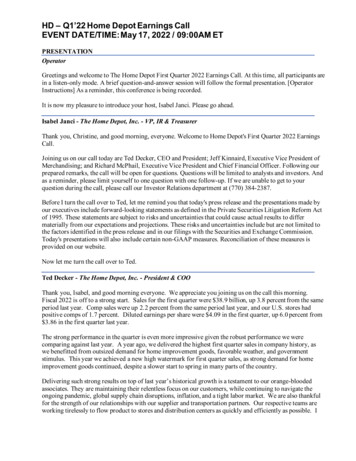
First Quarter HighlightsShare repurchase authorization increased by 300 millionAdj. NTI1Normalized Adj. EPS1 728.0M 2.041Q 2021 Highlights Record Adj. EBITDA1 margin All-time high quarterly VES Adj. NTI1Adj. NTI/day1Adj. EBITDA1 11.93M 564.7M Market making continued strong performance drivenby positive environment and growth initiatives Generated 57 million of Adj. NTI1 from organicgrowth initiatives – 8% of total firm Adj. NTI1Debt to LTM Adj. EBITDA1Adj. EBITDA Margin1,21.0x77.6%See endnotes at end of this supplement Adding 300 million to existing 170 million sharerepurchase program – 5.4 million shares ( 151million) repurchased as of 4/30/2132
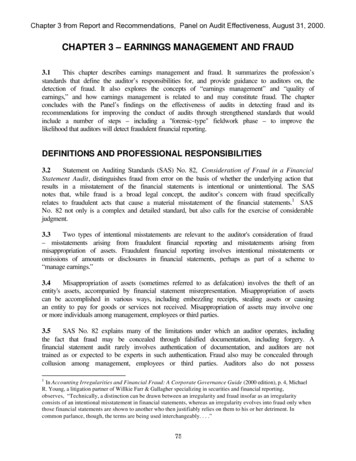
Key Financial MetricsSustained performance elevated by growth initiatives and long-termsecular trends1Q 2020( M)Total Adjusted Net Trading Income1Daily Average Adj. NTI 1Market Making Adj. NTIMarket Making Daily Average Adj. NTI2Execution Services Adj. NTIExecution Services Daily Average Adj. NTIAdjusted Operating Expenses 1Adjusted EBITDA1Adjusted EBITDA Margin 3Long Term Debt (at end of period)2Q 20203Q 20204Q 2020Full Year20201Q 20211Q 2021 vs4Q 20201Q 2020 784 669 362 456 2,271 728 60%- 7% 12.7 10.6 5.7 7.1 9.0 11.9 68%- 6% 88%- 10% 652 552 257 321 1,782 575 10.5 8.8 4.0 5.0 7.0 9.4 132 117 105 135 489 153 2.1 1.9 1.6 2.1 1.9 2.5 19% 18% 232 200 130 128 690 180 41%- 22% 570 486 249 344 1,648 565 64%- 1%72.6%72.6%68.7%75.4%72.6%77.6% 2.2 pts 4.9 pts 1,957 1,769 1,669 1,670 1,670 1,667- 0.2%- 15%Debt / LTM Adjusted EBITDANormalized Adjusted EPS12.2x1.4x1.2x1.0x1.0x1.0x 0%- 55% 2.05 1.73 0.81 1.18 5.76 2.04 72%- 1%Execution Services business has grown steadily, through acquisition and organic growthAverage Daily Adjusted NTI in million (excluding ANTI from KCG and ITG pre-acquisition) 9.43MM CAGR4Q17-1Q2139%4ES CAGR2Q19-1Q2126%5 7.05 3.68 2.41 1.95 0.27 1.47 1.93 2.51 0.38See endnotesat end of this supplementFY 2018FY 2017FY 2019Execution ServicesFY 2020Market Making2021 YTD3
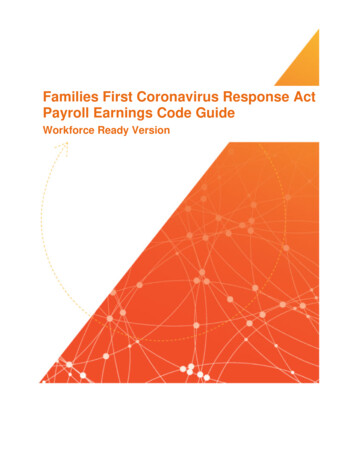
Organic Initiatives Contribute to Growthand Strong Performance 942K/dayCAGR2 120%Daily Average Adj. Net Tradingof Organic Growth Initiatives 656K/dayIncome1 296K/day 160K/day% of Adj.FY 2018FY 2019FY 20204%8%7%8% 40 75 166 57NTI1 M of Adj. NTI11Q 2021Growth in Existing MarketsEnter New Markets and Long-Term Drivers of Growth Quant-style KCG strategies in new markets and assetclasses improved over 70% per day (vs. 2020 average) Options market making improved average daily ANTIby over 50% in 1Q21 (vs. 2020 average) Continued growth of our customer-facing ETF blockfranchise desk Virtu Capital Markets raised nearly 900M of capital in1Q21 by leveraging our existing electronic executioncapabilities for ATM offerings Launched big data analytics products, Open Intell andOpen Python, for workflow and analytics clients Overhauled global client execution algos, enhancingtransparency and alignment with trader intentionsSee endnotes at end of this supplementSee endnotes at end of this supplement Designated Broker / Lead Market Maker in Bitcoin andEther ETFs in Canada4
Capital ManagementScaled business model delivers superior return on capitalSteady Payout in All EnvironmentsShare Buybacks1Dividends declared per share and adjusted earnings per share per quarterShares outstanding (million shares) and share repurchases ( million) per quarter 2.05 2.04 140 WeightedAvg. 198.1 1.73 120PeriodEnd 100ShareCount 1.18199.0197.5Shares197.0197.1195.6 80193.5 70 60 0.67 44 36 40190.0 0.34 0.31QuarterlyDividendof 0.24 0.22196.0193.0 0.81EPS 0.76195.5195.0 0.16 0.21 0.27 20 -1Q 2018 2Q 2018 3Q 2018 4Q 2018 1Q 2019 2Q 2019 3Q 2019 4Q 2019 1Q 2020 2Q 2020 3Q 2020 4Q 2020 1Q 20213Q 20204Q 20201Q 20212Q 2021 to date2187.0Superior Return on Invested 0055%60%80060036%35%35%40%29%40020%Return on Invested Capital (%)Period Average Invested Capital ( M)1,80020000%1Q 20192Q 20193Q 20194Q 2019See endnotes at end of this supplement Average of LTM Invested CapitalSee endnotes at end of this supplement1Q 20202Q 2020LTM Pro Forma Adjusted EBITDA3Q 20204Q 2020Return on Invested Capital1Q 20215
Operating Expenses and Long Term DebtDisciplined focus on expense managementFull Year Full Year20192020Adj. Operating Expense Forecast( M)1Q2021FY 2021GuidanceCash Compensation23032090270 - 280Comms & Data Processing, Ops & Admin31330473273 - 298Adjusted Cash Operating Expenses 543 623 163 545 - 57566671760 - 70 608 690 180 605 - 645Depreciation & AmortizationTotal Adjusted Operating Expenses5MaturityRateBalanceAnnualInterestMar 2026L 3.00% 110 3.4First Lien Debt - Fixed with 4.4% swap1Mar 20264.40% 1,000 44.02First Lien Debt - Fixed with 4.3% swapMar 20264.30% 525 22.6Japannext3Jan 20235.00% 32 1.64.30% 1,667 71.6Debt Description( M)First Lien Debt - FloatingTotal4LTM Adjusted EBITDA 5Debt / LTM Adjusted EBITDA 5See endnotes at end of this supplement 1,6431.0x6
GAAP Reconciliations andOther Information
Virtu Execution Services (VES) TodayGlobal platform integrates liquidity, execution, workflow & analytics solutionsProvides products and services toBy the Numbersthe largest institutions globally41/50 ofbasedon assets under management40 productsEngages globally across multiple products39%of clients engaged inmultiple regions33%of clients usemultiple products24%of clients collaboratewith VES in multipleregions and products50 countries250 Facilitates trading through various service offerings11,000 ITG NetConnections33,000 venuesCommissionManagement Payments2,000 clientsVirtu “Velvet Rope”Initial offering with 4 clientsand 3 dedicated employeesJan 2016See endnotes at end of this supplementKCG Acquisition4Q17ANTI/day1 0.5MJuly 2017ITG Acquisition2Q19 – 4Q19 1.7MMarch 2019ANTI/day1Today1Q21 ANTI/day1 2.5MMarch 20218
Share Count Roll Forward(M shares)PF shares outstanding as of 9/30/2020Total Shares1197.14Q 20 Shares repurchased(1.4)4Q 20 Vested shares (netted)(0.1)PF shares outstanding as of 12/31/20201Q 21 Shares repurchased1Q 21 Granted shares1Q 21 Vested shares (netted)PF shares outstanding as of 3/31/2021195.6(2.3)1.9(0.2)195.02Q 21 Shares repurchased to date(1.6)2Q-4Q 21 Additional shares repurchasedTBD2Q-4Q 21 Scheduled vested shares (netted)PF shares outstanding as of 12/31/2021See endnotes at end of this supplementShare count roll forward does notinclude actual or anticipated sharerepurchases after 4/30/20210.2193.79
Major Market Metrics1Q 20202Q 20203Q 20204Q 2020FY 2020Q1 20211Q 2021 v4Q 20201Q 2021 v1Q 202010,97212,3529,94210,45410,92414,650 40% 34% 96%Market Metrics (Average Daily)Volume MetricsUS Equity Consolidated Volume (mm shares)U.S. OTC Equity Volume (mm notional)1,9391,7291,4982,0431,8003,809 86%IBKR Retail Equity Volume (mm shares)9661,0451,3781,8991,2165,019 164% 420%OCC ADV (mm contracts)28.028.229.532.229.542.0 30% 50%- 21%CME FX ADV (k contracts)1,078725829818861850 4%Hotspot ADV FX (mm notional)43,53031,75330,20833,63534,72436,889 10%- 15%Volatility MetricsS&P 500 Index Realized Volatility57.331.917.016.430.415.8- 4%- 72%SX5E Realized Volatility47.333.019.521.330.113.6- 36%- 71%NKY Realized Volatility38.128.515.714.524.120.1 38%- 47%- 78%- 49%CVIX Realized VolatilityGS Comm Realized VolatilityNumber of Trading DaysSee endnotes at end of this supplement146.446.774.136.875.632.1- 13%16.336.113.110.819.08.4- 23%626364642536110
GAAP Income StatementIncome Statement( mm)FY 2018FY 201911Q 20202Q 20203Q 20204Q 2020FY 20201Q 2021 1,267 912 802 744 441 505 2,493 708831 1,879 1,517 1,001 906 656 677 3,239 1,013Brokerage, exchange, clearance fees and payments for order flow, net376387174204196185759259Communications and data processing1762095556525121452Employee compensation and payroll taxes2163841701213666394105Interest and dividends expense1421584129272812624Operations and administrative67104272225219526Depreciation and amortization6166171717166717Amortization of purchased intangibles and acquired capitalized software2671191918187418Termination of office leases23660009101Debt issue cost related to debt refinancing and prepayment1241413102292Transaction fees and expenses112600203(0)Trading income, netCommissions, net and technology servicesInterest and dividends incomeOtherTotal RevenuesFinancing interest expenseTotal Operating ExpensesIncome (Loss) Before income taxesProvision for income taxes (benefit)Net Income (Loss)See endnotes at end of this supplement72122262220208819 1,182 1,633 534 501 404 417 1,856 523 696( 116) 466 405 253 260 1,383 49076(12)7869536226281 620( 104) 388 335 200 198 1,121 40911
GAAP Balance SheetAssets( M)3/31/2021Liabilities and Equity( M)Cash & cash equivalents899Short term borrowingsCash and securities segregated under federal regulations123Securities loanedSecurities borrowed1,384Securities purchased under agreements to resell363/31/20212401,192Securities sold under agreement to repurchasePayables to broker dealers and clearing organizationsReceivables from broker dealers and clearing organizations1,656Payables to customersFinancial instruments owned, at fair value3,906Financial instruments sold, not yet purchased, at fair value4101,0793472,984Receivables from customers516Accounts payable and accrued expenses and other liabilities386Property, equipment and capitalized software (net)110Operating lease liabilities299Operating lease right-of-use assets252TRA payment liability271Goodwill1,149Intangibles (net of accumulated amortization)436Deferred tax assets183Other assets241Total Assets 10,891Trading Capital( M)Total Liabilities 8,846Equity2,044Total Liabilities and Equity 10,891 8,520Sum of Trading LiabilitiesSee endnotes at end of this supplement1,6363/31/2021Sum of Trading AssetsTotal Trading CapitalLong-term borrowings1 6,254 2,26612
Adjusted EBITDA & Normalized Adjusted EPS(excludes ITGprior to 3/1/19)Adj. EBITDA / Adj. EPS( M)Income (Loss) Before income taxesFY 2018FY 201911Q 20202Q 20203Q 20204Q 2020FY 20201Q 2021 696( 116) 466 405 253 260 1,383 490( ) Financing interest expense72122262220208819( ) Debt issue cost related to debt refinancing and prepayment1241413102292( ) Depreciation and amortization6166171717166717( ) Amortization of purchased intangibles and acquired capitalized software2671191918187418 867 183 532 475 318 315 1,640 54685.0%18.8%67.9%71.1%87.7%69.1%72.2%75.0%( ) Severance111034(0)33102( ) Transaction fees and expenses112600203(0)( ) Termination of office leases23660009101( ) Share-based compensation35512617(5)226013( ) Reserve for legal matters214(1)(0)034EBITDAEBITDA Margin( ) Coronavirus one time costs & donations(-) OtherAdjusted EBITDA--300150(340)2(1)(5)(70)(8)(83)(1) 620 432 570 486 249 344 1,648 56560.8%44.3%72.6%72.6%68.7%75.4%72.6%77.6%(-) Financing interest expense72122262220208819(-) Depreciation and amortization6166171717166717 487 244 527 447 212 308 1,494 528Adjusted EBITDA MarginNormalized Adjusted Pre-Tax Income(-) Normalized provision for income taxesNormalized Adjusted Net IncomeWeighted average fully diluted shares outstandingNormalized Adjusted EPSSee endnotes at end of this supplement112591261075174358127 375 186 400 340 161 234 1,135 402191.3192.6195.0197.1198.1197.5196.9197.0 1.96 0.96 2.05 1.73 0.81 1.18 5.76 2.0413
Trading Capital and Invested CapitalInvested Capital( M)As of:Trading Capital(-) Cash reserved for operations, taxes payable, and other accrued andunpaid liabilities3Invested Capital 2See endnotes at end of this 8)1,80814
Adjusted Net Trading Income ReconciliationOperating segmentsAdjusted Net Trading Income Reconciliation( M)Market Making1Q 20202Q 20203Q 20204Q 20201Q 23)(15)(19)(16)(12)(17)6525522573215751Q 20202Q 20203Q 20204Q 20201Q 2021Trading income, net(0)(1)(1)3911Commissions, net and technology services170148124105178Brokerage, exchange, clearance fees and payment for order flow,net(37)(31)(19)(9)(36)Trading income, netCommissions, net and technology servicesBrokerage, exchange, clearance fees and payment for order flow,netInterest and dividends, netAdjusted Net Trading IncomeAdjusted Net Trading Income Reconciliation( M)Interest and dividends, netExecution Services(0)(0)(0)(0)01321171051351531Q 20202Q 2020Total3Q 20204Q 20201Q 2021Trading income, net802744441505813Commissions, net and technology 5)(20)(16)(13)(17)784669362456728Adjusted Net Trading IncomeAdjusted Net Trading Income Reconciliation( M)Brokerage, exchange, clearance fees and payment for order flow,netInterest and dividends, netAdjusted Net Trading IncomeSee endnotes at end of this supplement15
Adjusted Net Trading Income ReconciliationOrganic growth initiativesAdjusted Net Trading Income Reconciliation( M)2018Organic Growth Initiatives201920201Q 2021Trading income, net367724662Commissions, net and technology services7112313Brokerage, exchange, clearance fees and payment for order flow,net(2)(9)(88)(12)Interest and dividends, net(1)(4)(15)(6)Adjusted Net Trading Income407516657See endnotes at end of this supplement.16
Adjusted Operating Expense ReconciliationAdjusted Operating Expenses Reconciliation( M)FY 20191 FY 20201Q 20202Q 20203Q 20204Q 20201Q 2021Employee compensation and payroll taxes 170 121 36 66 105 384 394Operations and administrative 27 22 25 21 26 104 95Communications and data processing 55 56 52 51 52 209 214Depreciation and amortization 17 17 17 16 17 66 67( 4) 0( 3)( 3)( 2)( 103)( 10)( 26)( 17) 5( 22)( 13)( 51)( 60)( 8) 1( 0)( 1)( 4)( 1)( 8) 232 200 130 128 180 608 690Less:SeveranceShare-based compensationOtherAdjusted Operating ExpensesSee endnotes at end of this supplement.17
DisclaimerCautionary Statement Regarding Forward Looking StatementsThis presentation may contain “forward-looking statements” made pursuant to the safe harbor provisions of the Private Securities Litigation Reform Act of 1995. Statementsregarding Virtu Financial, Inc.’s (“Virtu’s”, the “Company’s” or “our”) business that are not historical facts are forward-looking statements. Forward-looking statements should notbe read as a guarantee of future performance or results, and will not necessarily be accurate indications of the times at, or by which, such performance or results will beachieved. The Company assumes no obligation to update forward-looking statements to reflect actual results, changes in assumptions or changes in other factors affectingforward-looking information, and if the Company does update one or more forward-looking statements, no inference should be drawn that the Company will make additionalupdates with respect thereto or with respect to other forward-looking statements. Forward-looking statements are based on information available at the time and/ormanagement’s good faith belief with respect to future events, and is subject to risks and uncertainties, some or all of which are not predictable or within Virtu’s control, that couldcause actual performance or results to differ materially from those expressed in the statements. Those risks and uncertainties include, without limitation: risks relating to theCOVID-19 pandemic, including the possible effects of the economic conditions worldwide resulting from the COVID-19 pandemic and governmental and other responses thereto;fluctuations in trading volume and volatilities in the markets in which we operate; the ability of our trading counterparties and various clearing houses to perform their obligationsto us; the performance and reliability of our customized trading platform; the risk of material trading losses from our market making activities; swings in valuations in securities orother instruments in which we hold positions; increasing competition and consolidation in our industry; the risk that cash flow from our operations and other available sources ofliquidity will not be sufficient to fund our various ongoing obligations, including operating expenses, short term funding requirements, margin requirements, capital expenditures,debt service and dividend payments; regulatory and legal uncertainties and potential changes associated with our industry, particularly in light of increased attention from media,regulators and lawmakers to market structure and related issues; potential adverse results from legal or regulatory proceedings; our ability to remain technologically competitiveand to ensure that the technology we utilize is not vulnerable to security risks, hacking and cyber-attacks; risks associated with third party software and technology infrastructure.For a discussion of the risks and uncertainties which could cause actual results to differ from those contained in forward-looking statements, see Virtu’s Securities and ExchangeCommission filings, including but not limited to Virtu’s Annual Report on Form 10-K, Quarterly Reports on Form 10-Q and Current Reports on Form 8-K filed with the SEC.GAAP and Non-GAAP ResultsThis presentation includes certain non-GAAP financial measures, including Adjusted EPS, Normalized Adjusted EPS, Adjusted Net Trading Income, Normalized Adjusted NetIncome, Normalized Adjusted Pre-Tax Income, EBITDA, Adjusted EBITDA, EBITDA Margin, Adjusted EBITDA Margin, Trading Capital, Adjusted Operating Expense andAdjusted Compensation Expense. Non-GAAP financial measures should be considered only as supplemental to, and not as superior to, financial measures prepared inaccordance with GAAP. Other companies may use similarly titled non‐GAAP financial measures that are calculated differently from the way we calculate such measures.Accordingly, our non‐GAAP financial measures may not be comparable to similar measures used by other companies. We caution investors not to place undue reliance on suchnon‐GAAP measures, but instead to consider them with the most directly comparable GAAP measure. Non‐GAAP financial measures have limitations as analytical tools, andshould not be considered in isolation, or as a substitute for our results as reported under GAAP. A reconciliation of non‐GAAP measures to the most directly comparable financialmeasure prepared in accordance with GAAP is included at the end of this presentation.See endnotes at end of this supplement18
End NotesThese notes refer to metrics and/or defined terms presented on:Slide 21. This reflects a non-GAAP measure. Please refer to slides at the end of this presentation for reconciliation to the equivalent GAAP measure.2. Adj. EBITDA margin is calculated as Adjusted EBITDA / Adj. Net Trading Income3. Shares repurchased calculated on a trade date basis. Average price per share: 27.77Note: # of trading days used in Adj. Net Trading Income per day calculations: 61 for 1Q21Slide 31. This reflects a non-GAAP measure. Please refer to slides at the end of this presentation for reconciliation to the equivalent GAAP measure. Prior period reconciliations gs/quarterly-results/default.aspx2. Includes MatchNow revenues prior to sale in July 20203. Adj. EBITDA margin is calculated as Adjusted EBITDA / Adj. Net Trading Income4. Market Making CAGR measures the annually-compounded rate of return of Market Making Daily Average ANTI over the 3.25-year period from 4Q 2017 (the first full quarter afterthe KCG acquisition) to 1Q 2021.5. Execution Services CAGR measures the annually-compounded rate of return of Execution Services Daily Average ANTI over the 1.75-year period from 2Q 2019 (the first fullquarter after the ITG acquisition) to 1Q 2021Note:# of trading days used in Adj. Net Trading Income per day calculations in table: 63, 62, 63, 64, 64 and 61 for 1Q20, 2Q20, 3Q20, 4Q20 and 1Q21, respectively.# of trading days used in Adj. Net Trading Income per day calculations in chart: 251, 251, 251, 253, 61 for FY 2017, FY 2018, FY 2019, FY 2020 and YTD 2021, respectively.Slide 41. This reflects a non-GAAP measure. Please refer to slides at the end of this presentation for reconciliation to the equivalent GAAP measure.2. Organic Growth Initiatives CAGR measures the annually-compounded rate of return of Organic Growth Initiatives Daily Average ANTI over the 2.25-year period from 1Q 2018 to1Q 2021Slide 51. Weighted average fully diluted shares assumes that (1) holders of all vested and unvested non-voting common interest units in Virtu Financial (“Virtu Financial Units”) (togetherwith corresponding shares of the Company's Class C common stock, par value 0.00001 per share (the “Class C Common Stock”)) have exercised their right to exchange suchVirtu Financial Units for shares of Class A Common Stock on a one-for-one basis, (2) holders of all non-voting Virtu Financial Units (together with corresponding shares of theCompany's Class D common stock, par value 0.00001 per share (the “Class D Common Stock”)) have exercised their right to exchange such Virtu Financial Units for shares of theCompany's Class B common stock, par value 0.00001 per share (the “Class B Common Stock”) on a one-for-one basis, and subsequently exercised their right to convert theshares of Class B Common Stock into shares of Class A Common Stock on a one-for-one basis. Includes additional shares from dilutive impact of options, restricted stock units andrestricted stock awards outstanding under the Amended and Restated 2015 Management Incentive Plan and the Amended and Restated ITG 2007 Equity Plan during the yearsended December 31, 2020, 2019 and 2018 as well as warrants issued in connection with the Founder Member Loan Facility (as defined in Virtu’s Annual Report on Form 10-K)during the year ended December 31, 2020.See endnotes at end of this supplement19
End Notes—continuedThese notes refer to metrics and/or defined terms presented on:Slide 5 continued2. Represents share repurchases, share count, and weighted average share count as of Apr 30, 20213. “Return on Invested Capital” is calculated as LTM Pro Forma Adjusted EBITDA divided by the LTM Invested Capital (average of the Invested Capital at beginning and end ofperiod). Pro Forma Adjusted EBITDA and Invested Capital are non-GAAP measures. Please refer to slides at the end of this presentation for reconciliation to the equivalentGAAP measures.Slide 61. Virtu entered into a 5-year fixed-for-floating interest rate swap ending January 20252. Virtu entered into a 5-year fixed-for-floating interest rate swap ending September 2024.3. 3.5 billion JPY4. Blended rate5. This reflects a non-GAAP measure. Please refer to slides at the end of this presentation for reconciliation to the equivalent GAAP measure.Slide 81. This reflects a non-GAAP measure. Please refer to slides at the end of this presentation for reconciliation to the equivalent GAAP measure.Prior period reconciliations available rly-results/default.aspxNote: # of trading days used in Adj. Net Trading Income per day calculations: 63, 190 and 61 for Q417, 2Q19-4Q19 and 1Q21, respectivelySlide 91. PF shares outstanding assumes that (1) holders of all vested and unvested non-voting Virtu Financial Units (together with corresponding shares of the Company's Class Ccommon stock, par value 0.00001 per share (the “Class C Common Stock”)) have exercised their right to exchange such Virtu Financial Units for shares of Class A CommonStock on a one-for-one basis, (2) holders of all non-voting Virtu Financial Units (together with corresponding shares of the Company's Class D common stock, par value 0.00001per share (the “Class D Common Stock”)) have exercised their right to exchange such Virtu Financial Units for shares of the Company's Class B common stock, par value 0.00001 per share (the “Class B Common Stock”) on a one-for-one basis, and subsequently exercised their right to convert the shares of Class B Common Stock into shares ofClass A Common Stock on a one-for-one basis.PF shares outstanding does not include diluted shares (e.g. options, warrants), which totaled 1.3M and 0.7M shares at March 31, 2021 and December 31, 2020, respectively,and reflects shares outstanding at a prior point in time or projected to be outstanding as of a future point in time, as opposed to a weighted average over a period.The Weighted Average Adjusted shares outstanding are 197.0M and 196.9M for the three month-ended March 31, 2021 and twelve month-ended December 31, 2020,respectively.The Weighted Average Basic shares outstanding are 122.1M and 121.7M for the three month-ended March 31, 2021 and twelve month-ended December 31, 2020, respectively.The Weighted Average Diluted shares outstanding are 123.4M and 122.3M at March 31, 2021 for the three month-ended March 31, 2021 and twelve month-ended December 31,2020, respectively.See endnotes at end of this supplement20
End Notes—continuedThese notes refer to metrics and/or defined terms presented on:Slide 111. ITG revenues and expenses included in financials beginning on March 1, 2019 close date. Prior period reconciliations available at ir.virtu.comSlide 121. Prior period reconciliations available at ir.virtu.comSlide 131. ITG revenues and expenses included in financials beginning on March 1, 2019 close date. Prior period reconciliations available at ir.virtu.comSlides 141. ITG revenues and expenses included in financials beginning on March 1, 2019 close date.2. This reflects a non-GAAP measure. Please refer to slides at the end of this presentation for reconciliation to the equivalent GAAP measure.3. Comprises cash anticipated to be used in the operations of the business, including cash anticipated to be paid to satisfy tax and compensation liabilities, payments of debtpursuant to debt covenants, as well as dividends and other distributions to equity owners.Slides 15 and 16Prior period reconciliations available at rly-results/default.aspxSlide 171. ITG revenues and expenses included in financials beginning on March 1, 2019 close date.See endnotes at end of this supplement21
Average of LTM Invested Capital LTM Pro Forma Adjusted EBITDA Return on Invested Capital 2. . Fixed with 4.4% swap1 First Lien Debt - Fixed with 4.3% swap2 Mar 2026 4.30% 525 Japannext3 Jan 2023 5.00% 32 Total 4 LTM Adjusted EBITDA 5 1,643 Debt / LTM Adjusted EBITDA 5 1.0x 71.6 Annual Interest . Normalized Adjusted EPS, Adjusted Net .