Transcription
Stillaguamish River WatershedTemperatureTotal Maximum Daily Load StudyMarch 2004Publication No. 04-03-010
This report is available on the Department of Ecology home page on theWorld Wide Web at http://www.ecy.wa.gov/biblio/0403010.htmlFor additional copies of this publication, please contact:Department of Ecology Publications Distributions OfficeAddress: PO Box 47600, Olympia WA 98504-7600E-mail: ecypub@ecy.wa.govPhone: (360) 407-7472Refer to Publication Number 04-03-010Any use of product or firm names in this publication is for descriptive purposesonly and does not imply endorsement by the author or the Department of Ecology.The Department of Ecology is an equal opportunity agency and does notdiscriminate on the basis of race, creed, color, disability, age, religion, nationalorigin, sex, marital status, disabled veteran's status, Vietnam era veteran's status,or sexual orientation.If you have special accommodation needs or require this document in alternativeformat, please contact Joan LeTourneau, Environmental Assessment Program, at(360)-407-6764 (voice). Ecology's telecommunications device for the deaf(TDD) number at Ecology Headquarters is (360) 407-6006.
Stillaguamish River WatershedTemperatureTotal Maximum Daily Load StudyPrepared by:Greg Pelletier and Dustin BilhimerWashington State Department of EcologyEnvironmental Assessment ProgramMarch 2004Waterbody Numbers: (see Table 1)Publication No. 04-03-010
This page is purposely left blank for duplex printing.
Table of contentsPageList of figures. iiiList of tables.vAbstract . viiAcknowledgements. viiiIntroduction.1Overview of stream heating processes.5Heat budgets and temperature prediction .8Thermal role of riparian vegetation .11Effective shade.11Riparian buffers and effective shade.14Microclimate - surrounding thermal environment.15Thermal role of channel morphology .17Pollutant sources .17Pollutants and surrogate measures .18Background .19Land ownership.23Forest land cover.23USFS Forest Plan.23TFW and the Forests and Fish Report .27Other regulations affecting riparian land use.28Instream flow rule for the Stillaguamish River.28Water withdrawals .30Stillaguamish Implementation Review Committee .31Applicable water quality criteria.33Water quality and resource impairments .35Seasonal variation and critical conditions.37Technical analysis.41Stream heating processes .41Current conditions.41Available water temperature data .41Stream flow data .44Hydraulic geometry .45Climate data .50Riparian vegetation and effective shade .53Analytical framework .56Calibration and verification of the QUAL2Kw model .58Loading capacity.61Load allocations .71Page i
Wasteload allocations .75Margin of safety.77Recommendations for monitoring .79References cited .81AppendicesA. Instream water temperature standard exceedances and station disposition report for the2001 Stillaguamish Temperature TMDLB. Flow data from Ecology’s gaging stationsC. Load allocations for effective shade for the Stillaguamish River, South Fork StillaguamishRiver, North Fork Stillaguamish River, Deer Creek, and Pilchuck CreekD. Load allocations for effective shade for miscellaneous perennial streams in the StillaguamishRiver watershed based on bankfull width and stream aspectPage ii
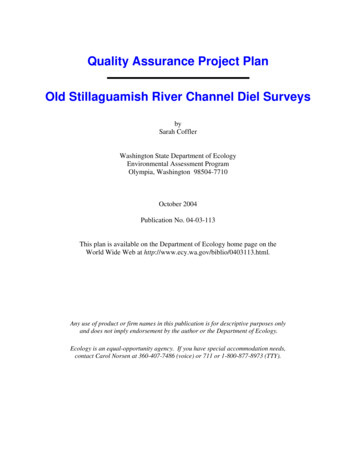
List of figuresPage1.Generalized land cover in the study area of the Stillaguamish River temperature.2.3.Conceptual model of factors that affect stream temperature.Regional solar radiation (Seattle), air temperatures (Arlington), and dewpointtemperatures (Arlington) during July-August 2001.4.Surface heat exchange processes that affect water temperature.85.Estimated heat fluxes in Deer Creek near Oso (05D01) during August 9-15, 2001.96.Water and streambed temperatures in mid-August in the North Fork StillaguamishRiver at Cicero (station 05NF02).107.Parameters that affect shade and geometric relationships.138.Relationship between angular canopy density and riparian buffer width for smallstreams in old-growth riparian stands.149.Annual average precipitation in the Stillaguamish River watershed.2110.Surface hydrogeology of the Stillaguamish River watershed.2211.Land ownership in the Stillaguamish River watershed.2512.The highest daily maximum and highest 7-day averages of daily maximum watertemperatures in the Stillaguamish River and its tributaries during 2001.3913.Locations and station ID of Ecology’s temperature monitoring stations in theStillaguamish River watershed.4214.Daily maximum water temperatures in the Stillaguamish River basin from July tomid-September 2001.4315.Flow gaging stations in the Stillaguamish River watershed.4416.Wetted width and depth versus flow during the low-flow season at all stations in theStillaguamish River basin, June - October 2001.4517.Example of the digital orthophoto quad (DOQ) for the mainstem of theStillaguamish River at the I-5 bridge and digitized wetted edges and bankfull edges.4618.The relationship between current and historic bankfull width and drainage area inthe Stillaguamish River watershed.4719.Manning's n versus flow during the low-flow season in the Stillaguamish watershed,June-October 2001.4920.Ecology and NOAA NCDC stations for climate data.5021.Regression of average daily maximum and minimum air temperatures during JulyAugust at NOAA NCDC stations at Arlington Airport and Mount Vernon 3NW.51357Page iii
List of figures (cont.)Page22.Regression of average daily maximum and minimum air temperatures along thestreams in the study area during July-August versus elevation.5223.Average daily minimum and maximum relative humidity during August 9-15, 2001along streams in the Stillaguamish River basin.5224.Current riparian vegetation height in the Stillaguamish River basin.5425.Effective shade from current riparian vegetation and potential mature vegetation inthe Stillaguamish River basin.5526.Predicted and observed water temperatures in the Stillaguamish River basin forAugust 9-15, 20015927.Predicted and observed water temperatures in the Stillaguamish River basin forSeptember 7-8, 20016028.Predicted daily maximum water temperatures in the Stillaguamish River for criticalconditions during July-August 7Q2 and 7Q106529.Predicted daily maximum water temperatures in the South Fork Stillaguamish Riverfor critical conditions during July-August 7Q2 and 7Q106630.Predicted daily maximum water temperatures in the North Fork Stillaguamish Riverfor critical conditions during July-August 7Q2 and 7Q106731.Predicted daily maximum water temperatures in Deer Creek for critical conditionsduring July-August 7Q2 and 7Q106832.Predicted daily maximum water temperatures in Pilchuck Creek for criticalconditions during July-August 7Q2 and 7Q10.6933.Load allocations for effective shade for various bankfull width and aspect of streams 72in the Stillaguamish River watershed assuming riparian vegetation height of45 meters with canopy density of 85 percent.Page iv
List of tablesPage1.Summary of watercourse segments included in this TMDL that are either on the1996 or 1998 303(d) list or known to currently not meet the water quality standard fortemperature.12.Factors that influence stream shade.133.Summary of consumptive water rights in the Stillaguamish River watershed.304.Highest daily maximum temperatures in the Stillaguamish River and its tributariesduring 2001.355.Summary of low-flow statistics for July-August at USGS gaging stations in theStillaguamish River watershed.456.Summary of hydraulic geometry relationships with flow in the Stillaguamish Riverwatershed, June-October 2001.467.Estimated daily maximum and minimum air temperatures at Mount Vernon 3NW andArlington Airport on days and weeks with the highest daily maximum temperaturesfor a median year and 90th percentile year.518.Summary of RMSE of differences between the predicted and observed dailymaximum temperatures in the Stillaguamish River basin.589.Summary of predicted daily maximum water temperatures at critical conditions in theStillaguamish River watershed.6410. Wasteload allocations for effluent temperature for NPDES dischargers.76Page v
This page is purposely left blank for duplex printing.Page vi
AbstractThe 1,770 km2 Stillaguamish River basin contains about 1,400 kilometers of anadromous salmonhabitat. The 303(d) listings for stream temperature in the basin include Deer Creek, HigginsCreek, Little Deer Creek, Pilchuck Creek, the mainstem Stillaguamish River, North ForkStillaguamish River, and South Fork Stillaguamish River.Substantial reductions in water temperature are predicted for hypothetical conditions with matureriparian vegetation, improvements in riparian microclimate, reduction of channel width, andincreases in groundwater inflows. Potential reduced temperatures are predicted to be less than thethreshold for lethality of 23 C but greater than 18 C in Class A and greater than 16 C in ClassAA waters in some or most of the segments in all streams that were evaluated.This technical assessment uses effective shade as a surrogate measure of heat flux to fulfill therequirements of Section 303(d) for a Total Maximum Daily Load (TMDL) for temperature.Effective shade is defined as the fraction of incoming solar shortwave radiation that is blockedfrom reaching the surface of the stream.In addition to load allocations for effective shade, other management activities are recommendedfor compliance with the water quality standards for water temperature including measures toreduce channel widths.Page vii
AcknowledgementsWe would like to thank the following people for their contributions to this study: Pat Stevenson, Don Klopfer, and other staff of the Stillaguamish Tribe of Indians who shareddata and provided document review. Bill Blake of the City of Arlington, Kathleen Thornburgh of Snohomish County, Kurt Nelsonof the Tulalip Tribes, Orin Barlond, and other members of the Stillaguamish ImplementationReview Committee. Jayne Carlin of the U.S. Environmental Protection Agency for review and comment on thedraft report. Ed Buchak of J.E. Edinger Associates, Inc. for review and comment on the draft report. Staff from the Washington State Department of Ecology:o Sally Lawrence for review of the draft report and coordination of the public reviewprocess for the study and drafting of the section of the report on instream flow rules.o Karol Erickson for review of the draft report and many valuable comments.o Jodie Beall for extensive field work and analysis of environmental data and review of thedraft report.o Steve Hirschey for review of sections of the draft report.o Anita Stohr for consultation on GIS and modeling, and many helpful comments on thedraft report.o Joan LeTourneau for formatting and editing the final report.Page viii
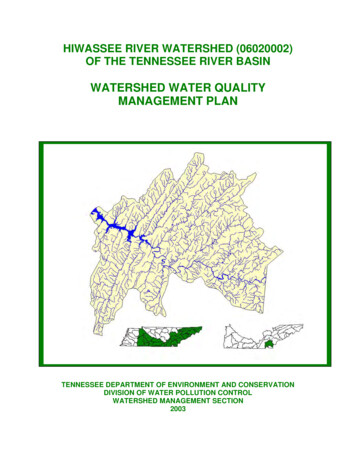
IntroductionThe Stillaguamish River basin includes portions of Snohomish and Skagit counties inWashington State (Figure 1). The Washington State Department of Ecology’s assessment of theStillaguamish watershed identified the system as a high priority for development of a TotalMaximum Daily Load (TMDL) for temperature. The purpose of the Stillaguamish RiverTemperature TMDL is to characterize water temperature in the basin and to establish load andwasteload allocations for heat sources to meet water quality standards for water temperature.Section 303(d) of the federal Clean Water Act requires Washington State periodically to preparea list of all surface waters in the state for which beneficial uses of the water – such as fordrinking, recreation, aquatic habitat, and industrial use – are impaired by pollutants. This studywas initiated because of 303(d) listings in Deer Creek, Higgins Creek, Little Deer Creek,Pilchuck Creek, the mainstem Stillaguamish River, North Fork Stillaguamish River, and SouthFork Stillaguamish River for exceeding the water quality standards for temperature (Table 1). Inaddition to the 5 segments listed in 1996 and 12 segments listed in 1998, the present TMDL alsoincludes load allocations to address 36 segments that were not listed but were documented as notmeeting the water quality standard for temperature in 2001.Table 1. Summary of watercourse segments included in this TMDL that are either on the 1996 or 1998 303(d) list orknown to currently not meet the water quality standard for courseIIP303d numberOld WBIDnumberDeer CreekDeer CreekHiggins CreekLittle Deer CreekPilchuck CreekPilchuck CreekStillaguamish RiverStillaguamish RiverStillaguamish RiverStillaguamish River, N.F.Stillaguamish River, S.F.Stillaguamish River, 5-1040Canyon CreekCanyon CreekCanyon CreekDeer CreekDeer CreekGlade BekkenJim CreekJim CreekJim CreekLittle Deer CreekPilchuck CreekPilchuck CreekPilchuck CreekStillaguamish RiverStillaguamish RiverStillaguamish River, N.F.Stillaguamish River, N.F.Stillaguamish River, N.F.Stillaguamish River, N.F.Stillaguamish River, N.F.Stillaguamish River, N.F.Stillaguamish River, S.F.Stillaguamish River, S.F.Stillaguamish River, S.F.Stillaguamish River, WA-05-10501996 303(d)listXXXXX1998 aired oldWBID XXXXPage 1
The basis and supporting citations for the 1998 303(d) listings of temperature in theStillaguamish basin are as follows:Deer Creek:Higgins Creek:Little Deer Creek:Pilchuck Creek:Stillaguamish River:Stillaguamish River, North Fork:Stillaguamish River, South Fork:Sullivan et al., 1990, multiple excursions beyond the criterion at the mouthduring 8/88.Sullivan et al., 1990, multiple excursions beyond the criterion at RM 14during 8/88.Sullivan et al., 1990, 22 excursions beyond the criterion during 8/88.Sullivan et al., 1990, 15 excursions beyond the criterion during 8/88.Thornburgh, 1996, 4 excursions beyond the criterion out of 38 samples(11%) at station PILC between 1992 and 1997.Thornburgh, 1995, excursions beyond the criterion at least once each yearbetween 1993-19953 excursions beyond the criterion out of 36 samples (3%) at Ecologyambient monitoring station 05A070 (RM 11.1) between 9/91 and 9/96.Thornburgh, 1996, 3 excursions beyond the criterion out of 38 samples(8%) at station MSAR between 1992 and 1997.Thornburgh, 1995, excursions beyond the criterion at least once each yearbetween 1992-1995 at Marine Drive.Sullivan et al., 1990, 19 excursions beyond the criterion during 8/88 atRM 38.8.Two excursions beyond the criterion at Ecology ambient monitoring station05A090 (RM 18.2) on 8/20/90 and 8/21/91.Thornburgh, 1996, 2 excursions beyond the criterion out of 10 samples(20%) at station SFGF between 1992 and 1997.Under the federal Clean Water Act, every state has its own water quality standards designed toprotect, restore, and preserve water quality. Water quality standards consist of designated uses,such as cold water biota and drinking water supply, and criteria, usually numeric criteria, toachieve those uses.Section 303(d) of the Clean Water Act mandates that the state establish TMDLs for surfacewaters that do not meet the water quality standards. The U.S. Environmental Protection Agency(EPA) has promulgated regulations (40 CFR 130) and developed guidance (EPA, 1991) forestablishing TMDLs (e.g., www.epa.gov/r10earth/tmdl.htm).The goal of a TMDL is to ensure the impaired water will attain water quality standards. ATMDL includes a written, quantitative assessment of water quality problems and of the pollutantsources that cause the problem. The TMDL determines the amount of a given pollutant that canbe discharged to the waterbody and still meet standards and allocates that load among the varioussources. If the pollutant comes from a discrete source (referred to as a point source) such as anindustrial facility’s discharge pipe, that facility’s share of the loading capacity is called awasteload allocation. If a pollutant enters a stream from a diffuse source (referred to as anonpoint source), then that share is called a load allocation.Page 2
Legendhuc wtrcrs wria05 mriversRivers and nty BoundariesCountyboundariesMt VernonWRIABoundariesWRIAboundariesLand /Wat erLand/waterWaterWaterLandoutsideWA WALandoutsideGenera lliz ed Land coverUs eGeneralizedlandSkagit CountySnohomish CountyCice spaceStanw oodDarringtonForestedForestedWhiteh orse nowJordanGraniteFa llsVerlotMarysvilleEverett0510KilometersFigure 1. Generalized land cover in the study area of the Stillaguamish River temperature TMDL.Page 3
This page is purposely left blank for duplex printing.Page 4
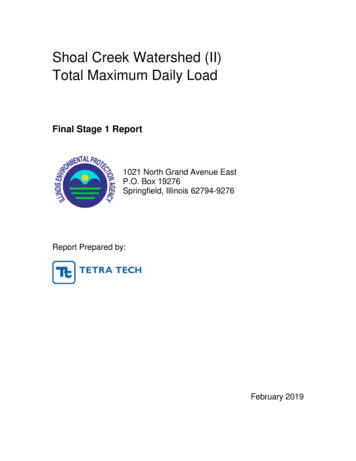
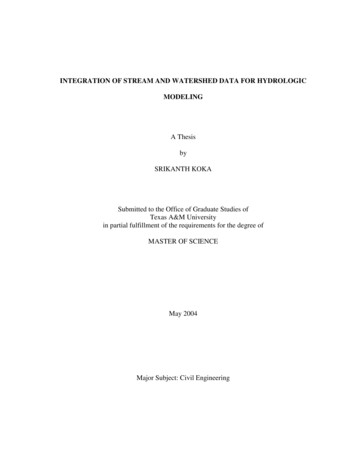
The TMDL must also consider seasonal variations and include a margin of safety that takes intoaccount any lack of knowledge about the causes of the water quality problem or its loadingcapacity. The sum of the individual allocations and the margin of safety must be equal to or lessthan the loading capacity.Overview of stream heating processesThe temperature of a stream reflects the amount of heat energy in the water. Changes in watertemperature within a particular segment of a stream are induced by the balance of the heatexchange between the water and the surrounding environment during transport through thesegment. If there is more heat energy entering the water in a stream segment than there isleaving, then the temperature will increase. If there is less heat energy entering the water in astream segment than there is leaving, then the temperature will decrease. The generalrelationships between stream parameters, thermodynamic processes (heat and mass transfer), andstream temperature change is outlined in Figure 2.Stream Temperature Conceptual Model Flow ChartC hannelM orphologyEffective ShadeBank StabilityMicroclimatesN ear Stream Disturb anceWidth:DepthSinuosityGradientSubstrateFloodpla in ConnectionFlow Volume,Flow Velocity,Groundwater InflowPoint SourcesWithdrawalsAugmentat ionM ass Transfer - M ixing ofWaterR ate Change in StreamTem peratureThermodyn amicProcessesH eat EnergyTransferHydrologyStr eam ParametersRiparianV eg etationFigure 2. Conceptual model of factors that affect stream temperature.Page 5
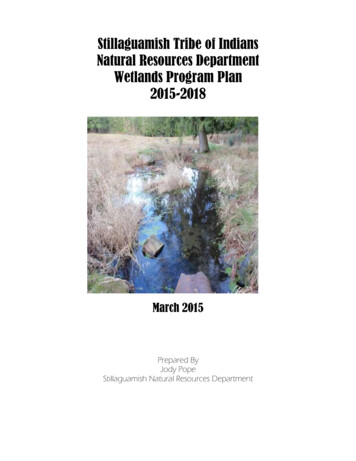
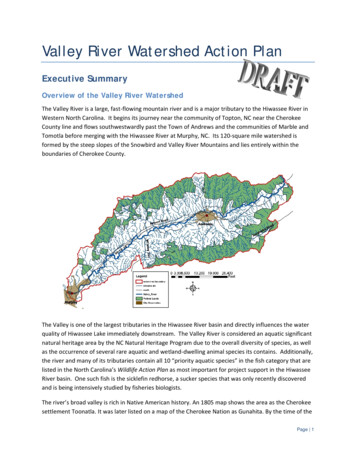
Adams and Sullivan (1987) reported that the following environmental variables were the mostimportant drivers of water temperature in forested streams: Stream depth. Stream depth is the most important variable of stream size for evaluatingenergy transfer. Stream depth affects both the magnitude of the stream temperaturefluctuations and the response time of the stream to changes in environmental conditions. Air temperature. Daily average stream temperatures are strongly influenced by dailyaverage air temperatures. When the sun is not shining, the water temperature in a volume ofwater tends toward the dew-point temperature (Edinger et al., 1974). Solar radiation and riparian vegetation. The daily maximum temperatures in a stream arestrongly influenced by removal of riparian vegetation because of diurnal patterns of solarheat flux. Daily average temperatures are less affected by removal of riparian vegetation. Groundwater. Inflows of groundwater can have an important cooling effect on streamtemperature. This effect will depend on the rate of groundwater inflow relative the flow inthe stream and the difference in temperatures between the groundwater and the stream.Regional air temperature, dewpoint temperature, and solar radiation during July-August 2001 areshown in Figure 3. Highest daily average stream temperatures would be expected during theperiod of maximum air temperatures in mid August.Page 6
400global solar short-wave (W/m2)Daily average global solar short-wave radiation /018/26/01air temperature (deg C)dewpoint temperature (deg C)30Temperature (degrees 1Figure 3. Regional solar radiation (Seattle), air temperatures (Arlington), and dewpointtemperatures (Arlington) during July-August 2001.Page 7
Heat budgets and temperature predictionThe transport and fate of heat in natural waters has been the subject of extensive study.Edinger et al. (1974) provide an excellent and comprehensive report of this research.Thomann and Mueller (1987) and Chapra (1997) have summarized the fundamental approach tothe analysis of heat budgets and temperature in natural waters that was used in this TMDL.Figure 4 shows the major heat energy processes or fluxes across the water surface or streambed.Figure 4. Surface heat exchange processes that affect water temperature.(net heat flux solar longwave atmosphere longwave back convection evaporation bed).Heat flux between the water and streambed occurs through conduction and hyporheic exchange.The heat exchange processes with the greatest magnitude are as follows (Edinger et al., 1974): Shortwave solar radiation. Shortwave solar radiation is the radiant energy which passesdirectly from the sun to the earth. Shortwave solar radiation is contained in a wavelengthrange between 0.14 µm and about 4 µm. At NOAA’s ISIS station in Seattle the daily averageglobal shortwave solar radiation for July-August 2001 was 240 watts per square meter(W/m2). The peak values during daylight hours are typically about three times higher than thedaily average. Shortwave solar radiation constitutes the major thermal input to an unshadedbody of water during the day when the sky is clear. Longwave atmospheric radiation. The longwave radiation from the atmosphere ranges inwavelength range from about 4 µm to 120 µm. Longwave atmospheric radiation dependsprimarily on air temperature and humidity and increases as both of those increase. Itconstitutes the major thermal input to a body of water at night and on warm cloudy days.The daily average heat flux from longwave atmospheric radiation typically ranges from about300 to 450 W/m2 at mid latitudes (Edinger et al., 1974).Page 8
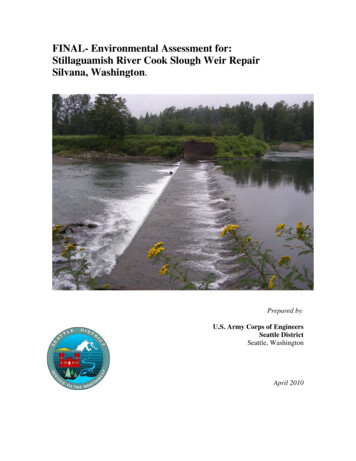
Longwave back radiation from the water to the atmosphere. Water sends heat energyback to the atmosphere in the form of longwave radiation in the wavelength range from about4 µm to 120 µm. Back radiation accounts for a major portion of the heat loss from a body ofwater. Back radiation increases as water temperature increases. The daily average heat fluxout of the water from longwave back radiation typically ranges from about 300 to 500 W/m2(Edinger et al., 1974).An example of the estimated diurnal pattern of the surface heat fluxes in the segment ofDeer Creek near Oso for the week of August 9-15, 2001 is shown in Figure 5. The dailymaximum temperatures in a stream are strongly influenced by removal of riparian vegetationbecause of diurnal patterns of solar shortwave heat flux (Adams and Sullivan, 1989). The netheat flux into a stream can be managed by increasing the shade from vegetation, which reducesthe shortwave solar flux. Other processes, such as longwave radiation, convection, evaporation,bed conduction, or hyporheic exchange also influence the net heat flux into or out of a stream.700600500netsolarlongwave atmospherelongwave backair convectionevaporationsediment conductionhyporheicsolar400longwave atmosphereheat flux (Watts/m2)300net flux200100air convection0sediment conductionevaporation-100-200hyporheic-300longwave back-400-50012:00 AM3:00 AM6:00 AM9:00 AM12:00 PM3:00 PM6:00 PM9:00 PM12:00 AMFigure 5. Estimated heat fluxes in Deer Creek near Oso (05D01) during August 9-15, 2001.(net heat flux solar longwave atmosphere longwave back air convection evaporation sedimentconduction hyporheic).Heat exchange between the stream and the streambed has an important influence on watertemperature. The temperature of the streambed is typically warmer than the overlying water atnight and cooler than the water during the daylight hours (Figure 6). Heat is typically transferredfrom the water into the streambed during the day then back into the stream during the night(Adams and Sullivan, 1989). This has the effect of dampening the diurnal range of streamtemperature variations without affecting the daily average stream temperature.Page 9
25temperature (degrees C)waterstreambed2015108/10/0212:00 AM8/10/0212:00 PM8/11/0212:00 AM8/11/0212:00 PM8/12/0212:00 AM8/12/0212:00 PM8/13/0212:00 AM8/13/0212:00 PM8/14/0212:00 AM8/14/0212:00 PM8/15/0212:00 AMFigure 6. Water and streambed temperatures in mid-August in the North Fork StillaguamishRiver at Cicero (station 05NF02).The bulk temperature of a vertically mixed volume of water in a stream segment under naturalconditions tends to increase or decrease with time during the day according to whether the netheat flux is either positive or negative. When the sun is not shining, the water temperature tendstoward the dew-point temperature (Edinger et al., 1974; Brady et al., 1969). The equilibriumtemperature of a natural body of water is defined as the temperature at which the water is inequilibrium with its surrounding environment and the net rate of surface heat exchange would bezero (Edinger et al., 1968; Edinger et al., 1974).The dominant contribution to the seasonal variations in the equilibrium temperature of water isfrom seaso
26. Predicted and observed water temperatures in the Stillaguamish River basin for August 9-15, 2001 59 27. Predicted and observed water temperatures in the Stillaguamish River basin for September 7-8, 2001 60 28. Predicted daily maximum water temperatures in the Stillaguamish River for critical conditions during July-August 7Q2 and 7Q10 65 29.