Transcription
UPDATES TO THE 2005 PUGET SOUND CHINOOK RECOVERY PLANWoody Debris Target Update of the Stillaguamish ChinookRecovery PlanProduced by: The Stillaguamish Technical Advisory Group, a subcommittee of the SWC2/8/2016Version 1.01
Adaptive Management of Woody Debris - Target Update Objectives1. Adapt wood target quantities for near-term implementation (10 years) and for desired futurecondition (natural and constructed wood quantities).2. Review and consider woody debris reference values from literature to create condition bins (i.e.;Poor, Fair, Good, Best).3. Develop monitoring objectives that support information needs to describe woody debris status,changes and implementation progress over time.The revised woody debris targets are developed around the following information categories and can bereviewed at a regular time interval; What – Woody debris target definitions and descriptions, Where – Priority locations for wood placement implementation, Why – Addresses key functions and river process that have been altered and affected byhistorical loss of wood, How – Project and placement types expected to have high performance, How much – Wood quantity by location that leads to a Desired Future Condition.Adaptive Management is future decision-making informed by baseline conditions, documented change,progress relative to goals, new science-based information, and new alternatives for action thateventually lead to Desired Future Conditions. The wood target will be adjusted every 10 years dependingon total wood and or wood jam abundance (and functions) of constructed and natural woodcomponents. Hypothetically, if natural jam count declines, then the constructed jam target (and level ofeffort) would be increased. If natural jam abundance raises the total jam count toward the desiredfuture condition, then the constructed jam target eventually might be less. This is known as the woodbudget to achieve desired future conditions and will be managed adaptively by collecting and applyingfuture monitoring information.The following table highlights the woody debris target objectives described by the current plan (SIRC2005) and the proposed targets for the second 10-year salmon recovery period (2016-2025). Theseproposed targets are recommended by the Stillaguamish TAG for approval by the StillaguamishWatershed Council.2
Table 1. TAG Recommendation to SWC for proposed updated LWD Target.WOODY DEBRISTARGET –PROJECT IMPLEMENTATION TARGET FOR 2ND 10-YEAR SALMON RECOVERYPERIOD (2016-2025)CATEGORY/CRITERIACURRENTLocations for LWD NF/SFplacementPROPOSEDNF/SF/Mainstem/Pilchuck Cr./Jim Cr./SquireCr./Boulder/French/Deer.TypeBuild engineered logELJs according to site specific design criteria.jams with 40 to 60 largeFlood Fences that may form future in-channel log jams.wood pieces per jam.Quantity51 jams in 10 years (62jams in 50 years;baseline year is 2005).122 jams in 10 years (2016-2025); See Table 4 and Map4.TargetsNumber of “approved”jams vary among 7reaches in NF/SF (Planpage 97).Number of jams vary among 16 target reaches (seeTables 3 and 4) as either 2, 4, or 8 jams/km.Priority locationsNear high Chinook use Map 4.areas in 1st/2nd priorityareas (Figure 20 in Plan,page 108).Effective functions Pool formation, sidechannels engagement,fish cover, roughness,flow routing.Pool formation, side channels engagement, fish cover,roughness, flow routing, hyporheic exchange,temperature diversity.Progress needed5 ELJs/yr.; evaluate inYear 3 and 7 of first 10years (2014).12 wood installations/year; Evaluate in year 3 and year 7of 2nd 10 years (2016-2025).Limitations/UncertaintyRisk, feasibility, hazardmanagement.Risk, feasibility, hazard management; Also, uncertainlinkage between Corridor Acquisition Plan, River ReachAssessments, and importance or sequence with respectto other Plan targets.3
ImplementationmonitoringCount ELJs w/ 40pieces.Count LWD key pieces meeting NMFS criteria as part ofwood jam or flood fence construction; Count all othersmaller pieces used for construction that contribute towood jams.EffectivenessPlacement of wood isincreasing habitat ( 5%pool area [primary &backwater], poolfrequency) within 5years.Placement of wood is increasing habitat (same as left)within 5 years. Other effectiveness or performancedetermined by project objectives related to site scour,cover, bank protection, forested island protection, flowrouting, cool water refuge creation, material storage(wood/sediment). Each project must document preproject habitat conditions.Monitoring/ReportingfrequencyAnnual count; 3-4 yr.analysis period.Annual count of wood installations and piece inventory(as built info); 3-4 yr. analysis period forimplementation; 5 year effectiveness monitoringfrequency from time of installation – Use pre-projectdata for evaluating habitat change.AdaptiveManagementaction 5% increase in poolarea in 5 years;annualized ELJ totalsdo not meet target. 5% increase in jam-formed pool area in 5 years;annualized ELJ totals do not meet target.WOODY DEBRISTARGET –DESIRED FUTURE CONDITIONSCATEGORY/CRITERIACURRENTPROPOSEDPiece quantity80 pieces/mile ( 50pieces/km).80 pieces/mile ( 50 pieces/km) for channel 40meters bankfull width; Other piece quantities forsmaller channels are based on Fox 2001.Piece size criteria50 ft length; 24 inchesdiameter; No channelsize applicability (also15 m length and 60 cmdiameter).Key pieces are 50 ft. length; 24 inches diameter (or 15m length and 60 cm diameter); LWD is at least 30 ft.length and 12 inches diameter (or 7.6 m length and 30cm diameter (USFS 1998)). Small wood is at least 2 mlength and 10 cm diameter (WFPB 2011).4
Literature sourcesNMFS 1996 (aka“Matrix of Pathwaysand Indicators”).NMFS 1996 (aka “Matrix of Pathways and Indicators”);USFS 1998; Fox 2001 or Fox and Bolton 2007.Total Jam quantity None.(natural & ELJs)Varies by reach as either 2, 4, or 8 jams/km. Total is1,274 jams from Table 3.Jam criteriaAt least 3 key pieces LWD that touch each other withminimum piece dimensions of 7.6 m length and 30 cmdiameter (Haas et al. 2003).At least 3 pieces LWD.NOTE: Other criteria for wood jams include 10 pieces(small wood criteria; WFPB 2011); 30 pieces (NOAA2015) or 100 m2 wood jam area (NOAA 2015). Thesecriteria are not consistent with wood jam datacollection in Stillaguamish watershed since 2002.Status and trendmonitoringEvery 10 years do fullwood inventory.A wood inventory will be implemented every 10 years;Census in NF/SF/Mainstem; Repeat sample reaches inPilchuck, Jim, Squire, Canyon, Upper SF, Boulder, Deer,Rollins, Grant, French every 10 years.ReportingfrequencyNone.Every 10 years; prior to wood target adaptivemanagement and regional population status review.Report updated LWD quantities and characteristics bysurvey reaches (e.g. Leonetti et al. 2015).AdaptiveManagementactionNone.Revise jam implementation target quantities based onupdated key piece deficit estimates, new ELJ jams, andnatural jams compared to wood jams targets (byreach) and relative progress among priority locationsand individual reaches.Desired Future Condition – the desired future condition as a target is based on the recognition that amore properly functioning quantity of woody debris, closer to regional reference conditions, will formmore pool habitats (some of which will be new cool water refuges), provide fish cover, retain gravelbars, shield forested islands in floodplains, create more flow pathways, improve cooling throughhyporheic exchange and increase sinuosity, side channels, and backwater edge habitats. Indicators ofwood debris recovery therefore will not only be based on the quantity of placed wood, but also basedon the weight of evidence presented by an increase in the following; Natural woody debris jams and wood loading,5
Pool count and pool frequency, Wood-formed pools, Pool habitat cover, Gravel bar storage at wood jams, Flow pathways at bankfull elevation, Channel migration leading to greater sinuosity, Backwater edge habitat, Forest cover in a more natural river corridor, and A reduction in river bank armoring.These descriptions of future improvements in the status of conditions can all be monitored withrelatively simple indicators, collected at relatively low cost, with high precision, at time intervals tosupport on-going salmon recovery information needs and adaptive decision-making.Existing ConditionsExisting conditions are described in Table 2 using condition category bins (i.e., poor, fair, good, best).These categories reflect quartiles of reference condition (an un-managed western Washington forest)based on Fox (2001) for key pieces of woody debris as defined by NMFS (1996). Table 2 reports theaverage number of woody debris jams observed by survey sites (2000-2011) based on total woodquantity defined by both the NMFS key piece criterion and the Washington Forest Practices Board(2011) watershed analysis manual. The simplified wood jam target (jams/km) by reference conditioncategory is proposed in the last column.Table 2. Existing conditions. Observed jam frequency when total wood quantity by site meets poor, fair,good, or best quantity categories based on reference conditions (Fox 2001).Average jams/km by category for Target(jams/km)CategoryPercentile ofreferenceconditions NMFS Key Piecequantity WFPB totalwood quantity*Range(jams/km) for Table 3Poor0-25th percentile1 .7 (23 sites)1 .6 (19 sites)0-2.52Fair25-50th percentile3.2 (6 sites)3.4 (4 sites)2.5-4.94Good50-75th percentile8.7 (3 sites)4.5 (3 sites)4.9-7.2Combined6
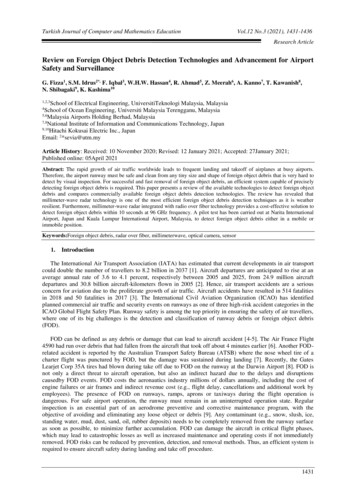
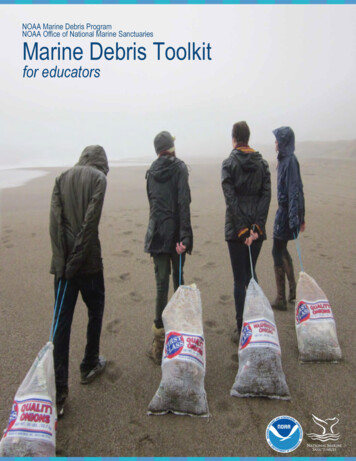
Best 75th percentile7.5 (2 site)9 (3 sites)7.2-15belowGood/Best 50th percentile8.5 (5 sites)7 (6 sites)4.9-158* Site totals are less than previous column because small wood was not measured in 2000/2001.NMFS Key Pieces are each 15 m length and at least 60 cm diameter (NMFS 1996)TFW/WFPB wood pieces are 2 m length and 10 cm diameter (WFPB 2011)Figure 1 highlights the current count of survey sites for each condition category. More than 80% ofsurvey sites are in the poor or fair categories. Even in un-managed reference forest conditions, woodydebris quantity may be low (Fox 2001). However, a poor category of wood quantity based on referenceconditions generally should only reflect the 25th percentile distribution of the reference range. Thiswood target proposal for the Stillaguamish suggests that no more than 25 percent of survey sites shouldbe in a poor condition category – the 25th percentile of our data distribution. Figure 1 also highlights aproposed future frequency (count) of survey sites that would meet the desired future condition (DFC)for wood jam quantity per kilometer stream length.Figure 1. Count of reaches that fit condition categories based on existing condition and proposeddesired future condition.Using this conceptual distribution of survey sites meeting Desired Future Conditions, actual assignmentsof future site performance (poor, fair, good, best) were proposed for river and stream locationsoverlapping the Chinook salmon spatial distribution. In Table 3, the proposed desired future condition(DFC Jams/km column) is shown alongside of each river or stream reach location and the existing7
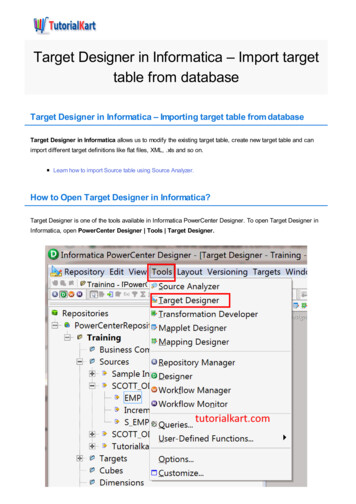
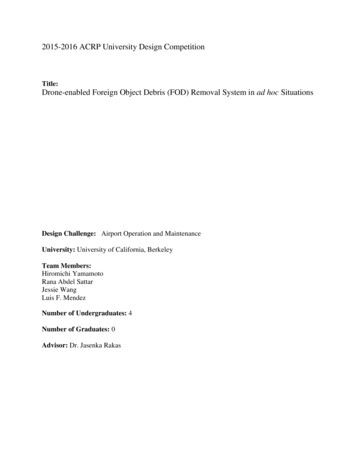
performance category compared to existing conditions for the same reaches. The quantities are basedon the performance targets for individual reaches portrayed in Table 3. Proposed reaches that meet thepoor performance category are those that are currently heavily altered or geomorphically (based onslope and channel confinement) would naturally have lower wood quantity (Fox 2001). Finally, theestimated count of future wood jams (constructed and natural) is listed. It is worth highlighting thateven though the mainstem Stillaguamish River may have a poor wood performance assignment into thefuture, the proposed 69 wood jams (Table 3) is 57 jams more than the current condition (based on 2002data; Haas et al. 2003).This proposal recommends that the implementation target for wood placement projects is 20% of theestimated wood deficit or 122 wood jams (Table 4). This total is equally apportioned over all selectedreaches (Table 4), but this proposal recommends that the wood target should be implemented based onpriority locations. These locations are shown in Map 1. For example, the jam implementation targetproposed for the Upper North Fork Stillaguamish River (18 jams) reflects the large effort already madeto implement the original Plan target. As of 2015, 26 large wood jams have been constructed in theNorth Fork Stillaguamish River, including woods jams built in 1998. Elsewhere, seven other wood jamprojects have been constructed toward the implementation target.This implementation target will be applicable over the next 10 years and is greater than the original plantarget due to two factors. First, this revised wood target includes more locations for implementationthan the original plan. Second, the quantity of woody debris has decreased in the North ForkStillaguamish River between 2002 and 2011 (Leonetti et al. 2015), necessitating an increase in thequantity of constructed jams or other wood placement. The proposed target, if implemented over tenyears, amounts to annualized progress of 12 constructed jams per year, which more than doubles thecurrent annualized rate of progress. Thus, although the 20% implementation target is somewhatarbitrary in terms of the direct linkage to fish responses and population performance, the amount ofproposed implementation is large and will test the capacity of watershed stakeholders, more so than inthe first 10 years of Salmon Recovery Plan implementation.8
Table 3. Existing wood condition category by site according to Table 2 and desired future condition (2, 4,or 8 jams/km). The final column is the desired future jam count based on condition assignment.9
AreaMainstemLower North ForkUpper North ForkEcosystemcomponentLarge channel/ sidechannelsLarge channel/ sidechannelsLarge channel/ sidechannelsSmall channelLower South ForkLarge channel/ sidechannelsUpper South ForkLarge channel/ sidechannelsPilchuck CreekSmall channelJim CreekSmall channelOtherSmall channelReach/ ExistingCategoryDFC Jams/kmPoint estimate ofDFC jam 50Upper SF 6,8 (DG)SF 7**Pilchuck 1Pilchuck 2Jim 1Jim 2Jim 3Jim 4Lower Deer (DG)Boulder 1Boulder 2Squire 1Squire 2French 1French 2Canyon 1Canyon 1CS1HS1MS1MS3MS4AMS4BNF 1NF2NF3NF4*NF5*NF6NF7295132874669*DFC - Desired Future Condition* Parts of N4 and N5 include the confined and steeper river reach downstream from the 2014 Oso slide.This length is excluded from NF 4 and NF5. ** Only unconfined portion of SF7.10
Table 4. Wood piece and jams deficit by area/reaches and proposed 10-year implementation target for priority reaches. The total (122 jams) isbased on implementation of 20 percent of the jam deficit (609 jams). Note: not all locations from Table 3 are included in the totals below.eaArceaR/sheCurrent Plan PriorityNMFSPiecesDeficitJams "custom"MmtensiawLoerNF rpepU NFwLoer86, 271FFkkS4rSuc er huc 1/2e3/ e rhpp ilcli cppUPUPJimJim DeSF21211/ereretddlch linsrllinuuluan otaeroooqrBBSFRGT -1765-1504-8505716891-1329 -220 -38 DG -271043030 Unk 25-44 -51DG0-9-31-3-5-11-588724 22Unk0937354609Jam deficit "custom" is based on jam frequency assignments to reaches as in Table 3 (2, 4, or 8 jams/km).ADAPTIVE 10-YEAR WOOD IMPLEMENTATION TARGET ALTERNATIVES AS OF 2015 - Anticipated to be reviewed in 2025.MWood target objective20% of DFC Deficitnaiemst1134wLoNFer18,81FFF7F6 k2kNSSSrrr/2/4ucucerpepe ilch ppe ilch m 1 m 3 ee rwppoULUPUPJiJiD2166NA554NAulBor1deNA2Green Priority 1 area as in Map 4Orange Priority 2 area as in Map 4Other locations are non-priority areas for near-term implementation11ulBor2de7uSqire21/tch linslanenrFRoGr111To122lta
Map 1. Wood implementation priority reaches.12
1
ReferencesFox, M.J. 2001. A new look at the quantities and volumes of instream wood in forested basins withinWashington State. Masters Thesis. University of Washington, Seattle WA.Fox, M.J. & Bolton, S. (2007). A regional and geomorphic reference for quantities and volumes ofinstream wood in unmanaged forested basins of Washington State. North American Journal of FisheriesManagement, 27, 342–359.Haas, A.D., Leonetti, F.E., Parker, L.T., Purser, M.D., & Rustay, M.D. (2003). Stillaguamish river bank andphysical habitat conditions survey 2002 summary report. Everett, WA: Snohomish County Public WorksSurface Water Management.Leonetti, F.E., Rustay, M.D., Tran, T., & Purser, M.D. (2015). 2011 North Fork Stillaguamish River HabitatInventory and Assessment of Change since 2002. Snohomish County Public Works, Surface WaterManagement. Everett, WA.National Marine Fisheries Service (NMFS). (1996). Coastal salmon conservation: Working guidance forcomprehensive salmon Restoration initiatives on the Pacific Coast: Appendix II: Making endangeredspecies act determinations of effect for individual or grouped actions at the watershed Scale. Portland,OR: NMFS.Stillaguamish Implementation Review Committee (SIRC). (2005). Stillaguamish watershed Chinooksalmon recovery plan. Retrieved fromhttp://www.google.com/url?sa t&rct j&q &esrc s&source web&cd 1&ved 0CB4QFjAA&url y%2520Plan%2520--%2520Jun.pdf&ei Fc9sVe-GYWqogTj9YDQAQ&usg AFQjCNHb8zMFSrSTKewACJTnhbF6Aj-n7A&bvm bv.94455598,d.cGUUSDA-Forest Service. (1998). Stream inventory handbook: Level I & II. USDA, Region 6, Version 9.8.Washington Forest Practices Board (2011). Standard Methodology for Conducting Watershed Analysis Board Manual. Version 5. Washington Department of Natural Resources, Olympia, WA.
even though the mainstem Stillaguamish River may have a poor wood performance assignment into the future, the proposed 69 wood jams (Table 3) is 57 jams more than the current condition (based on 2002 data; Haas et al. 2003). This proposal recommends that the implementation target for wood placement projects is 20% of the