Transcription
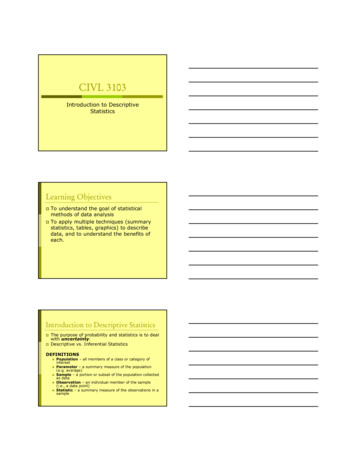
230 Combs Building – 859.622.3050 – studentcomputing.eku.edu – studentcomputing@eku.eduFrequency Distributions andDescriptive Statistics in SPSSSample Problem:Ten men and ten women participated in a three‐point shootout basketballcompetition. Each participant got 10 attempts. Their scores reflect thenumber of 3‐point shots made out of 10. We’re interested in the variablesgender and shots‐made, although for this tutorial gender won’t be affecting thedata. For gender: 1 represents male and 2 represents 0421534789103258Fall 20131234567891011121314151617181920Shots madeFrequency Distributions and Descriptive Statistics in SPSIn this tutorial, we’re going to work through a sample problem and constructfrequency distributions and view some basic descriptive statistics. We willthen generate a histogram based on the results.
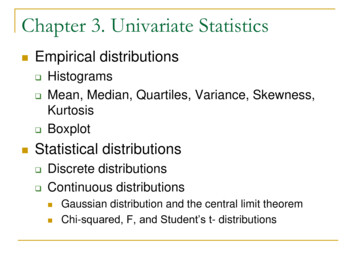
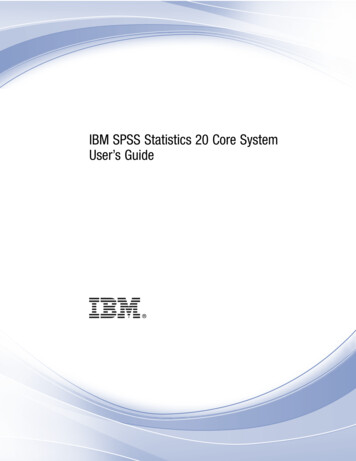
So, as you can see we need three variables (columns). In order to set up threedifferent variables, open SPSS and click on the Variable View tab located in thebottom left corner, next to the Data View tab. The Data View tab is automaticallyselected when you first open SPSS.This will change your view where each row will represent a variable. Here you canname the variables and make any other changes that are necessary. The only thingwe’re going to change is the name for each variable and the number of decimals; eachvariable will need to be changed to 0 in the drop down menu in the decimal column.Once entered, the variables on your variable view should look like the above picture. Ifeverything is entered correctly, navigate back to the Data View by clicking on the tabin the bottom left corner.*If you want the values for 1 and 2 in the Gender variable to be displayed with theircorresponding category in the output (1 for male, 2 for female) then you can do thisby clicking on the Value cell in the Gender column. A button will appear that contains“ ” Click this button to open another dialog box. Here you can assign labels to certainvalues. Simple put “1” in the Value box and Male in the Label and click Add. Repeatwith the appropriate information for the female label, then click OK.
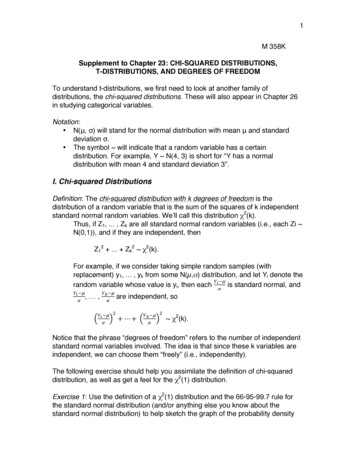
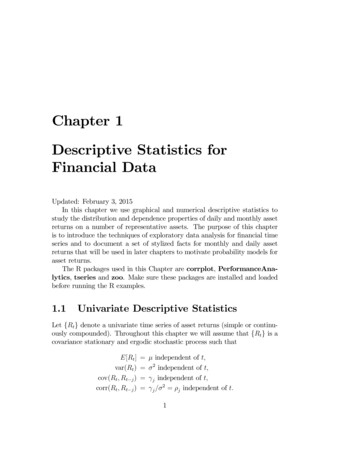
If your variables are set upcorrectly then you can go aheadand enter the data presented onthe first page of this tutorial.Once entered, your spreadsheetshould look like the image to theleft.Now, we’re ready to construct the frequency distribution and obtain some basicdescriptive statistics. You’ll need click Analyze Descriptives Statistics Frequencies
Once you click Descriptives, the following dialog box will pop up:Initially, all variables will appear in the left side. You will need to click on Gender andthen click the center arrow to move it to the right side (Variables box). Both Genderand Shots made need to be in the right box, just like the image above.Once you’ve added both variables to the right side, click on the Statistics buttonlocated in the upper‐right corner.
Initially, all boxes willbe unchecked. Youwill need to manuallycheck all of the boxesthat are checked inthe image to the left.Once you havecompleted this, youcan click the Continuebutton.This will close thedialog box and youwill be back at theFrequencies dialogbox. Now click onthe Charts buttonlocated on the rightside.Once here, you will want to select the buttonnext to Histograms. You can then hit Continueto close the Charts dialog box and thenContinue on the main Frequencies dialog boxto compute the statistics.
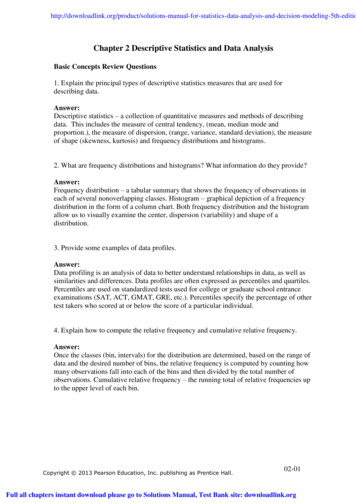
This is one of the outputs you will see once SPSS runs the frequencies anddescriptives. In the Shots made column, you can see the mean, median, and modefor the number of shots made as well as other descriptive statistics like standarddeviation, range, and minimum and maximum shots made.
Here we have the frequency table. The Gender table is self‐explanatory and isn’t of anyuse to us. The Shots made table indicates the frequency for each number of shotsmade. Percentages and cumulative percentages have also been calculated.
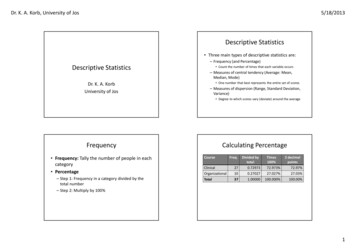
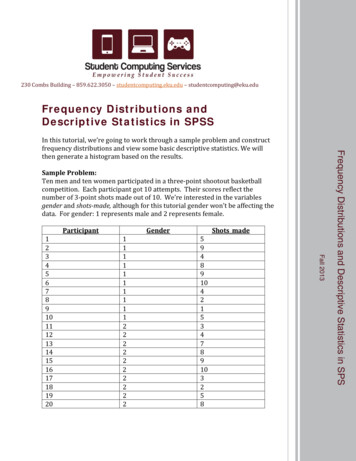
This is the frequency histogram for the Shots made column. SPSS will also print agender histogram but it’s not very useful so I didn’t include it in the tutorial.For this type of data, you could’ve also used a bar graph because the range ofnumbers isn’t very large, but this histogram also works just fine. We can see thefrequency of each individual number of shots in graphic form. And this concludes thetutorial for simple frequencies and descriptives in SPSS.
Descriptive Statistics in SPSS In this tutorial, we're going to work through a sample problem and construct frequency distributions and view some basic descriptive statistics. We will then generate a histogram based on the results. Sample Problem: Ten men and ten women participated in a three‐point shootout basketball competition.