Transcription
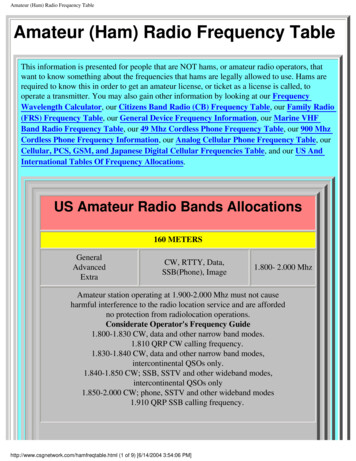
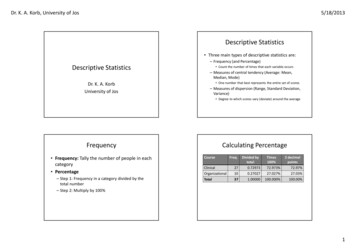
Dr. K. A. Korb, University of Jos5/18/2013Descriptive Statistics Three main types of descriptive statistics are:– Frequency (and Percentage)Descriptive StatisticsDr. K. A. KorbUniversity of Jos Count the number of times that each variable occurs– Measures of central tendency (Average: Mean,Median, Mode) One number that best represents the entire set of scores– Measures of dispersion (Range, Standard Deviation,Variance) Degree to which scores vary (deviate) around the averageFrequency Frequency: Tally the number of people in eachcategory Percentage– Step 1: Frequency in a category divided by thetotal number– Step 2: Multiply by 100%Calculating vided 27.027%100.000%2 decimalpoints72.97%27.03%100.00%1
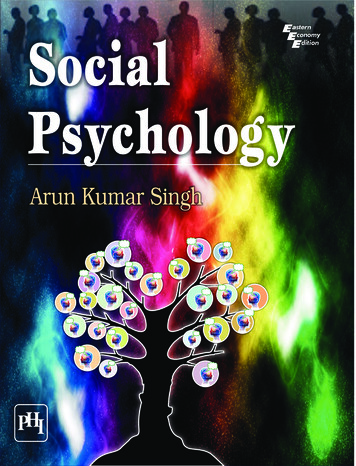
Dr. K. A. Korb, University of Jos5/18/2013Central TendencyCalculating PercentageGeopoliticalFreq.Zone of OriginSouth SouthSouth EastSouth WestNorth CentralNorth WestNorth EastTotalDivided bytotalTimes100%Note: N Number in the Sample2 decimalpoints– Step 1: Order numbers from lowest to highest– Step 2: Select the middle number For an odd N, the middle number is the median For an even N, calculate the midpoint between the twomiddle numbers by summing and dividing by 2 Mean– Step 1: Sum all of the scores– Step 2: Divide by N– Excel average()Years Experience as a Psychologist10724 Mode: Most frequent response Median1Data28235 8Calculate Measures of Central Tendencyfor Number of Cell Phones Owned141221332 2Step 1: Order from Lowest to Highest1223578810 24 Mode 2 and 8 Median: 5 and 7 are middle; 5 7 12, 12 dividedby 2 6 Median 6 Mean: 1 2 2 3 5 7 8 8 10 24 70; 70 divided by 10(N) 7 Mean 72
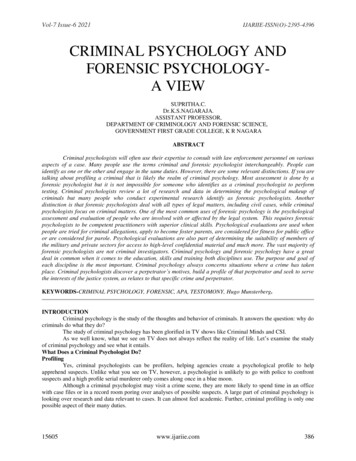
Dr. K. A. Korb, University of Jos5/18/2013Measures of Dispersion Range: Highest minus lowest score– Generally also report the highest and lowest score Standard Deviation: Average (mean)“deviation” between each score and the meanbased on the sample– Excel: stdev() Variance: Square of the Standard Deviation1072012SumDeviation(from mean of 8)2-112-7-60Mean (divide by 5-1)Square Root2 decimal pointsSquaredDeviation41144493623458.87.6485297.65 Step 1: Calculate the mean Step 2: Calculate deviations of each number fromthe mean (the number minus the mean) Step 3: Square the deviations Step 4: Sum the squared deviations– Note that adding the deviations will ALWAYS equal 0 Step 5: Divide by N-1 This is the variance Step 6: Calculate the square root This is thestandard deviationCalculate the Measures of Dispersion for thefollowing number of cell phones ownedNote: Mean 8ScoreMeasures of DispersionRange: Theyears ofexperience asa psychologistvary from 1 to20 years, arange of 19.ScoreDeviation(from mean of )SquaredDeviation14334SumMean (divide by )Square Root2 decimal points3
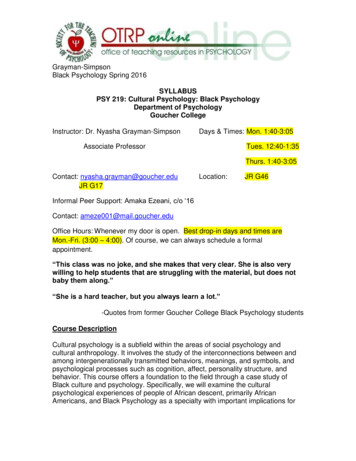
Dr. K. A. Korb, University of JosAppropriate Descriptive Statistics Discrete Variables: Frequency and percentage– Percentage is easier to interpret because it means“If there were 100 cases EXACTLY, how manywould fit in the category.”– Mode can also be reported as a measure ofcentral tendencyDescriptive Statistics APA standards require that researchers reportdescriptive statistics on the major variablesunder study– For most psychological variables, this is the meanand standard deviation Mean is necessary to summarize that variable across allparticipants Standard deviation is necessary to understand howmuch participants vary around that mean.5/18/2013Appropriate Descriptive Statistics Continuous Variables: Mean is the bestrepresentation of the data– Standard Deviation should also be reported toindicate how much the scores vary around themean– Grouped Frequency table is also possibleReporting Statistics Decimal points– Frequencies: Only use whole numbers.– Percentages, means, and standard deviations: Twoplaces after the decimal point Note: If the 3rd place after the decimal point is 0-4,round down. If the 3rd place after the decimal point is5-9, round up Example– 1.352– 1.3571.351.364
Dr. K. A. Korb, University of Jos5/18/2013Interpreting Descriptive StatisticsCreating Tables ***INFERENTIAL STATISTICS ARENECESSARY TO DETERMINE WHETHERDIFFERENCES BETWEEN MEANS ARESIGNIFICANT*** Tables enable a researcher to present a largeamount of numerical data in a small amountof space. Two seemingly contradictory requirements ofTables:–If males have a mean of 54.8 andfemales have a mean of 55.2, inferentialstatistics MUST be calculated todetermine whether this difference issignificant, or meaningfulRules for Creating Tables Titles should be brief, but clearly explain the table All similar entries in the table should have the samenumber of decimal points Decimal points must be lined up in each column Horizontal rules at the top, bottom, and after labels– Vertical lines are rarely used according to APA If you are not the original author of the table, cite thesource of the table in a note at the bottom Once the tables have been placed in the text, numberthe tables starting from 1 in the order that they appear– Readers should be able to interpret a table just bylooking at the table, without reading the body ofthe research report– Every table must be discussed in the text, but donot repeat all statistics from the tableAPA Checklist for Tables, Part 1(APA, 2001, p. 175) Is the table necessary? Is the entire table, including the title, headings,and notes, double spaced? Are all comparable tables in the manuscriptconsistent in presentation? Is the title brief but explanatory? Does every column have a column heading? Are all abbreviations and special symbolsexplained?5
Dr. K. A. Korb, University of Jos5/18/2013APA Checklist for Tables, Part 2(APA, 2001, p. 175) Are all probability levels correctly identified, andare asterisks attached to the appropriate tableentries? Is a probability level assigned the samenumber of asterisks in all tables in themanuscript? Are all vertical rules eliminated? Will the table fit across the width of the page? If all or part of a copyrighted table is reproduced,do the table notes give full credit to the copyrightowner?Identify the Problems with the TableIdentify the Problems with the Table6
Dr. K. A. Korb, University of Jos5/18/2013Identify the Problems with the TableIdentify the Problems with the TableFiguresAPA Checklist for Figures, Part 1(APA, 2001, p. 201) Figures allow readers to quickly understand andeasily interpret descriptive statistics– Useful for means, frequencies, and percentages Just like tables, figures should also beunderstandable without reading the text, but alsoreferenced in the text Figures should also be numbered consecutively,but separately from Tables. Legends and notes should be included so thereader can easily interpret the figure. Is the figure necessary? Is the figure simple, clean, and free of extradetail? Are the data plotted accurately? Is the grid scale correctly proportioned? Is the lettering large and dark enough to read? Isthe lettering compatible in size with the rest ofthe figure? Are terms spelled correctly?7
Dr. K. A. Korb, University of Jos5/18/2013APA Checklist for Figures, Part 2(APA, 2001, p. 201) Are all abbreviations and symbols explained inthe figure legend or figure caption? Are thesymbols, abbreviations, and terminology in thefigure consistent with those in the figure caption?In other figures? In the text? Are the figures numbered consecutively withArabic numerals? Are all figures mentioned in the text? Are figures that are being reproduced or adaptedfrom another source given proper credit in thefigure caption?8
Dr. K. A. Korb, University of Jos 5/18/2013 1 Descriptive Statistics Dr. K. A. Korb University of Jos Descriptive Statistics Three main types of descriptive statistics are: - Frequency (and Percentage) Count the number of times that each variable occurs - Measures of central tendency (Average: Mean, Median, Mode)