Transcription
UTMS Journal of Economics, Vol. 1, No. 1, pp. 39-52, 2010S. Bogdan, S. Baresa, S. Ivanovic: PORTOFOLIO ANALYSIS BASED ON THE EXAMPLE OF.Preliminary communicationReceived: 15.04.2010PORTFOLIO ANALYSIS BASED ON THEEXAMPLE OF ZAGREB STOCK EXCHANGESinisa BogdanSuzana BaresaSasa IvanovicUniversity of Rijeka, Croatia1Abstract:In this paper we analyze the portfolio that was selected from the Zagreb Stock Exchange and also try toassess its risks and its future offerings that are relevant in making the decisions about investments.Through the work we will explain the importance of diversification and how the very diversificationreduces risk. We will also analyze the systemic risk of individual stocks within the portfolio and thesystemic risk of the given portfolio and explain its importance. Through regression analysis we willanalyze the securities with the highest and lowest systemic risk and will clarify the results. At the end wewill explain the correlation in the selected portfolio and point out the importance of the correlation anddiversification itself.Key words: portfolio, diversification, systemic risk, beta, regression analysis.INTRODUCTIONThe very beginning of portfolio analysis was laid by Markowitz. In this paper,we analyze selected portfolio composed of stocks that are listed on the Zagreb StockExchange, we comment the results given and explain their significance. Eachinvestment in securities is estimated based on two basic points: the yield and risk, thesetwo items depend on each other.Without underwriting, it is impossible to acquire yield. There will always berisk associated with investments, and the yield itself will always be different; real from1Sinisa Bogdan, M.A, Assistant,, Suzana Baresa, M.A., Assistant, Sasa Ivanovic, M.Sc., Postgraduatestudent, Faculty of Tourism and Hospitlity Management in Opatija, University of Rijeka, Croatia.39
UTMS Journal of Economics, Vol. 1, No. 1, pp. 39-52, 2010S. Bogdan, S. Baresa, S. Ivanovic: PORTOFOLIO ANALYSIS BASED ON THE EXAMPLE OF.expected. There are two basic types of business risk: systematic and specific risk. Thepaper will also deal with evaluation of the systemic and specific risks and factors thatsignificantly affect the very quality of the results. In addition to the assessment of risk wewill explain the importance of diversification and correlation bond within the portfolio.MODERN PORTFOLIO THEORYBefore we briefly explain some of the basics of modern portfolio theory, wewill first define the meaning of the term portfolio. The portfolio represents a set ofinvestors’ property. By the decision on the allocation of assets the investor chooses theasset type. Assets can be categorized in many classes such as equity securities, debtsecurities, real estate, merchandise, etc.In 1952 Harry Markowitz published an article "Portfolio Selection" and therehe described the composition of optimal portfolio in terms of market uncertainty.Markowitz discovered how to create a frame for the optimal or efficient portfolio,expecting highest possible rate of return for the default risk which is measured as thestandard deviation of portfolio returns. After him, in the year 1963 Sharp readjustedMarkowitz formula and created a model which is today called Single index model.After these discoveries, fundamental analysis was no longer needed.According to Markowitz, only one possible combination has the maximumpossible rate of return for each level of risk and that combination is called efficient.The theory itself is based on fundamental assumptions that say that investors have anaversion towards risk and they act rational. The function of utility determines thebehaviour of investors, portfolio as a whole is the deciding factor, which means it iscollective that makes it, and not individual security. The problems that arise byapplying modern portfolio theory to transitional markets such as the Croatian marketare: short time of existence of securities on market and insufficiently long time seriesthat are used in calculating the indicators.THE RISK OF CHANGES IN STOCK PRICESRisk is defined as the dispersion of the probability distribution of eventswhose value was anticipated.2 Investors are faced with numerous risks, such as: taxrisk, market risk, credit risk, political risks, liquidity risk, exchange rate risk and others.One of the main motives to buy securities, in our case the stocks is yield. Theyield represents a yield from increase of the share price and yield of dividendpayments. Many investors are concerned with estimates of prices of securitiescalculating, fundamental analysis of individual companies, studying technical analysis,addressing the macroeconomic indicators, reading the news everyday and trying tofigure out which direction price movement will take some securities. It takes a good2Zoran Ivanovic, Financial Management, the second amended and revised edition, University of Rijeka,Faculty for Tourism and Hotel Management, Opatija, 1996.40
UTMS Journal of Economics, Vol. 1, No. 1, pp. 39-52, 2010S. Bogdan, S. Baresa, S. Ivanovic: PORTOFOLIO ANALYSIS BASED ON THE EXAMPLE OF.knowledge of microeconomics and macroeconomics in order to determine the generallocation of a company in addition to try to predict future price movements. Investorsmake decisions themselves between non-risk investments and risk investments, if weare given the opportunity to invest money and achieve risk-free rate of 5% or investmoney and pursue a risky rate of 12% then we can conclude that our risk premium inthis case is 7%, and on this particular risk premiums investors are planning to makeadditional profits. Expected return non-risk rate of return risk premium. Riskpremium is paid to only one risk and that is on the systematic apropos systemic riskwhich is measured by beta.Different bonds have different levels of risk; exactly the presence of riskcomplicates the selection of securities. In order to successfully manage the risk aninvestor must be able to measure it, what was a problem in the past, but today thanks tothe availability of data is no longer the case.SYSTEMIC AND SPECIFIC RISKSystemic risk implies the market risk that is the risk that comes frommacroeconomics and cannot be eliminated with diversification. Systemic risk is closelylinked to conditions on capital markets, is determined by factors related to itsenvironment in which the securities are located (e.g. events on market such as changesin market interest rates, general recession, natural disasters, wars, political events,economic growth and so significantly affect the entire market regardless of whichactivities particular value of securities belong to).Specific risk is also called nonsystematic or diversification risk and isinfluenced by some specific characteristics of certain companies or certain activitiesthat is all those factors of value which are under the direct control of the company. Thatrisk can be removed by holding assets from different sectors of the economy indiversification portfolio. When you combine a large number of stocks in the portfolio,and sources of risk are independent, the impact of good news will be reflected onindividual stocks also the impact of bad news will be reflected on individual stocks,that is what we call the Specific Risk. That diversification of portfolio will be achievedby the elimination of a specific risk, because our portfolio will not depend on onesector such as construction.In systemic risk emersion of some negative news will affect the entire marketand also on our portfolio. Suppose we want to invest 100 000 HRK in securities. If weinvest all our money in only one security as IGH-R-A our yield or loss will dependsolely on the movement of share price of the company IGH-R-A, systemic and specificrisk (enterprise development, management, the demand for services and products, etc.)will influence on the price of movement of stock. But if you invest the same amount ofmoney in one company instead of in several companies that will alleviate if notcompletely eliminate the specific risk of our portfolio. It is important to also determinethe correlation within the selected stocks, if it is smaller or even negative this indicatesthat the portfolio is well diversified.41
UTMS Journal of Economics, Vol. 1, No. 1, pp. 39-52, 2010S. Bogdan, S. Baresa, S. Ivanovic: PORTOFOLIO ANALYSIS BASED ON THE EXAMPLE OF.DESCRIPTION OF PORTFOLIOSecurities of which portfolio will be composed are ordinary shares that arelisted on the Zagreb Stock Exchange. In selecting stocks for the portfolio, severalcriteria was combined, among which the most important one was sufficient liquidity ofthe chosen shares, and long enough time series which was observed (observed timeseries was from 26.03.2008. till 01.03.2010. which is the total of 106 inputs on theselected stock) weekly returns were observed which were calculated based on closingprices.3 Selected stocks are members of the official index of the Zagreb StockExchange CROBEX and as such they meet all the criteria which exist for inclusion inthe index itself, one of which is the main one that the share was traded more than 90%of the total trading days in the last six months.In our example we have selected stocks from the sectors of trade, transport andcommunications, industry, construction and food industries. The table below shows alist of stocks with the symbol of each issuer and the market where quoted.Table 1: Selected portfolioSimbolIssuerMarket1ATGR-R-AAtlantic grupa d.d.Regular market2ATPL-R-AAtlanska plovidba d.d.Official Market3DLKV-R-ADalekovod d.d.Official Market4ERNT-R-AEricsson Nikola Tesla d.d.Regular market5HT-R-AHT -hrvatske telekomunikacijed.d.Official Market6IGH-R-AInstitut IGH d.d.Official Market7INA-R-AINA-Industrija nafte d.d.Official Market8INGR-R-AINGRA d.d.Official Market9JDPL-R-AJadroplov d.d.Regular market10KRAS-R-AKraš d.d.Regular marketSource: Official website of the Zagreb Stock Exchange (www.zse.hr)ESTIMATION OF EXPECTED PORTFOLIO RETURNWhen selecting the portfolio investors prefer to decide for those portfolioswith the highest expected return and lowest volatility. In the calculations of expectedreturns, we will use the observed period of (106) weeks. We will use the arithmeticmiddle in estimating future returns because it gives us more accurate assessment fromthe geometric middle of return, which is widely used for measuring than the average ofpast returns. We use below mentioned formula for calculation of arithmetic middle forreturn of weekly periods of each stock:3Dividends are not included in the yields of shares.42
UTMS Journal of Economics, Vol. 1, No. 1, pp. 39-52, 2010S. Bogdan, S. Baresa, S. Ivanovic: PORTOFOLIO ANALYSIS BASED ON THE EXAMPLE OF.R1RnRRRRi the average return on stock in number of periods (106 weeks)Rit return on equities for the period tThe expected rate of return on the portfolio is calculated in a manner that theexpected rate of return on shares multiplied by the stock shares and the values obtainedare added together. Every stock is participating, with equal share in the portfolio.Computationally shown:Rw R the expected rate of portfoliowi proportion of shares and securities in the portfoliom number of shares in the portfolioRi the expected rate of return on sharesDIVERSIFICATION OF PORTFOLIOTable below shows the average deviation of stock price movement (from2008. till 2010.) from its arithmetic middle. By increasing the number of shares we arereducing an average deviation of price movements from arithmetic middle to a level of6,73% wherewith we greatly reduce the risk of the portfolio. Diversification cannotcompletely reduce the variance or standard deviation. The standard deviation of theportfolio represents weighted average of standard deviation of the portfolio; calculationbelow is derived under the assumption that all the shares in 10 listed stocks are equal.Figure 1: DiversificationSource: made by author43
UTMS Journal of Economics, Vol. 1, No. 1, pp. 39-52, 2010S. Bogdan, S. Baresa, S. Ivanovic: PORTOFOLIO ANALYSIS BASED ON THE EXAMPLE OF.Based on the illustration4 above we see that the standard deviation for eachshare amounts to 9.08% by further increasing the number of shares, standard deviationgradually decreases, that is by adding securities we decrease the specific risk of theportfolio what can be seen in the decline to a certain limit, after which we cannotreduce with a further diversification5 or further inserting additional shares in theportfolio. When stocks are perfectly correlated diversification has no effect. The mostfamous saying of diversification is "Don’t put all the eggs into one basket." Proverbadvises investors to rather have several different securities, but to invest the entirecapital into one single security.MEASUREMENT OF SYSTEMIC RISKSystemic risk of stocks is measured by the beta coefficient. Beta based onhistoric data, shows movement of stocks (stock volatility) compared to index marketwith which it is being compared to, that is beta shows tendency that individual securityvariant with the market. When the market is on the rise, the returns of most stocks arealso on the rise, and vice versa, but with the help of beta quotient we’ll try to quantifythat relationship. The higher beta stock the greater the impact of variation yield of theentire capital market on yields of that stock, i.e. beta measures how systemic riskaffects the yield of individual stocks. Possible calculations of beta quotient which canbe obtained by including in the formula:β 0 indicates that the share does not follow the movement of the indexwith which is being compared toβ 1 indicates that the share follows the movement of the index withwhich is being compared toβ 0 indicates that the beta is inverse in relation to an index with which isbeing compared toβ 1 indicates a greater risk of the share itself (stocks achieves higher upsand downs in relation to an index with which it is being compared to,for the obtained value), such shares are also called the aggressivestocks because they rise and fall faster than the market itself0 β 1 indicates a lower risk of the share itself (share achieves smaller risesand falls in relation to an index with which it is being compared to,for the value obtained), such shares are called defensive stocks.βcov R , Rσ RmΒj Beta coefficient of stockcov [Rit, Rmt] covariance of returns on stocks and the market indexσ2[Rm] variance of returns on market portfolio4For reasons of convenience in this illustration marks –R –A, that signify regular stock, are not written.We've taken an example of 10 shares, for convenience of easier calculation, thereby the limit has not beenachieved in the case of only 10 stocks used.544
UTMS Journal of Economics, Vol. 1, No. 1, pp. 39-52, 2010S. Bogdan, S. Baresa, S. Ivanovic: PORTOFOLIO ANALYSIS BASED ON THE EXAMPLE OF.Beta can be calculated as the covariance of security yield and market indexesin relation to the variance of market index. Investors who want to achieve higher yieldsthan average also have to accept higher risk, and with it the higher the beta coefficient.The biggest deficiency in beta coefficient is that coefficient itself is not constant6. If wecould receive constant beta coefficient then we would have pre-planned movement ofthe stock price in relation to an index for all securities that are in our area of interest. Ifwe have two or more securities that have similar refund we will decide for thosesecurities which have lower volatility compared to the other.It is important to say also that the amount of beta depends on several factorsthat are taken in the calculation, the market index with which we compare (in betaestimates for stocks data can be comparable with the index CROBEX and CROBEX 10) for the domestic market by comparing the length of interval7 (daily, weekly,monthly, etc.), by comparing the length of time (we use it to evaluate the data of 1, 2, 3or more years), return which we calculate (if we use only changes in the price of sharesor with the dividend).PROBLEMS PRESENT IN THE CALCULATION OF BETACOEFFICIENT ON THE CROATIAN MARKETThe main problems that occur when calculating the beta coefficient are notenough liquid stocks. Risk of non liquid is defined as very weak trading which isreflected in low turnover, resulting in individual stock price correction with very smallamounts, and stock trading takes place at intervals that can be up to several weeks, oralmost no trading in individual securities. If we are to assess systemic risk in a numberof shares, the problem could mean just under-trading individual stocks, which bringsinto question the quality of data. One way to reduce the impact of nonsynchronoustrading is to replace the missing data for certain calculations.The risk of non liquidity can be measured by observing the gap between thebuying and selling price (bid-ask spread). If we compare the stock exchange in year2008 in relation to the year 2009 we could conclude that the traffic is almost halved,liquidity of four most liquid shares of 2009 (HT, Atlantic voyage, IGH and Dalekovod)have achieved a cumulative turnover bigger than all the other listed shares together,despite poorer liquidity of the Croatian market, trading happened on daily basis for theselected stocks from the portfolio.CALCULATION OF THE VARIANCE AND STANDARD DEVIATIONThe calculated variance is a common measure of risk on stocks in the portfoliotheory; it represents the arithmetic middle of square deviation of values of numericalvariables from its arithmetic middle. In the group of measures of dispersion variance6Tofallis, C. (2008) Investment volatility; a critique of standard beta estimation and a simple way forward.European Journal of Operational Research, Vol 187, Issue 3, pp. 1358-13677The shorter the interval that we are using, the bigger imprecision of beta is possible because of the error thatcomes due to of lack of liquidity of shares, on financial markets that are not sufficiently developed.45
UTMS Journal of Economics, Vol. 1, No. 1, pp. 39-52, 2010S. Bogdan, S. Baresa, S. Ivanovic: PORTOFOLIO ANALYSIS BASED ON THE EXAMPLE OF.has the same importance as the arithmetic middle in the group of middle values. Riskand standard deviation are directly proportional.8 The formula to calculate the varianceof individual stocks is shown below:σnnr1rnStandard deviation is also calculated as the second positive root of thevariance, and it represents an average deviation of values of the numerical variablefrom its arithmetic middle. The higher standard deviation, the greater is the possibledeviation from the expected rates of return, that is, the lower standard deviation, thegreater the likelihood that the actual rate of return will be closer in relation to theexpected rate of return, and thus lower risk.Table 2: Individual analysis of portfolio 0,78%-0,21%Source: Author’s calculationValues given in the above mentioned table are calculated based on weeklyreturns for last two years, 106 data is used in the calculation with weekly changes ofclosing stock prices in the period between 19. March 2008 and 31. March 2010.Based on the displayed tables we can conclude due to β and σ that the highestrisk has the stock IGH (β 1, 49 σ 0.0908), lowest risk based on two previouslynoted symbols has the stock HT (β 0.4862 σ 0.0355). Ri indicator represents theaverage yield of “i” stock, from a table we can conclude that 80% of the shares fromthe portfolio make loss. Stock with the highest average yield is HT-a 0.07% share,stock which achieves the highest average loss is a stock INGR-e -1.23%.The average return is computed by arithmetic middle. Beta portfolio is asimple weighted average beta of the portfolio, share of all shares are equal. Beta for theselected portfolio would amount β 1.0735, also the standard deviation for the selectedportfolio would amount σ 0.0673, variance for a selected portfolio would amount σ28Brano Markic, Optimizacija portfolija i evolucijski algoritmi, Informatologia, Vol.41.No.4, 2008, p.26646
UTMS Journal of Economics, Vol. 1, No. 1, pp. 39-52, 2010S. Bogdan, S. Baresa, S. Ivanovic: PORTOFOLIO ANALYSIS BASED ON THE EXAMPLE OF. 0.0049.9 It depends on beta itself how much will individual stock contribute to therisk of the selected portfolio, and accordingly achieving the investors wishes.REGRESSION ANALYSISUsing simple regression analysis we will examine the dependence of onevariable on another variable. With model of simple regression statistical relationship isbeing expressed between the two phenomena presented by the values of numericalvariables. The model contains one dependent and one independent variable.10 From thedata we will use weekly returns from the last two years of trading individual stockscompared with the official index of the Zagreb Stock Exchange CROBEX . Thevariables whose variations are explained with the help of the other variables are termeddependent variables, in our case the dependent variable is the yield of the share pricewhile the weekly yield of CROBEX represents the independent variable.The purpose of calculating the regression model is predictive. For thecalculations we took those securities which synchronous equalize in each n-period withthe independent variable CROBEX . Equation for the line of regression line wasdetermined when we have defined the variables α and β. Beta represents the regressioncoefficient, which tells how the changes in the average yield rate of shares for each unitincrease in independent variables. For example, if we change CROBEX stock indexby 2% and beta for selected stock is for example 3 that means that the stocks rate ofreturn will change 6%, that is if change occurs in CROBEX for 1% then the expectedgrowth rate shares equals to α β α 3% may therefore be higher or lower than 3%depending on the foretoken of α also if you do not reach the change of value of theindex, then the expected change in stock price is equal to α.Regression line itself does not show the actual yields precisely because it lacksa variable ei that represents the residual specific surprise which is measured by thevertical distance between points on the scatter diagram and regression line.Rαβ ·RThe above equation represents the regression equation representing therelationship between yields of security Ri and yield market Rm other variables aresegments from αi, beta regression coefficient βi and residual (unexplained yield) ofsecurity ei which represents stochastic variable that demonstrates unsystematicinfluences on dependent variable. The total variability of returns of each securitydepends on two components, the sensitivity of stock on changes of Rm which ismeasured with the βi and the variance which is associated with the specific factors ofthe company which is measured by ei.119Root of this amount should be the standard deviation which is different because the amount obtained isrounded.Ivan Sosic, Statistika, drugo izmijenjeno i dopunjeno izdanje, Sveuciliste u Zagrebu, Skolska knjiga, 2004,p.388-38911Zvie Bodie, Alex Kane, Alan J. Marcus, Počela ulaganja, cetvrto izdanje, Zagrebacka skola ekonomije imanagementa, Mate, 2006, p. 2071047
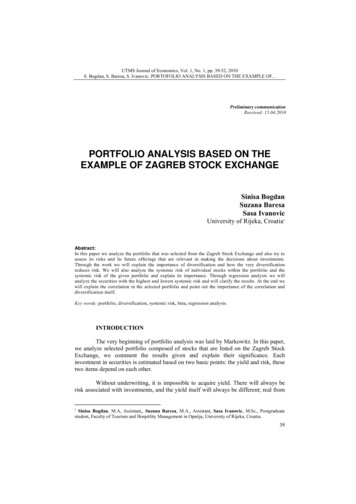
UTMS Journal of Economics, Vol. 1, No. 1, pp. 39-52, 2010S. Bogdan, S. Baresa, S. Ivanovic: PORTOFOLIO ANALYSIS BASED ON THE EXAMPLE OF.RαβReIf we want to calculate ei the formula would be:Residual variance actual - predicted amounteRαβReThe higher regression coefficient called beta the greater is the impact ofvariability CROBEX on the change in share price. As an example display of theregression equation, we will use the stock with the highest beta and that is IGH β 1.4942 and the stock with the lowest beta and that is HT stock where β 0.4862.Chart 1: Weekly yield of CROBEX and HT-R-A15%y 0,4862x 0,00285%0%‐5%HT‐R‐A ‐% prinosa10%R² %10%15%Crobex ‐ % prinosaSource: authors' calculationsLinear regression analysis was based on weekly returns of the last two years;the calculation used 106 data with weekly updates of closing stock price during theperiod from 19 March 2008 till 31 March 2010.The horizontal coordinate represents the independent variable, or yield of themarket Rm, vertical coordinates showing the dependent variable or yield of the stockHT-R-A. On the above chart we can also notice that the regression line intersects theaxis Y on 0,0028 which represents α (alpha) is also an average return on stocks HTRA when the market return is 0%.48
UTMMS Journal of Ecconomics, Vol. 1,, No. 1, pp. 39-522, 2010S. Boggdan, S. Baresa, S.S Ivanovic: PORTTOFOLIO ANALLYSIS BASED ONO THE EXAMPPLE OF.I can also be concluded thaat the HT-R-AItA share with β (beta) 0,48622 has belowaverage systemicsrisk. Mark R2 (coeefficient of deetermination) isi calculated bby squaringthe quotient correlation, for HT-R-AA it is 0,42799 so we can concludecthat 18.31% ofreturn varriation HT-R--A can be expllained by variiations in markket returns.Chart 2: Weekly yieldds CROBEX and IGH-R-AASource: Autthors' calculationnF Chart 2 thhe same time series was ussed as well ass for Chart 1. Each pointForon the graphgrepreseents a samplee pair of retturn (Rm, Ri) for a fixedd period ofinvestmennt.TTrendSCL (Security chharacteristic line) that iss the directiion of thecharacterristics of secuurities is moree tilted in relaation to Chartt 1. Cause off that is thehigher beeta coefficientt. On the abovve chart we caan notice, wheen the market yield is 0%yield stoccks IGH-R-A will amount -0.0025whichh can be seen fromfα.W can concllude that the shareWesIGH-RAA has the abovve-average syystemic risksince thee β 1.4942. Constructionn industry is more vulneraable to systemmic risk asopposed tot the telecommmunications industry, if we take stocks from our porttfolio (IGHR-A, INGGRA-R-A, HTT-R-A) as sammples. It is also important too mention thee coefficientof determmination (R2) is 38% recoovery of variaation IGH-R--A can be exxplained byvariationss in market returns.49
UTMS Journal of Economics, Vol. 1, No. 1, pp. 39-52, 2010S. Bogdan, S. Baresa, S. Ivanovic: PORTOFOLIO ANALYSIS BASED ON THE EXAMPLE OF.CORRELATION WITHIN A SELECTED PORTFOLIOWith the correlation matrix we will try to determine compliance in a variationof ten selected securities within the portfolio.Table 3: Correlation matrix of 5980,19530,43760,27530,39900,38351Source: authors' calculationsCorrelation coefficient was measured by the yield ratio of covariance betweenthe two sections (r1, r2) and standard deviations (σ) yields of two shares.ρ,COV r , rσ ,σCorrelation can be defined as a statistical association between two or morevariables. Among stocks with each other and the CROBEX index correlation can bepositive or negative, they are positive when they have the same direction and negativewhen an increase of one share or index follows the opposite changes in other stocks orindexes. The size of the quotient shows intensity of joint movement of rate of return.The correlation matrix was calculated based on the time series of 106 datawith weekly updates of closing stock price during the period from 19 March 2008 till31 March 2010. Chosen stocks were selected from different sectors of construction,transport and communications, industry, etc. The strongest correlation was achievedbetween Dalekovod and CROBEX , 0,856, the weakest correlation was achievedbetween KRAS-R-A and HT-R-A 0.19530.So in case of increase or decrease of each stock it will lead to rise or fall of theother stock especially among those where coefficient of correlation is set out more.50
UTMS Journal of Economics, Vol. 1, No. 1, pp. 39-52, 2010S. Bogdan, S. Baresa, S. Ivanovic: PORTOFOLIO ANALYSIS BASED ON THE EXAMPLE OF.With a combination of stocks that have low or negative correlation we reduce risk,especially with the negative correlation where there are conflicting price movements.Low correlation helps diversification, when the correlation is perfectly positivediversification is not effective.CONCLUSIONThe basis of any investment is the analysis if we want to achieve gains. Withportfolio analysis, we can evaluate the risk of the portfolio and some of its shares,based on historical data. It is very important that we are aware of very little turnoverachieved especially in the past two years on the Zagreb Stock Exchange, which canjeopardize the quality of processed data. On the other hand we must be aware that ourmarket is yet emerging so that the volatility itself is very emphasized which is alsocharacteristic of emerging market. We determined correlation, yields, risks withemphasis on systemic risk of the portfolio and individual stocks.This article presents the technical analysis of where the main source ofinformation is historical closing prices of individual stocks on which all thecalculations and future predictions are based on. It is important to note when estimatingthe securities that an investor combines also the fundamental analysis from which thereal values of the evaluation of company go.Fundamental analysis is dictating the long-term future of individualcompanies, while technical analysis
The expected rate of return on the portfolio is calculated in a manner that the expected rate of return on shares multiplied by the stock shares and the values obtained are added together. Every stock is participating, with equal share in the portfolio. Computationally shown: R n L Íw g k g @ 5 R g 4 ã the expected rate of .