Transcription
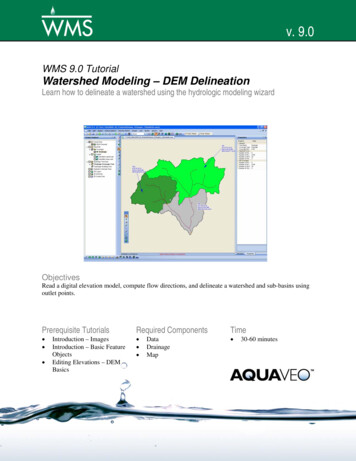
v. 9.0WMS 9.0 TutorialWatershed Modeling – DEM DelineationLearn how to delineate a watershed using the hydrologic modeling wizardObjectivesRead a digital elevation model, compute flow directions, and delineate a watershed and sub-basins usingoutlet points.Prerequisite Tutorials Introduction – ImagesIntroduction – Basic FeatureObjectsEditing Elevations – DEMBasicsRequired Components DataDrainageMapPage 1 of 15Time 30-60 minutes Aquaveo 2012
1Contents123456782Contents .2Introduction.2Objectives.2Setting up a Project with the Hydrologic Modeling Wizard .34.1Starting the Hydrologic Modeling Wizard .34.2Project Filename.34.3Define Project Bounds .44.4Watershed Data using Web Services.54.5Watershed Data by Reading Files .64.6Trimming the DEM.64.7DEM Fill Command.8Watershed Delineation using the Hydrologic Modeling Wizard .85.1Compute Flow Directions and Accumulations.85.2Choose Outlet Locations .9Delineate Watershed.5.3Create Sub-basins.105.4Save the WMS Project File .12Delineation Display Options.136.1Display Flow Paths .136.2Basin Labels .136.3Display Options.146.4Color Fill Basins .14More Basin Delineation .14Conclusion .14IntroductionWatershed delineation from DEMs is straightforward and relatively simple, provided theproject area is not entirely flat or completely dominated by man-made structures (youcannot expect the DEM method to work if there is no relief in the DEM elevationsthemselves). This exercise teaches DEM delineation using the hydrologic modelingwizard, a step-by-step delineation approach that makes the process even simpler.3ObjectivesIn this exercise you will learn the basics of DEM delineation using the hydrologicmodeling wizard. This includes the following:1. Importing DEM Data2. Computing flow paths and flow accumulations3. Delineating watersheds from DEMs4. Delineating sub-basins within a watershedPage 2 of 15 Aquaveo 2012
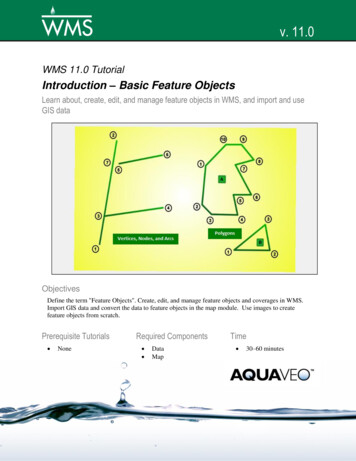
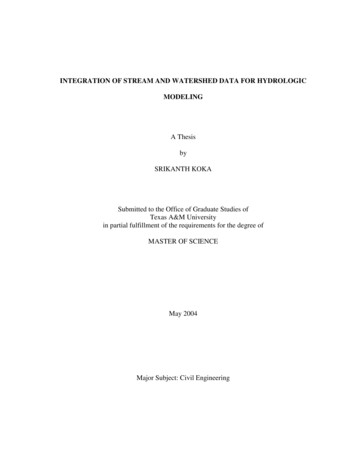
WMS Tutorials4Watershed Modeling – DEM DelineationSetting up a Project with the Hydrologic Modeling Wizard4.1Starting the Hydrologic Modeling Wizard1. Locate the icon for the Hydrologic Modeling Wizard located near the menubar of your WMS window. Click the icon to open the wizardFigure 4-1: Hydrologic Modeling WizardThe Hydrologic Modeling Wizard window shown in Figure 4-1 consists of two sections.The list box on the left shows the steps needed to set up a hydrologic model. The area onthe right is used to perform specific tasks associated with the selected step. Clicking Next in the wizard will walk you through the steps of the wizard sequentially. However, youmay move to any step in the wizard at any time by clicking on the associated heading onthe left. Also, the Hydrologic Modeling Wizard window is a non-modal window,meaning it lets you interact with the main menus and graphics window while it is open.4.2Project Filename1. Make sure Project Filename is the current window in the HydrologicModeling Wizard2. Click on the file browser button to browse to a path location and select afilename for the project3. Name the project “DemDelineation.wms” and click Save4. Click Next to advance to the next stepPage 3 of 15 Aquaveo 2012
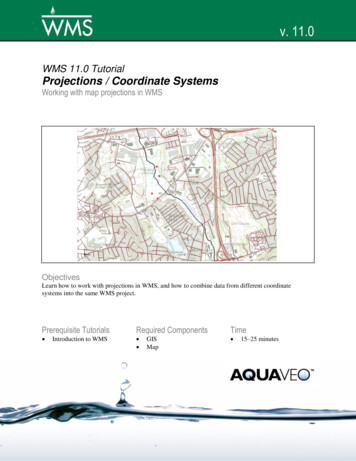
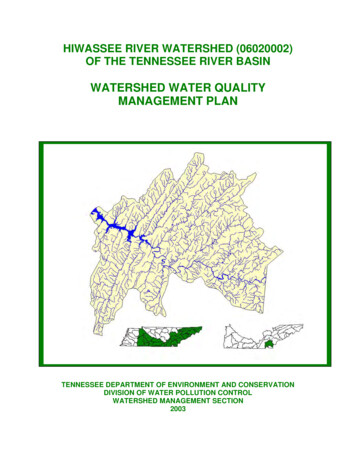
WMS Tutorials4.3Watershed Modeling – DEM DelineationDefine Project Bounds1. Under Project projection, select Define 2. Select the Global Projection option3. Click on the Set Projection button4. In the Select Projection dialog set: Projection to UTM Datum to NAD83 Planar Units to METERS Zone to 12 (114 W - 108 W – Northern Hemisphere)5. Select OK6. Set the Vertical Projection to Local and Vertical Units to Meters7. Select OK8. Under Project boundary, click on the Define button9. In the Microsoft Virtual Earth Map Locator window, enter a latitude of38.6469 and a longitude of -112.4291 and click Jump to location10. Zoom in or out, as necessary, until the Virtual Earth window looks similarto Figure 4-2 and then select OKFigure 4-2: Project Bounds in Virtual Earth11. Click Next to advance to the next stepPage 4 of 15 Aquaveo 2012
WMS Tutorials4.4Watershed Modeling – DEM DelineationWatershed Data using Web ServicesThis section requires a working internet connection. Proceed directly to section 4.5 if aworking internet connection is not available.1. Toggle on the Web Services option for the data source2. Click Next to advance to the next step3. In the Data Type column of the Web Services spreadsheet, toggle on theoption for United States Elevation Data (NED) (10m Resolution)4. Make sure that all other Data Type options are toggled off5. Click Download Data from Web. Enter a DEM resolution of 30 meters.WMS will proceed to download the requested data for the project area that was specified.6. Locate and select the Get Online Maps buttonbar of the WMS window.located near the menu7. Select both the World Imagery and the World Topo Map options and selectOK.Once the image files have been downloaded from Web Services, WMS automaticallyopens the files into your WMS project. The display of these images may be a little slowwhen zooming or panning, so you may want to convert these images to static images (justPage 5 of 15 Aquaveo 2012
WMS TutorialsWatershed Modeling – DEM Delineationright click on each of the online images and select Convert To Static Image) and turnthem off.8. Click Next to advance to the next step9. Skip section 4.54.5Watershed Data by Reading FilesThis section should only be completed if you were unable to complete section 4.4. Toread in a set of four 30-meter DEMs from the 1:24000 series, complete the followingsteps:1. Click on the File Open button2. Locate the demdelin folder in your tutorial files. If you have used defaultinstallation settings in WMS, the tutorial files will be located in \Mydocuments\WMS 9.0\Tutorials\.3. Open “josephpeak.dem”4. In the Importing USGS DEMs dialog, click the Add button5. Add the following three DEMs (remember that you can hold the CTRL keydown and add more than one at once, or use the Add button to add eachadditional one before selecting OK): “marysvalecanyon.dem” “redridge.dem” “trailmountain.dem”6. For Thinning factor enter 3Thinning the resolution of the DEMs will reduce the density of elevation points so thatyour computer will process the DEM data faster. The resolution of points in the 30-meterDEMs is too dense for the purposes of this exercise, so you will not lose any accuracy bythinning.7. In the project explorer, turn off the World Imagery option. You can viewthis imagery data at a later time if you wish. Turning this option off willspeed up the display.8. Click Next to advance to the next step4.6Trimming the DEMTrimming the DEM so that it encompasses the extents of the project area reduces thecomputational time required for watershed delineation. You may need to move theHydrologic Modeling Wizard dialog so that it does not hide the data displayed in themain WMS graphics window.1. Right-click on DEM in the Terrain Data section of the Project Explorer andselect Trim Polygon 2. Select the option to Enter a polygon interactively3. Select OKPage 6 of 15 Aquaveo 2012
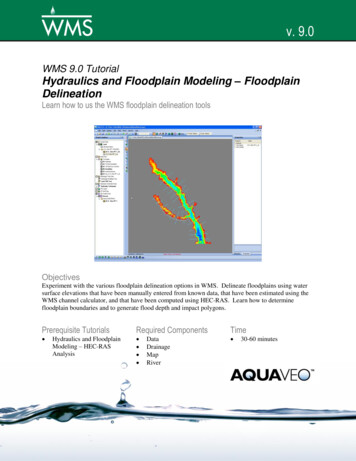
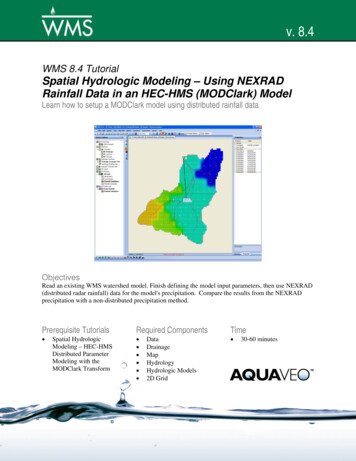
WMS TutorialsWatershed Modeling – DEM Delineation4. Trace around the rectangle shown in Figure 4-4 if you completed section4.4 (Watershed Data using Web Services) or Figure 4-4 if you completedsection 4.5 (Watershed Data by Reading Files) clicking on each corner anddouble-clicking to endFigure 4-3: DEM Trim Area for Web Services DataFigure 4-4: DEM Trim Area5. Toggle off the Images folder in the Map Data section of the ProjectExplorer, if necessary6. Select the Frame macroPage 7 of 15 Aquaveo 2012
WMS Tutorials4.7Watershed Modeling – DEM DelineationDEM Fill CommandThe DEM Fill command is useful for filling gaps in DEM data. It interpolates missing(no data) values using inverse distance weighting of the neighboring eight cells. Thisfunctionality is useful when tiling multiple DEMs files together in WMS, particularly if athinning factor is applied when the DEMs are read. It is not necessary to use thiscommand on seamless DEMs obtained from the NED. If you obtained seamless NEDdata by successfully completing section 4.4 (Watershed Data using Web Services), thenskip this section.1. Select Display Display Options2. In the DEM Data tab toggle on the No Data Cells option3. Select OK4. Right-click on DEM (Trimmed) in the Terrain Data section of the ProjectExplorer and select FillInterior No Data cells disappear as elevations at those locations are interpolated using thesurrounding cells.5. Select Display Display Options6. In the DEM Data tab toggle off the No Data Cells option7. Select OK5Watershed Delineation using the Hydrologic Modeling Wizard5.1Compute Flow Directions and AccumulationsWMS computes flow directions and flow accumulations to create streams on the DEMusing a program called TOPAZ.1. If you have closed the hydrologic modeling wizard, locate the icon for theHydrologic Modeling Wizard at the bottom of your WMS window. Clickthe icon to open the wizard. If you have not closed the wizard, go tothe wizard window.Select the Compute Flow Directions andAccumulations (TOPAZ) step.2. Make sure the option to Write TOPAZ files to a temp directory is selected3. Set the computational units for sub-basin areas to Square Miles4. Set the computational units for distances to Feet5. Select Compute TOPAZ6. Click Close when TOPAZ terminates7. Set Min flow accumulation threshold to 2.0 mi 28. Select Apply to DisplayNotice how the display of flow accumulations cells changes.9. Set Min flow accumulation threshold to 0.5 mi 2Page 8 of 15 Aquaveo 2012
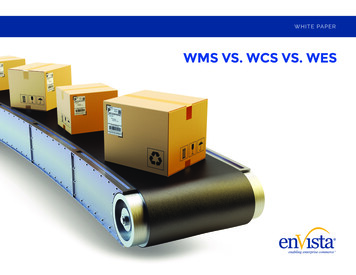
WMS TutorialsWatershed Modeling – DEM Delineation10. Select Apply to Display11. Set Min flow accumulation threshold to 1.0 mi 212. Select Apply to Display13. Click Next to advance to the next step5.2Choose Outlet Locations1. Zoom in around the area shown in Figure 5-12. Choose the Create Outlet Point tool in the Hydrologic Modeling WizardFigure 5-1: DEM Zoom Area3. Place the outlet just upstream of the stream junction shown in Figure 5-2Page 9 of 15 Aquaveo 2012
WMS TutorialsWatershed Modeling – DEM DelineationFigure 5-2: Drainage Outlet Location4. Click Next to advance to the next stepDelineate Watershed1. Verify that the stream threshold value is 1.0 mi 22. Leave the Computation Units with their default values3. Select Delineate WatershedWhen you select Delineate Watershed, WMS digitizes stream arcs using the DEMstreams, which are DEM cells with flow accumulations greater than the stream thresholdvalue, defines the basin boundary, and computes geometric parameters for the basinincluding basin area, average basin slope, mean basin elevation, and maximum flowdistance.Since we won’t be setting up a hydrologic model in this exercise, we don’t need tocomplete the rest of the steps in the wizard. However, we would like to go back andcreate sub-basins.5.3Create Sub-basins1. On the left side of the Hydrologic Modeling Wizard select the headingChoose Outlet Locations or select the Back button to return to theprevious step2. Zoom in around the area shown in Figure 5-3Page 10 of 15 Aquaveo 2012
WMS TutorialsWatershed Modeling – DEM DelineationFigure 5-3: Zoom Area3. Choose the Create Outlet Point tool from the wizard window4. Create another outlet at the location shown in Figure 5-4, just below thestream junction.Figure 5-4: Node Location5. Select the Frame macro6. Zoom in around the branch shown in Figure 5-5Page 11 of 15 Aquaveo 2012
WMS TutorialsWatershed Modeling – DEM DelineationFigure 5-5: Zoom Area7. Choose the Create Outlet Point tool from the wizard window8. Place an outlet immediately downstream of the most downstream featurenode you can see, as shown in Figure 5-6Figure 5-6: Change the indicated node to an outlet.9. Select the Frame macro10. Click Next to advance to the next step11. Select Delineate Watershed12. Click OK to delete all existing feature data and recreate13. Click Close to close the Hydrologic Modeling Wizard5.4Save the WMS Project File1. Select File Save2. Click No if prompted to save image files in the project directoryPage 12 of 15 Aquaveo 2012
WMS Tutorials6Watershed Modeling – DEM DelineationDelineation Display OptionsWMS has several options for displaying DEMs and the results of basin delineation from aDEM. In this section you will explore a few of these options.6.1Display Flow Paths1. Switch to the Drainage module2. Select the Flow Path toolClick anywhere on the DEM. WMS will use the DEM flow directions to trace the entireflow path. The flow paths will disappear as soon as another tool is selected.3. Select Display Toolbars Map Tools to show the Map Tools toolbar4. Choose the Select Feature Polygon tool5. Select any one of the drainage basin polygons6. Select DEM Draw Flow PatternsFlow paths for each of the DEM cells within the selected drainage basin polygon aredisplayed until another tool is selected.7. Select Display Display Options8. In the Drainage Data tab toggle on the Flow Patterns option9. Select OKFlow paths for each of the DEM cells in the selected drainage basin are displayed. Noticethat the flow paths are always displayed, even when another tool is selected.10. Select Display Display Options11. In the Drainage Data tab toggle off the Flow Patterns option12. Select OK6.2Basin Labels1. Make sure the Drainage moduleis selected2. Select Display Display Options3. In the Drainage Data tab toggle on the Basin Names, Basin Slopes, andMax Flow Distance options4. Select OKYou may want to move the basin labels displaying the area, slope, etc. to moreconvenient locations in the graphics window.5. Choose the Move Basin Label tool6. Move the label to another point in the basin just by clicking on any pointwithin the basinPage 13 of 15 Aquaveo 2012
WMS TutorialsWatershed Modeling – DEM Delineation7. Click on any point within a basin and drag the mouse to display the basinlabel with an arrow6.3Display OptionsWhen you are finished using the elevation data, you may want to turn the DEM contoursand extra streams displays off.1. Right-click on DEM in the Project Explorer and select Display Options2. Uncheck the Flow Accumulation, Color Fill Drainage Basins, Fill BasinBoundary Only, and DEM Contours options3. Select OK6.4Color Fill BasinsWMS also allows you to fill in each basin with a different color. This is useful when thebackground image does not need to be showing.1. Right-click on the Drainage coverage and select Zoom to Layer2. Right-click on the Drainage coverage and select Display Options3. Check the Color Fill Polygons option4. Select OK7More Basin DelineationIn this exercise you have learned the most basic use of WMS: to delineate a watershedfrom a DEM. It would be a good idea to practice again using a DEM of your ownchoosing.Follow these steps using your own data (using the previous sections for a more specificoutline):1. Start WMS, or choose the File New option if continuing2. Use the Hydrologic Modeling Wizard to guide you through the delineationprocess3. Experiment with some of the display settings to get a nice final map4. Save a project file of your work8ConclusionIn this exercise you should have learned how to use DEM data in WMS. This includesthe following:1. Importing DEM Data2. Computing flow paths and flow accumulations3. Delineating watersheds from DEMsPage 14 of 15 Aquaveo 2012
WMS TutorialsWatershed Modeling – DEM Delineation4. Delineating sub-basins within a watershedPage 15 of 15 Aquaveo 2012
WMS will proceed to download the requested data for the project area that was specified. 6. Locate and select the Get Online Maps button . located near the menu bar of the WMS window. 7. Select both the . World Imagery. and the . World Topo Map. options and select . OK. Once the image files have been downloaded from Web Services, WMS automatically