Transcription
v. 9.0WMS 9.0 TutorialHydraulics and Floodplain Modeling – FloodplainDelineationLearn how to us the WMS floodplain delineation toolsObjectivesExperiment with the various floodplain delineation options in WMS. Delineate floodplains using watersurface elevations that have been manually entered from known data, that have been estimated using theWMS channel calculator, and that have been computed using HEC-RAS. Learn how to determinefloodplain boundaries and to generate flood depth and impact polygons.Prerequisite Tutorials Hydraulics and FloodplainModeling – HEC-RASAnalysisRequired Components DataDrainageMapRiverPage 1 of 15Time 30-60 minutes Aquaveo 2012
1Contents12345Contents . 2Introduction . 2Objectives . 2Floodplain Delineation Options . 3Creating a Scatter Point File . 45.1Open the Scatter Point Data . 55.2Delineate the Floodplain . 55.3Creating a Flood Impact Map . 66Creating Scatter Points with the Channel Calculator . 66.1Open the Cross Section Arcs and River Centerlines . 76.2Using the Channel Calculator to Compute Depths . 76.3Interpolating Stages Along the Centerline . 96.4Delineate the Floodplain . 107Delineation from HEC-RAS Data . 117.1Reading the HEC-RAS Solution . 117.2Using a Flood Barrier Coverage . 127.3Delineating the Floodplain . 138Creating a Flood Extent Coverage. 149Creating a Flood Depth Coverage . 1510 Conclusion. 152IntroductionThis exercise demonstrates how to perform a floodplain delineation with WMS. BeforeWMS can delineate a floodplain, users must provide an elevation TIN (TriangulatedIrregular Network) and a scatter point data set with river stage values. TIN elevationsmight be obtained from survey data, or by converting DEM (Digital Elevation Model)points to TIN vertices. River stage files can be assembled manually, or read in from aHEC-RAS project file.3ObjectivesThis exercise will familiarize you with how to delineate a floodplain based on watersurface elevations for a river and a TIN which represents the topography for the area. Theexercise will teach you how to: Experiment with the various floodplain delineation options, including input data,search radius, flow path, and quadrants Perform floodplain delineations with water surface elevations acquired by thefollowing techniques:oManually entered in a scatter point fileoApproximated with the Channel Calculator in WMSoComputed with HEC-RASPage 2 of 15 Aquaveo 2012
Hydraulics and Floodplain Modeling – Floodplain DelineationWMS Tutorials4 Use a Flood Barrier coverage to restrict flood waters Generate flood depth, impact, and extent coveragesFloodplain Delineation OptionsYou can choose from several different delineation options, which in turn affect how thefloodplain is computed. Options include Search Radius, Flow Path, and Quadrants.The Search Radius option determines how many TIN vertices are taken into accountwhen performing the delineation. The Max search radius is the maximum distance thatWMS will “look” from each scatter point to determine the intersection between the watersurface and the land elevations. One method for choosing a value for the maximumsearch radius is to increase the radius until the floodplain extents no longer change.The Flow Path option ensures that the interpolated values for the floodplain arehydraulically connected.The Quadrants option makes sure that water level data for interpolation is selected fromall directions surrounding the point of interpolation rather than in just one direction(quadrant). In general, it is best to turn on the Quadrants option when computing afloodplain.Users may want to run several floodplain delineations with varied options in order to seehow the floodplain changes. Optimal settings for the delineation options vary with modelgeometry. For more details on these delineation options, refer to the WMS Help.To experiment with some of the delineation options, we will open a TIN and a scatterpoint set. The TIN contains the land surface elevations and the scatter point set containswater surface elevations.1. Close all instances of WMS2. Open WMS3. Select File Open4. Locate the flood folder in your tutorial files. If you have used defaultinstallation settings in WMS, the tutorial files will be located in \Mydocuments\WMS 9.0\Tutorials\.5. Open “flood.tin”In order to simplify the screen, we will turn off the display of TIN vertices and triangles.6. Right-click on Land under Terrain Data on the Project Explorer and selectDisplay Options7. On the TIN tab, toggle off the check box for Unlocked Vertices (it mayalready be off)8. Toggle off the check box for Triangles9. Select OK10. Select File Open11. Open “samplescatter.wms”Page 3 of 15 Aquaveo 2012
WMS TutorialsHydraulics and Floodplain Modeling – Floodplain Delineation12. Select Flood Delineate13. Enter 100 for the Max search radius14. Enter “sr100” for the solution name15. Select OKWe will now change the Search radius and re-calculate a floodplain16. Select Flood Delineate17. Increase the Max search radius to 50018. Change the solution name to “sr500”19. Select OK to delineate a new floodplain20. Examine the flood depth solution by selecting the sr100 fd data set.Viewing the other flood depth solution reveals a significant difference between the twofloodplain delineations. The floodplain extends quite a bit further for the 500 searchradius than for the 100 search radius.21. Delineate two additional floodplains using Max search radii of 1000 and2000, and set the solution names to “sr1000” and “sr2000”22. Select the corresponding flood depth data sets (sr1000 fd and sr2000 fd)You will notice that there is very little difference between the floodplains delineated withsearch radius values of 1000 and 2000. Therefore, we can use a value of 1000 since wehave found that increasing the radius does not change the delineation appreciably.Now, we will experiment with using different Flow path values.23. Select Flood Delineate24. Enter 1000 for the Max search radius25. Toggle on the Flow path check box26. Enter 500 for the Max flow distance27. Rename the solution as “fp500”28. Select OK29. Delineate two additional floodplains similarly by using Max flow distancevalues of 1500 and 3000 and examine their solution sets.Once again, there is little variation in these last two delineations. Therefore, we mightleave our Flow path value at 1500. As a note, when the TIN includes an area of unusuallyhigh elevations near the river (such as a levee), it is a good idea to use the Flow pathsoption.Experiment further with the display options until you get a feel for how they change thefloodplain delineation.5Creating a Scatter Point FileA scatter file can be created with any text editor or spreadsheet application. The requiredinput for the file are (x, y) coordinates for each data point, and a corresponding data setPage 4 of 15 Aquaveo 2012
Hydraulics and Floodplain Modeling – Floodplain DelineationWMS Tutorials(in this case, the data set would be water surface elevation values for each coordinate).Each coordinate may be associated with more than one data value. Figure 5-1 shows thefile format for a 2D scatter point file:ID123etcX Y “dataset 1” “dataset 2”2343 32322 34.345.72348 32318 33.945.42350 32316 33.545.0Figure 5-1: File format for 2D scatter point file1. Select File New2. Select No when asked if you want to save changesFor this exercise, the scatter file has been created for you. We will open it with a texteditor to view how it is set up:3. Select File Edit File4. Open “wse.txt”5. If asked, select OK to open the file with NotepadThe datasets for the water surface elevations are named “WSE1” and “WSE2.” TheWSE1 data set might represent current water levels, and WSE2 might represent expectedlevels given future developments, such as a proposed levee.6. Close Notepad5.1Open the Scatter Point Data1. Select Flood Read Stage File2. Open “wse.txt”3. Select File Open4. Open “flood.tin”5.2Delineate the Floodplain1. Select Flood Delineate2. Choose WSE1 from the Select stage data set list3. Change the Max search radius to 15004. Toggle off the Flow path check box5. Change the Number of stages in a quadrant to 36. Select OKThis will begin the delineation process for the first set of water surface elevations. WhenWMS finishes, delineate a new floodplain based on the second set of elevations:7. Select Flood DelineatePage 5 of 15 Aquaveo 2012
WMS TutorialsHydraulics and Floodplain Modeling – Floodplain Delineation8. Choose WSE2 from the Select stage data set list9. Select OK5.3Creating a Flood Impact MapWMS can use two separate floodplain delineations to generate a Flood Impact coverage.A Flood Impact coverage shows the difference between two flood depth or water levelsets. The differences are divided into ranges or classes. Using the floodplains delineatedin the previous steps, you will create a Flood Impact coverage in order to investigate thedifference in flooding with and without the proposed levee.1. Select Flood Conversion Flood - Impact Map2. Choose WSE1 fd in the Original data set combo box3. Choose WSE2 fd in the Modified data set combo box4. Select OK to accept the default classes, ranges, attributes, and names5. Select Yes to create the coverageThis new data set is calculated as WSE1 fd – WSE2 fd indicating that all values in thesecond data set were subtracted from their corresponding values in the first data set.6. Switch to the Map module7. Choose the Select Feature Polygon tool8. Double-click on any one of the polygonsThe dialog that opens shows the amount of change from the original data set to themodified data set, as well as the impact class ID and name.Besides creating a tabular data file as described above, scatter point sets can also becreated interactively with the tools in WMS, or opened from a HEC-RAS solution file.The following sections demonstrate these two methods for constructing scatter point datato be used in a floodplain delineation.6Creating Scatter Points with the Channel CalculatorUsers can interactively create scatter points in the 2D Scatter Point module and enter awater surface elevation for each point. This section will demonstrate this method. Tobegin, we will clear all data from WMS and begin afresh.1. Select File New2. Select No when asked if you want to save your changesWMS has a tool that allows us to interactively create scatter points and assign a datavalue to each point. The values for water surface elevations might be obtained bydigitizing from a background image, or from another source. You can also use a crosssection coverage in conjunction with the channel calculator to create scatter points withcalculated depths along a river centerline.For this example, we will use the Channel Calculator to compute water depths for variouscross sections in our channels and create a scatter point at each cross section arc. ThePage 6 of 15 Aquaveo 2012
WMS TutorialsHydraulics and Floodplain Modeling – Floodplain Delineationwater surface elevation will be equal to the water depth computed by the ChannelCalculator plus the ground elevation (given by the TIN).We will begin by opening a map file containing a Cross Section coverage. This coveragecontains several cross section arcs along our stream reaches.6.1Open the Cross Section Arcs and River Centerlines1. Select File Open2. Open the files named “flood.tin” and “cross section.map” and“reaches.shp”3. Right-click on the Coverages folder in the Project Explorer and select NewCoverage from the pop-up menu4. Change the Coverage type to 1D-Hyd Centerline5. Select OK6. Switch to the GIS module7. Select Mapping Shapes- Feature Objects8. Select Yes9. Select Next twice and then Finish10. Hide reaches.shp by deselecting it in the Project Explorer11. Switch to the Map module12. Select the Select Feature Arc tool13. Select Edit Select All14. Select Feature Objects Attributes15. Change the Arc type to Centerline16. Select OK17. Select Cancel on the River Reach Attributes dialog three times to return tothe WMS screen18. Select the Frame macro19. Select the Cross-Section coverage from the Project Explorer so that it willbe the active coverage.6.2Using the Channel Calculator to Compute DepthsThe Channel Calculator is a good tool for approximating channel flows or flow depths.Given a flow rate, the Calculator can compute a flow depth, and vice versa. As wecalculate flow depths, we need to jot down the depth values so we can recall them laterwhen we create the 2D scatter points.1. Switch to the Hydrologic Modeling module2. Select Calculators ChannelsPage 7 of 15 Aquaveo 2012
WMS TutorialsHydraulics and Floodplain Modeling – Floodplain Delineation3. Change the Type to Cross Section4. Click the Select Cross Section button5. Select Cross section 1 and select OKThe cross section displays in the small graphics window. You can adjust the Z scale usingthe drop-down selector to better visualize the cross section. To see this:6. Choose a Z scale of 25:1 and notice the change in the displayWith the cross section selected we are ready to set necessary parameters to performcalculations for depths.7. Change the Units to Metric8. Enter a value of 0.002 for Longitudinal slope. This is an estimate for theground slope in the vicinity of Cross section 1.9. Enter a value of 450 for the flow10. Select the Calculate button11. Select the Create Stage Point button12. Repeat the previous steps to compute depths and create a stage points forall remaining cross sections. The following table provides Flow andLongitudinal slope values for use with each cross section.Cross SectionCross section 1Cross section 2Cross section 3Cross section 4Cross section 5Cross section 6Flow (cms)450450300300150150Slope0.00200. 00150. 00190. 00060. 00870. 0037The Channel Calculator can also be used to generate a rating curve13. Select the Compute Curves buttonThe default is to create a rating curve for the entered flow vs. depth for the selected crosssection, but you can also create curves for all of the other options listed. Furthermore, youcan enter a depth in the Channel Calculator and compute Depth on the Y Axis vs. any ofthe listed options (Flow would replace the Depth option for the X Axis)14. Select OKYou can right-click in the rating curve plot window to export the data to a spreadsheet ifyou want.15. When you are done viewing the rating curve plot, close the plot window byselecting the X in the upper right corner of the window16. Select OK to close the Channel CalculatorPage 8 of 15 Aquaveo 2012
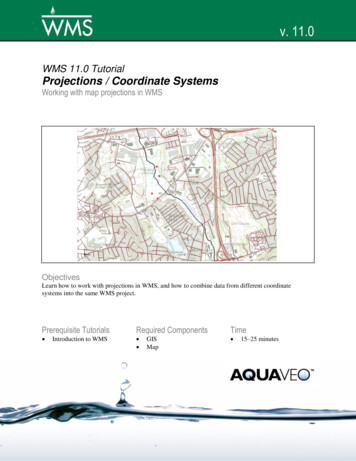
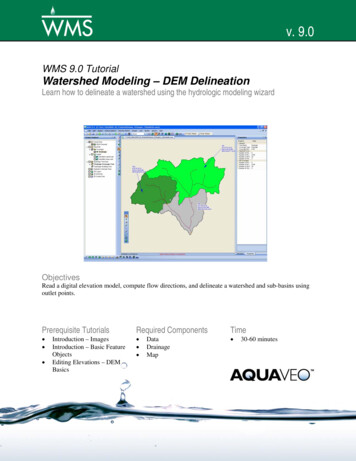
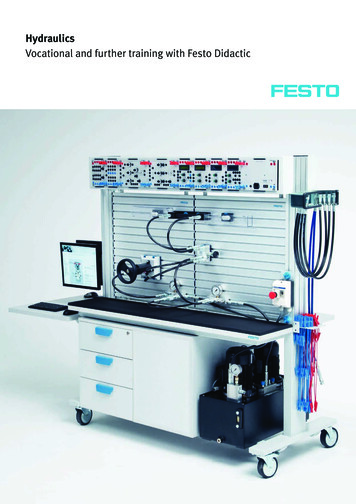
WMS Tutorials6.3Hydraulics and Floodplain Modeling – Floodplain DelineationInterpolating Stages Along the CenterlineYou should now have a scatter point created with a computed water surface elevation ateach cross section where it intersects the centerline as shown in Figure 6-1. In order forthe flood delineation to work better we want to interpolate values along the centerline.Figure 6-1: Labels for each cross section.1. Make sure the 1D-Hyd Centerline coverage is active in the ProjectExplorer (this should also activate the River Tools menu in the Modeldrop-down list).2. Select River Tools Interpolate Water Surface Elevations3. Set the Create a data point field to At a specified spacing4. Enter 30 for the spacing5. Select OKYou should see many scatter points added along the centerline arcs, resulting in a viewsimilar to that in Figure 6-2 (the symbol for scatter points may be different).Page 9 of 15 Aquaveo 2012
WMS TutorialsHydraulics and Floodplain Modeling – Floodplain DelineationFigure 6-2: View of interpolated scatter points.If your scatter points did not interpolate as shown above, the most probable reason is thatthe original scatter points were not placed close enough to the Centerline arc. In order tocontinue, delete the scatter point set and either try creating the points again, or open thesample scatter point set contained in samplescatter.wms.6.4Delineate the Floodplain1. Switch to the Terrain Data module2. Select Flood Delineate3. Change the Max search radius to 10004. Toggle on the Flow path option and enter a Max flow path value of 10005. Select OK6. Turn on the display of the flood depth contours, elevation (elev) fd in theTerrain Data folder of the Project Explorer, to view the resultsWe have finished delineating a floodplain based on the water elevations that wecalculated on our own. The next section will describe how to open a set of scatter pointsthat were entered into a text file.Page 10 of 15 Aquaveo 2012
WMS Tutorials7Hydraulics and Floodplain Modeling – Floodplain DelineationDelineation from HEC-RAS Data7.1Reading the HEC-RAS SolutionIn this section, we will use water surface elevations computed as a result of a separateexercise that builds a HEC-RAS project. First, we will read a WMS project file thatcontains a TIN and then import a HEC-RAS solution from a model developed from theTIN:1. Select File New2. Select No when asked if you want to save changes3. Select File Open4. Open “flood.wms”To simplify the display, we will hide some elements of the model5. From the Project Explorer, hide Land (TIN) in the Terrain Data folder bytoggling off its check box6. Switch to the River module7. Select Display Display Options8. On the River Data tab, toggle off the River Hydraulic Schematic check box9. Select OK10. Select HEC-RAS Read Solution11. Open “hecrun.prj”The HEC-RAS solution is read in as a set of scatter points, with one water surfaceelevation for each cross section. The floodplain delineation interpolation will work muchbetter if there are more points than the sparsely spaced points that are part of the solution.To increase the density of the scatter points, we will interpolate between existing pointsto create additional points along the centerline and cross section arcs. Since the watersurface is assumed constant along a cross section and varies linearly between this doesnot violate any of the modeling assumptions.12. Toggle off the check box for the Materials coverage13. Activate the 1D-Hyd Centerline coverage in the Project Explorer14. If needed, choose River Tools from the Model drop-down list15. Select River Tools Interpolate Water Surface Elevations16. Choose At a specified spacing for the Create a data point option17. Enter 60 for the Data point spacing18. Select OK19. Select the 1D-Hyd Cross Section coverage from the Project Explorer20. Select River Tools Interpolate Water Surface Elevations21. Select OK to interpolate with the options set as beforePage 11 of 15 Aquaveo 2012
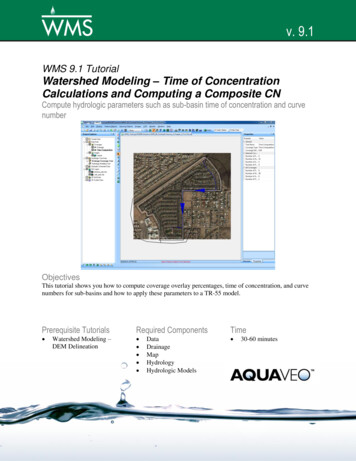
WMS TutorialsHydraulics and Floodplain Modeling – Floodplain DelineationYou should now see that your screen is more densely populated with scatter points. Notethat along the centerline arcs, the scatter points have been interpolated in a linear fashion,while along cross section arcs, the points that were added have the same data value as theoriginal point.7.2Using a Flood Barrier CoverageWMS allows users to “confine” a delineation from the given elevation data by creating aflood barrier coverage. Arcs representing ridges or levees (existing or proposed) may becreated in the model, and these in turn alter the floodplain delineation by restrictinginterpolation of the floodplain so that values on the “dry” side of the levee are notinterpolated. In this exercise, a map file of arcs representing a proposed levee will beused to demonstrate the effects of incorporating a flood barrier coverage.1. Select File Open2. Open the file named “levee.map”Two new coverages are now added to the Map Data folder in the Project Explorer. Thecoverage entitled proposed levee is a Flood Barrier coverage and breakline is a Generalcoverage.3. Verify that proposed levee is the active coverage in the Project Explorer4. Select the Zoom tool5. Zoom in around the proposed levee as shown in Figure 7-1. The proposedlevee is located along the west bank of the tributary stream.Figure 7-1: Zoom in on the arc representing the leveeContouring of floodplain data sets in WMS is based on TIN vertices. Therefore, it isimportant to make any necessary changes to the TIN before performing floodplaindelineation, especially if comparisons are to be made between different scenarios.Page 12 of 15 Aquaveo 2012
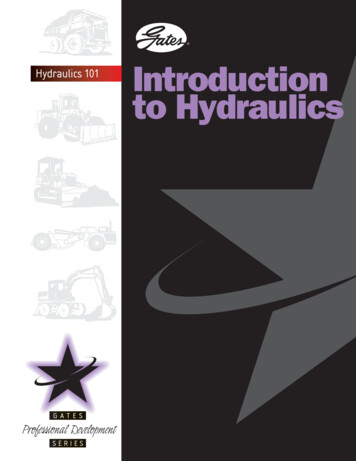
WMS TutorialsHydraulics and Floodplain Modeling – Floodplain DelineationThe flood extent is contoured to midpoints on triangle edges between flooded and dryareas. It is therefore recommended that a breakline be created on the “river side” of theflood barrier coverage in order to improve the visualization of the delineated floodplain.This breakline and the flood barrier are then forced into the TIN, effectively confining theflood contours between the two.You will now force the flood barrier and breakline arcs into the TIN. The breakline islocated immediately to the east of the flood barrier (you probably cannot see it unless youzoom in closely around the flood barrier arc).To better distinguish the proposed levee and breakline arcs, hide the 1D-Hyd Centerlinecoverage.6. Toggle off the check box for 1D-Hyd Centerline coverage in the ProjectExplorer7. Choose the Select Feature Arc tool8. Select the flood barrier arc9. Select Feature Objects Arcs - Breaklines10. When prompted, choose Use all arcs as breaklines11. Select OK12. At the next prompt, choose Interpolate Z values from existing TIN13. Select OK14. Activate the Breakline coverage by selecting it from the Project Explorer15. Select the breakline arc16. Select Feature Objects Arcs - Breaklines17. When prompted, choose Use all arcs as breaklines18. Select OK19. At the next prompt, choose Interpolate Z values from existing TIN20. Select OK7.3Delineating the FloodplainNow that we have added the breaklines to our TIN, we are ready to delineate the floodplain:1. Switch to the Terrain Data module2. Select Flood Delineate3. Choose the User defined flood barrier coverage option4. Make sure the Search radius option box is toggled on and enter 1000 forthe Max search radius5. Enter 500 for the Max flow distance6. Make sure the Quadrants check box is toggled on7. Enter 4 for the Number of stages in a quadrantPage 13 of 15 Aquaveo 2012
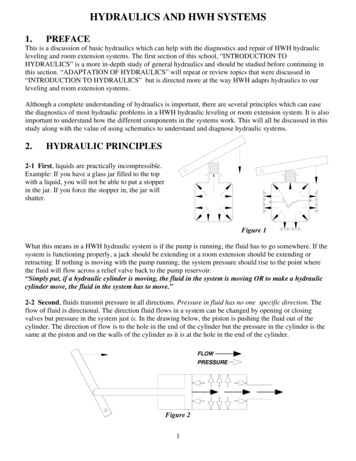
WMS TutorialsHydraulics and Floodplain Modeling – Floodplain Delineation8. We will accept the default solution and data set names9. Select OKIt may take some time for WMS to compute the floodplain delineation10. From the Project Explorer, toggle-on the Land (TIN) check box in theTerrain Data folder to show it again11. Select the Frame macro12. Select the data set named W.S. Elev-PF 1 fd in the W.S. Elev-PF 1(FLOOD) folder13. Your screen should appear similar to Figure 7-2Figure 7-2: Plot of floodplain depthsThese contours correspond to the water depths in the floodplain area. To view the watersurface elevation data set:14. Select the data set named W.S. Elev-PF 1 wl from the Project Explorer8Creating a Flood Extent CoverageFlood depth and water level information are stored with the TIN, but WMS allows for thecreation of feature objects from this data. In floodplain delineation, it may be useful tocreate a flood extent coverage. This coverage defines the boundary of the flood and maybe exported for use in GIS applications. To create the flood extent coverage:Page 14 of 15 Aquaveo 2012
Hydraulics and Floodplain Modeling – Floodplain DelineationWMS Tutorials1. Select Flood Conversion Flood - Extent Coverage2. Select W.S. Elev-PF 1 fd from the Select Flood Depth Data Set list3. Select OK (we will accept the default inundation limit and coverage name)4. If prompted, select OK to use all arcsThe flood extent boundary is converted to feature lines and WMS will try to build apolygon enclosing the flooded area. However in this case it reaches the boundary of theTIN and so a complete polygon is not available. You could close the polygon manuallybe creating an arc to along the TIN boundary and then choosing to Build Polygons.9Creating a Flood Depth CoverageThe flood extent coverage essentially divides the watershed area into two parts: floodedand not flooded. However, it is often necessary to know not only if an area is flooded butalso how much flooding has occurred.It is common to divide the flooded area into zones, each with a depth range. In WMS,these zones are created by making a flood depth coverage. To create a flood depthcoverage:1. Select Flood Conversion Flood - Depth Map2. Select W.S. Elev-PF 1 fd from the Select Flood Depth Data Set combo box3. Note the ranges and attributes of the five “zones” or “flood classes”4. Select OK5. Select the Zoom tool6. Zoom in to view the bottom portion of the main channel7. Switch to the Map module8. Click on the Select Feature Polygon tool9. Double-click inside a few of the polygons that have been created. This willbring up the flood extent attributes, which include the average flood depthfor the zone.10ConclusionAfter completing this exercise, you should be familiar with using WMS to performfloodplain delineations in conjunction with: A flood barrier coverage Water surface elevations computed with HEC-RAS User-defined water surface elevations, created either interactively, or openedwith a 2D scatter point file Post-processing in the form of creating Flood Extent, Flood Depth, and FloodImpact mapsPage 15 of 15 Aquaveo 2012
geometry. For more details on these delineation options, refer to the WMS Help. To experiment with some of the delineation options, we will open a TIN and a scatter point set. The TIN contains the land surface elevations and the scatter point set contains water surface elevations. 1. Close all instances of WMS 2. Open WMS 3. Select File Open 4.