Transcription
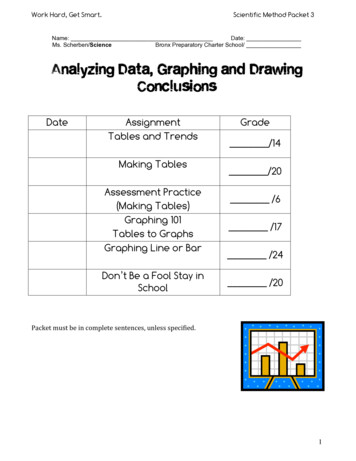
Work Hard, Get Smart.Scientific Method Packet 3Name:Date:Ms. Scherben/ScienceBronx Preparatory Charter School/Analyzing Data, Graphing and DrawingConclusionsDateAssignmentTables and TrendsMaking TablesAssessment Practice(Making Tables)Graphing 101Tables to GraphsGraphing Line or BarDon’t Be a Fool Stay inSchoolGrade/14/20/6/17/24/20Packet must be in complete sentences, unless specified.1
Work Hard, Get Smart.Scientific Method Packet 3Tables and TrendsAim:Brain Starter: What are some current trends that you know about?In science trends are useful because they help us makeWhen describing trends good words to use are:orPracticeEx. 1: What TREND does this data show?Every time the weight of the bench pressthe number of reps.Weight BenchPressed (kg)100115130145Number ofReps3224168Can we make this trend more specific?Every time the weight of the bench pressby , the number of repsby .2
Work Hard, Get Smart.Scientific Method Packet 3Ex. 2 What TREND does this data show?Can we be more specific? Why or why not?Ex. 2: What TREND does this data show?Mass of Object(kg)24282122Time ittakes to fallin a vacuum(seconds)4.94.94.94.9Ex. 4: What TREND does this data show? (Be Specific)Minutes on a HotPlate0Temperature C53010351540253
Work Hard, Get Smart.Scientific Method Packet 3Ex. 5Protein and fiber are parts of a healthy diet.Using that information, which of the types of flour is the HEALTHIEST?Ex. 6What CONCLUSION can you make based on the information above?4
Work Hard, Get Smart.Scientific Method Packet 3Making Predictions from DataEx.1: Find out how much the table changes each time.Changes byeach timeAmount of water(liters)2468Tree Growth(meters)5101520Changes byeach timeWhat is the trend?Ex.2: Complete the table after finding out how much the tablechanges each time.Time Burned(hours)Changes byeach time137Height ofCandle(centimeters)503020Changes byeach timeWhat is the trend?5
Work Hard, Get Smart.Scientific Method Packet 3Ex.2: Complete the table after finding out how much the tablechanges each time.Changes byeach timeNumber of ClassesSkipped0Average Grade10090Changes by23each timeWhat is the trend?Ex.4: Complete the table after finding out how much the table changes each time.Changes byeach timeVoltage (Volts)2468Current (Amps)20406080Changes byeach timeWhat is the trend?What would the current be if the voltage was 10?6
Work Hard, Get Smart.Scientific Method Packet 3Ex. 5: Fill in the rest of the table.What is the trend?Ex. 6What is the 2What would the acceleration be if the force was 80 Newtons?Tables and Trends/14/17 7
Work Hard, Get Smart.Scientific Method Packet 3Making TablesAim:Brain Starter: Check out this table of hypothetical computers (DigiTek, Compex, and Cyberdyne).Answer the following questions about the table above.1. Which computer has the cheapest extragigabyte of Random Access Memory(RAM)?2. If you wanted to buy a computerwithout extra RAM or hard drive space,which computer is the best to buy?3. Which computer is the most expensive if you buy it with all the extra options?4. Which computer is the best deal if you really need extra RAM but not extra drive space?5. How much would it cost to buy a Compex computer with an extra 70GB of hard drive space (butno extra RAM)?Practice Makes PerfectEx. 1. Rashawn wants to test if a weight of a basketball affected how farhe could throw it.a. Identify the independent variable:b. Identify the dependent variable:c. What are three things that Rashawn would have to keep constant?8
Work Hard, Get Smart.Scientific Method Packet 31)2)3)d. What is your hypothesis?e. In the results, Rashawn would measureand record it in a data table.Rashawn finds that he can throw a 10 kg basketball 50 meters, hecan throw a 20 kg shotput 40 meters, he can throw a 30 kgshotput 30 meters, and he can throw a 40 kg shot 20 meters.Make a data table showing the results.d. Set up table: 1) Title (state cause and effect relationship), 2) Label Categories, 3) Input dataTitleIndependent VariableDependent Variablee. What is the trend?f. Draw a conclusion: Did the data support or disprove your hypothesis?9
Work Hard, Get Smart.Scientific Method Packet 3Ex. 2: Jennifer was conducting the experiment testing thequestion: “What is the effect of different colors of light onplant height?” In her experiment she was going to test red,yellow, green and blue light for six days. She measured theplants after each day.a. Identify the independent variable:b. Identify the dependent variable:c. What are three things that Jennifer would have to keep constant?1)2)3)d. What is your hypothesis?e. In the results, Jennifer would measureand record it in a data table.d. Set up table: 1) Title (state cause and effect relationship), 2) Label Categories, 3) Input dataTitle10
Work Hard, Get Smart.Scientific Method Packet 3Practice putting your observations into the data table above.Day 1: Red 2cm, Yellow 2cm, Green 2cm, Blue 2cmDay 2: Red 2cm, Yellow 2cm, Green 3cm, Blue 3cmDay 3: Red 3cm, Yellow 2cm, Green 4cm, Blue 3cmDay 4: Red 3cm, Yellow 2.5cm, Green 4.5cm, Blue 3.5cmDay 5: Red 3.5cm, Yellow 3cm, Green 5cm, Blue 3.5cmDay 6: Red 3.5cm, Yellow 3.5cm, Green 5.5cm, Blue 4cme. Were there any trends? (Hint you can compare different plants but they have to be on the same day)f. Draw a conclusion: Did the data support or disprove your hypothesis?Making Tables/2011/17
Work Hard, Get Smart.Scientific Method Packet 3Assessment Practice.Directions: Read the following passage and use the information given to answer the questions.22. Amanda made this entry in her laboratory notebook: “We are doing an experiment to determine if thesize of soil particles affects the amount of water that flows through soil. We poured 100 milliliters (mL) ofwater through four different types of soil. The equipment is shown below.We got the following results: With gray soil, the average particle size was 2.0 millimeters (mm) and 80 mLof water flowed through. We then used tan soil. Its average particle size was 0.5 mm and 40 mL of waterflowed through. With brown soil, 60 mL of water flowed through. Brown soil has an average particle sizeof 1.5 mm. In our last trial we used black soil. It has an average particle size of 1.0 mm and 50 mL ofwater flowed through.”a Using the data table below, organize the results to show the average particle size and the amount of waterthat flowed through for each type of soil. Be sure to include column headings, data, and units in the table.[6 points]b What is the dependent variable in this experiment? [2 points].c What conclusion can be drawn from the data that the students collected? [4 points]Assessment Practice/612
Work Hard, Get Smart.Scientific Method Packet 3Graphing 101Aim:Brain Starter:Ex7: What is the trend?Temperature( C)10152025Amount ofDissolved Oxygen(mg/L)1000950900850How much dissolved oxygen would there be if the temperature was 45 C?Types of Graphs13
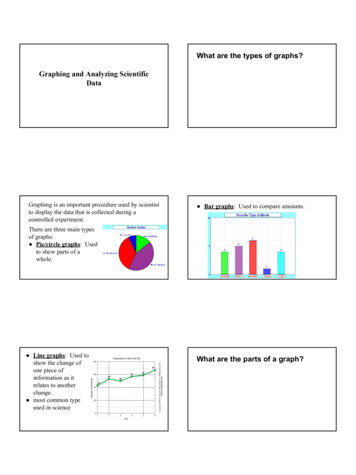
Work Hard, Get Smart.Scientific Method Packet 3This year in science we are going to focus on two types of graphs. They areand graphs.GraphsScientists use graphs because .Bar graphs are used when the independent variable isand the dependent variable is.Line graphs are used when the independentvariableis and thedependent variable is.14
Work Hard, Get Smart.Scientific Method Packet 3Parts of a GraphCheck list for GraphsGraph ElementTitleCriteria Plot data pointsCommunicates experiments purpose; identifies variablesbeing investigated.x-axis correctly labeled with the name/unit of independentvariabley-axis correctly labeled with the name/unit of dependentvariablex-axis correctly divided into a scale for a line graph or intocategories for a bar graphy-axis correctly subdivided into a scaleData pairs correctly plotted.Analyze trendsTrend is described accurately.Label axesDetermine scales foraxesGraphing 101/5 15
Work Hard, Get Smart.Scientific Method Packet 3Tables to GraphsLength of Pieces of RopeColor RopegreenredorangeyellowLength (in feet)15191321If it takes twenty-one inches of rope to go all the wayaround the fence post, how many times will theorange rope go around the post?Which piece of rope is 15 yards long?Which piece or pieces of rope are more than 12 feetlong but less than 22 feet long?The Weekly Growth of a Plant.End of Week#1#2#3#4#5Height (cm)28101214At the end of which week(s) was the plant taller than 2centimeters?At the end of which week(s) was the plant no more than 8centimeters tall?16
Work Hard, Get Smart.Scientific Method Packet 3How tall was the plant at the end of week #5?Number of Books OwnedNumber of Books el44Destiny96Emma88Which of the children own atleast 68 books?Michael received threebooks on his birthday. Onthe same day, Michael gaveNicole four books. Howmany books does Michael have?If Emma gave ten books to Daniel, how many bookswould Daniel have?Monthly Rain Fall in MuddytownBetween which two months did the monthly rainfallinch?Monthly Rain Fall in Rain (inches)67162224181097659total increase by 1Which month had thelowest monthlyrainfall?Which month had the most monthly rainfall?17
Work Hard, Get Smart.Scientific Method Packet 3ChallengeA group of students were trying to figure out if the temperature of the water affected the speed of acrawfish. They set up 8 tanks of water and kept them at different temperatures. They then placedcrawfish in each tank and made them swim and measured their speed. Using the data at the left,construct a graph that shows the relationship between water temperature and crawfish speed.Don’t forget to:1) Create a title2) Label your axes3) Make an appropriate scale4) Mark an X at each data point and connect them with a 302.5352.5401.9451.5501.2Tables to Graphs/1718
Work Hard, Get Smart.Scientific Method Packet 3Graphing: Line or Bar?Aim:Brain Starter:Ex.2: Complete the table after finding out how much the table changes each time.Changes byeach timeHeight of Ramp(cm)103070Speed of BallCm/s204050Changes byeach timeWhat is the trend?Which one is it? Write if it is a bar or line graph.1. The Rate at Which Water Drains Through Different Brands of Coffee Filters2. The Effect of Color on Sales of Roses at a Florist3. The Effect of Depth on Water Temperature in a Lake4. The Effect of Temperature on the Amount of Sugar that Dissolves in TeaNote About How to Make the Best Scale.Almost always start at zero.Scales always increase by the same amount.One way to do it is to see the highest and lowest value of a group. If there is a large difference forexample 0 to 100. Then you might want to count by a large number like 10. If it is 1 to 10 then youmight want to count by 1s.What ever you do make sure you are always increasing by the same amount. For example:(0, 2, 4, 6, 8, 10)(0, 0.5, 1.0. 1.5, 2.0, 2.5)(0, 5, 10, 15, 20, 25)19
Work Hard, Get Smart.Scientific Method Packet 3Graph the following charts as either a line or bar graph. Make sure to check off all of the steps.Graph ElementTitleDraw and label axesDetermine scales for axesPlot data pointsAnalyze TrendsCriteriaClearly identifies what was being measuredx-axis correctly labeled with the name/unit of independent variabley-axis correctly labeled with the name/unit of dependent variable x-axis correctly subdivided—into a scale for a line graph, intocategories for a bar graphy-axis correctly subdivided into a scaleData points correctly written.Data pairs correctly plotted.Trend or Data was analyzed accurately and clearly.Gasoline Mileage of Different Compact CarsCompact CarMiles to f you were looking to buy a car that was good on gas, what would be your top two choices and why? Use the data toexplain your answer.20
Work Hard, Get Smart.Graph ElementTitleScientific Method Packet 3CriteriaClearly identifies what was being measuredx-axis correctly labeled with the name/unit of independent variabley-axis correctly labeled with the name/unit of dependent variableDraw and label axesDetermine scales for axesPlot data pointsAnalyze Trends x-axis correctly subdivided—into a scale for a line graph, intocategories for a bar graphy-axis correctly subdivided into a scaleData points correctly written.Data pairs correctly plotted.Trend or Data was analyzed accurately and clearly.The Effects of Temperature on the Germination of a Radish SeedsTemperature ( C)05102030Average Germination Rate (%)05153045Describe the trend.Line or Bar/2421/17
Work Hard, Get Smart.Scientific Method Packet 3NameDate:ScienceBronx Prep/Dont Be a Fool, Stay In School.Statistical Evidence that Grades Pay.Create a graph from the following charts. Determine which one is a line and bar graph. Use the check list to makesure your graphs are complete and correct.Graph Check ListGraph ElementTitleDraw and label axesDetermine scales foraxesPlot data pointsAnalyze TrendsCriteriaCommunicates experiments purpose; identifies variables beinginvestigated.x-axis correctly labeled with the name/unit of independentvariabley-axis correctly labeled with the name/unit of dependentvariablex-axis correctly subdivided—into a scale for a line graph, intocategories for a bar graphy-axis correctly subdivided into a scaleData points correctly written.Data pairs correctly plotted.Described the trend accurately using the terms increase ordecrease.Chart 1.Years in school11 or less12131415161718Graph 1Graph 2Chart 2.Yearly Income 20,000 26,000 28,000 30,000 32,000 44,000 46,000 57,000Level of EducationHigh School DropoutHigh School GraduateSome CollegeCollege GraduateGraduate degreeYearly Income 20,000 26,000 32,000 44,000 57,00022
Work Hard, Get Smart.Scientific Method Packet 3Describe the trend.23
Work Hard, Get Smart.Scientific Method Packet 3Describe the trend.Don’t Be a Fool/20/1724
Work Hard, Get Smart.Scientific Method Packet 3Prepare for a quiz and test soon.Question Box25
Analyzing Data, Graphing and Drawing . a Using the data table below, organize the results to show the average particle size and the amount of water that flowed through for each type of soil. Be sure to include column headings, data, and units in the table. . Scientific Method Packet 3 19 Graphing: Line or Bar? Aim:_ .