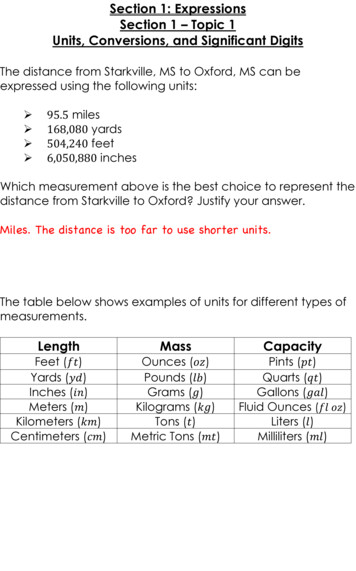
Transcription
PRECALCULUS I: COLLEGE ALGEBRA GUIDED NOTEBOOK FOR USE WITH SULLIVAN AND SULLIVANPRECALCULUS ENHANCED WITH GRAPHING UTILITIES, BY SHANNON MYERS (FORMERLY GRACEY)Section 1.1: THE DISTANCE AND MIDPOINT FORMULAS; GRAPHINGUTILITIES; INTRODUCTION TO GRAPHING EQUATIONSWhen you are done with your homework you should be able to πππππππUse the Distance FormulaUse the Midpoint FormulaGraph Equations by Hand by Plotting PointsGraph Equations Using a Graphing UtilityUse a Graphing Utility to Create TablesFind Intercepts from a GraphUse a Graphing Utility to Approximate InterceptsWARM-UP:What grade do you want to earn in this class?For each unit, how many hours should you spend on the class?How many hours for “class time”?How many hours for homework, test prep, etc.?When should you work on math?RECTANGULAR COORDINATESWe locate a on the real number line by assigning it a single realnumber, called the of the point. For work in a twodimensional , points are located by using numbers.The rectangular or Cartesian coordinate system consists of real numberlines, one and one . The horizontal line iscalled the and the vertical line is called the .The point of intersection is located at the ordered pair and is
called the . Assign to every pointon these number lines using a convenient scale. The scale of a number line is thedistance between and . Once you set the scale, it stays the same onthat particular axis. Sometimes the scale on the x- and y-axes differ. Forexample, if you are sketching a line that has x-coordinates that can be easilyviewed using a scale between -6 and 6 and y-coordinates that are better viewedbetween -1 and 1, you may want to set the scale for the x-axis as and the yaxis as .Points on the x-axis to the right of O are associated with realnumbers, and those to the of O are associated withreal numbers. Points on the y-axis above O are associatedwith real numbers, and those O areassociated with real numbers. The divide theinto regions, called . The pointslocated on the are in any quadrant. Eachin the rectangular coordinate system to anof real numbers, .Created by Shannon Myers (formerly Gracey)2
Example 1:a. Plot the following ordered pairs. Identify which quadrant or on whatcoordinate axis each point lies.A ( 2,5 )B C ( 3, 7 )( 2, 0 )b. Plot the points ( 0,3) , (1,3) , ( 5,3) , ( 4,3) . Describe the set of all points of theform ( x,3) wherexis a real number.GRAPHING UTILITIESAll graphing utilities graph equations by points. The screenitself consists of small rectangles, called . The more pixelsthe screen has, the better the resolution. When a point to be plotted lies inside apixel, the pixel is turned on (lights up). The graph of an equation is a collection ofpixels.Created by Shannon Myers (formerly Gracey)3
The screen of a graphing calculator will display the coordinate axes of arectangular coordinate system, but you need to set the on eachaxis. You must also include the and valuesof and that you want included in the graph. This is calledthe or.Xmin: the value of shown on the viewing windowXmax: the value of shown on the viewing windowXscl: the number of per mark on theYmin: the value of shown on the viewing windowYmax: the value of shown on the viewing windowYscl: the number of per mark on theExample 2:a. Find the coordinates of the point shown below. Assume the coordinates areintegers.b. Determine the viewing window used.Created by Shannon Myers (formerly Gracey)Xmin:Xmax:Xscl:Ymin:Ymax:Yscl:4
DISTANCE FORMULAThe distance between two points and ,denoted by , isExample 3: Find the distance between each pair of points.a. P1 ( 4, 3) and P2 ( 6, 2 )Created by Shannon Myers (formerly Gracey) b. P1a, a ) and P2 ( 0, 0 )( 5
Example 4: Consider the points A ( 2,5) , B (12,3) , and C (10,11) .a. Plot each point and form the triangle ABC.b. Verify that the triangle is a right triangle.c. Find its areaCreated by Shannon Myers (formerly Gracey)6
THE MIDPOINT FORMULAConsider a line segment whose endpoints are and .The midpoint, , isExample 5: Find the midpoint of the line joining the pointsa. P1 (1, 4 )and P2 ( 2, 7 ) b. P1P1 and P2 .a, a ) and P2 ( 0, 0 )( GRAPH EQUATIONS BY HAND BY PLOTTING POINTSAn in , say and ,is a statement in which two expressions involving x and y are .The expressions are called the of the equation. Since an equationis a statement, it may be or , depending on the value ofthe variables. Any values of x and y that result in a true statement are said tothe equation.The of an inx and y consists of the of points in the plane whosecoordinates satisfy the equation.Created by Shannon Myers (formerly Gracey)7
Example 6: Tell whether the given points are on the graph of the equation.Equation: y x3 2 xPoints: ( 0, 0 ) ; (1,1) ; (1, 1)GRAPHING EQUATIONS USING A GRAPHING UTILITYTo graph an equation in two variables x and y using a graphing calculator requiresthat the dependent variable, y, be isolated.PROCEDURES THAT RESULT IN EQUIVALENT EQUATIONS1. Interchange the two sides of the equation:is equivalent to2. Simplify the sides of the equation by combining like terms, eliminatingparentheses, etc.:is equivalent to3. Add or subtract the same expression on both sides of the equation:is equivalent to4. Multiply or divide both sides of the equation by the same nonzero expression:is equivalent toCREATED BY SHANNON MYERS (FORMERLY GRACEY)8
Example 7: Solve for y. 1 5 x 3 2y 6()a. y 1 2 23b. 4 y x CREATED BY SHANNON MYERS (FORMERLY GRACEY)9
HOW TO GRAPH AN EQUATION USING THE TI-83/TI-84 GRAPHINGCALCULATOR1. Solve the equation for in terms of .2. Enter the equation to be graphed into your graphing calculator.a. Use the “y ” key.b. Graph the equation using the standard viewing window.c. Adjust the viewing window.HOW TO USE THE TI-83/TI-84 TO CREATE TABLES1. Solve the equation for in terms of .2. Enter the equation to be graphed into your graphing calculator.3. Set up the table. In the AUTO mode, the user determines the starting pointfor the table and delta table, which determines the increment for x in thetable. The ASK mode requires the user to enter values of x, and then thecalculator determines the value of y.4. Create the table.CREATED BY SHANNON MYERS (FORMERLY GRACEY)10
Example 8: The graph of an equation is given. List the intercepts of the graph.a.b.Example 9: Graph each equation by hand by plotting points. Verify your resultsusing a graphing utility.y 3x 9a. x y 3x 9CREATED BY SHANNON MYERS (FORMERLY GRACEY)( x, y )11
x2 1b. y xy x2 1( x, y )APPLICATIONSA major league baseball “diamond” is actually a square, 90 feet on a side. What isthe distance directly from home plate to second base (the diagonal of a square)?Give the exact simplified result first, and then round to the nearest hundredth.CREATED BY SHANNON MYERS (FORMERLY GRACEY)12
Section 1.2: INTERCEPTS; SYMMETRY, GRAPHING KEY EQUATIONSWhen you are done with your homework you should be able to π Find Intercepts Algebraically from an Equationπ Test an Equation for Symmetryπ Know How to Graph Key EquationsWarm-up: Solve.a.3 x 4 ( 2 x 8 ) 3 5 xb.2 x2 x 3CREATED BY SHANNON MYERS (FORMERLY GRACEY)13
PROCEDURE FOR FINDING INTERCEPTS1. To find the , if any, of the graph of an equation,let in the equation and solve for , whereis a real number.2. To find the , if any, of the graph of an equation,let in the equation and solve for , whereis a real number.Example 1: Find the intercepts and graph each equation by plotting points.a. y x 6xy x 6CREATED BY SHANNON MYERS (FORMERLY GRACEY)( x, y )14
24b. 4 x y x4 x2 y 4( x, y )DEFINITION: SYMMETRYA graph is said to be symmetric with respect to the if, forevery point on the graph, the point is also on thegraph.A graph is said to be symmetric with respect to the if, forevery point on the graph, the point is also on thegraph.CREATED BY SHANNON MYERS (FORMERLY GRACEY)15
A graph is said to be symmetric with respect to the if, forevery point on the graph, the point is also on thegraph.TESTS FOR SYMMETRY: Replace by in the equation. If anequation results, the graph of the equation iswith respect to the .: Replace by in the equation. If anequation results, the graph of the equation iswith respect to the .: Replace by and byCREATED BY SHANNON MYERS (FORMERLY GRACEY)16
in the equation. If an equation results, the graph of theequation is with respect to the .Example 2: Plot the point ( 4, 2 ) .Plot the point that is symmetric to ( 4, 2 ) with respect to thea. x-axisb. y-axisc. originExample 3: Draw a complete graph so that it has the type of symmetry indicated.a. x-axisb. y-axisc. originCREATED BY SHANNON MYERS (FORMERLY GRACEY)17
PRE-CALCULUS I: COLLEGE ALGEBRA/FOR USE WITH SULLIVAN, MICHAEL AND SULLIVAN, MICHAEL III PRECALCULUSENHANCED WITH GRAPHING UTILITIESExample 4: List the intercepts and test for symmetry.2a. y x 942b. y x 2 x 8CREATED BY SHANNON MARTIN GRACEY18
c. y 5 xx4 1d. y 2 x5CREATED BY SHANNON MYERS (FORMERLY GRACEY)19
y x 2 6 x , what is a ?Example 5: If ( a, 5 ) is on the graph of KNOW HOW TO GRAPH KEY EQUATIONSExample 6: Sketch the graph using intercepts and symmetry.a. y x1xy 1xCREATED BY SHANNON MYERS (FORMERLY GRACEY)( x, y )20
b.x y2x y2c.y( x, y )y x3CREATED BY SHANNON MYERS (FORMERLY GRACEY)21
y x3x( x, y )1.3: SOLVING EQUATIONS USING A GRAPHING UTILITYWhen you are done with your homework, you should be able to π Solve Equations Using a TI-83/TI-84 Graphing CalculatorWarm-up: Solve for y.a. x 8 y 7b.x3 2 y 6SOLVE EQUATIONS USING A TI-83/TI-84 GRAPHING CALCULATORWhen a graphing calculator is used to solve an equation, usuallysolutions are obtained. Unless otherwise stated, we willapproximate solutions as decimals rounded to decimal places.The or feature of a graphingcalculator can be used to find the solutions of an equation when one side of theequation is . In using this feature to solve equations, we make use ofCREATED BY SHANNON MYERS (FORMERLY GRACEY)22
the fact that when the graph of an equation in variables, and, crosses or touches the then .For this reason, any value of for which will be ato the equation. That is, solving an equation for whenone side of the equation is 0 is equivalent to finding where the graph of thecorresponding equation in two variables crosses or touches the .STEPS FOR APPROXIMATING SOLUTIONS OF EQUATIONS USING ZEROOR ROOT1. y. So you will have y {expression in x}.2. Graph .3. Use ZERO or ROOT to determine each of thegraph.Example 1: Use ZERO or ROOT to approximate the real solutions, if any, of eachequation rounded to two decimal places.420a. 3 x 8 x 2 x 9 CREATED BY SHANNON MYERS (FORMERLY GRACEY)30b. x 8 x 1 23
STEPS FOR APPROXIMATING SOLUTIONS OF EQUATIONS USINGINTERSECT1. Graph andgraph2. Use INTERSECT to determine the of eachpoint in the intersection.Example 2: Use ZERO or ROOT to approximate the real solutions, if any, of eachequation rounded to two decimal places.42a. x 1 2 x 3CREATED BY SHANNON MYERS (FORMERLY GRACEY)b.1 31 2x 5x x 44524
Example 3: Solve each equation algebraically. Verify your solution using a graphingcalculator.a. 5 ( 2 x 1) 10 x418 5 b.y2y320c. x 2 x 9 x 18 CREATED BY SHANNON MYERS (FORMERLY GRACEY)25
1.4: LINESWhen you are done with your homework, you should be able to ππππππππππCalculate and Interpret the Slope of a LineGraph Lines Given a Point and the SlopeFind the Equation of a Vertical LineUse the Point-Slope Form of a Line; Identify Horizontal LinesFind the Equation of a Line Given Two PointsWrite the Equation of a Line in Slope Intercept FormIdentify the Slope and y-Intercept of a Line from Its EquationGraph Lines Written in General Form Using InterceptsFind Equations of Parallel LinesFind Equations of Perpendicular LinesWarm-up: Solve. 5 x 2 (1 3 x ) x 3CALCULATE AND INTERPRET THE SLOPE OF A LINECREATED BY SHANNON MYERS (FORMERLY GRACEY)26
Consider the staircase to the left. Eachstep contains exactly the same horizontaland the same vertical. The ratio of the rise to the run,called the , is a numericalmeasure of theof the staircase.DEFINITIONLet and be two distinct points. If, the , , of the nonvertical line Lcontaining P and Q, is defined by the formulaIf , L is a line and the slope m of L is(since this results in division by ).Example 1: Determine the slope of the line containing the given points.a.( 4, 2 ) ; ( 3, 4 )b.( 1,1) ; ( 2,3)CREATED BY SHANNON MYERS (FORMERLY GRACEY)c.( 2, 0 ) ; ( 2, 2 )27
SQUARE SCREENSTo get an undistorted view of slope, the same must be used oneach axis. Most graphing calculators have a rectangular screen. Because of this,using the same interval for x and y will result in a distorted view. On mostgraphing calculators, you can obtain a square screen by setting the ratio of x to yat .Example 2: On the same square screen, graph the following equations:y1 01x2y3 xy2 y4 4 xExample 3: On the same square screen, graph the following equations:y1 01y2 x2y3 xy4 4 xCREATED BY SHANNON MYERS (FORMERLY GRACEY)28
What have we discovered?1. When the slope of a line is positive, the line slantsfrom left to right.2. When the slope of a line is negative, the line slantsfrom left to right.3. When the slope is zero, the line is .Example 3: Graph the line containing the point P and having slope m. List twoadditional points that are on the line. a. P2,1) ; m( 4b. P (1,3) ; m 25EQUATION OF A VERTICAL LINEA vertical line is given by an equation of the formwhere is the .CREATED BY SHANNON MYERS (FORMERLY GRACEY)29
POINT-SLOPE FORM OF A LINEAn equation of a nonvertical line with slope m that contains the point isEQUATION OF A HORIZONTAL LINEA horizontal line is given by an equation of the formwhere is the .FINDING AN EQUATION OF A LINE GIVEN TWO POINTSEXAMPLE 4: Find an equation of the line containing the points ( 5, 1) and ( 6,8 ) .Graph the line.CREATED BY SHANNON MYERS (FORMERLY GRACEY)30
SLOPE-INTERCEPT FORM OF A LINEAn equation of a line with slope m and y-intercept b isIDENTIFY THE SLOPE AND y-INTERCEPT OF A LINE GIVEN ITSEQUATIONEXAMPLE 5: Find the slope m and y-intercept b of the given equation. Graph theequation.y 5x 2a. 9b. 2 x 3 y EQUATION OF A LINE IN GENERAL FORMThe equation of a line in general form isCREATED BY SHANNON MYERS (FORMERLY GRACEY)31
where , , and are real numbers and A and B are not both zero.GRAPHING AN EQUATION IN GENERAL FORM USING ITS INTERCEPTS 12 by finding its intercepts.EXAMPLE 6: Graph the equation 4 x 2 y xy( x, y )FIND EQUATIONS OF PARALLEL LINESWhen two lines in the plane do not , they are said to be.CRITERION FOR PARALLEL LINESTwo nonvertical lines are if and only if theirare and they have different .SHOWING THAT TWO LINES ARE PARALLELEXAMPLE 7: Show that the lines given by the following equations are parallel.y x 4x y 1CREATED BY SHANNON MYERS (FORMERLY GRACEY)32
FIND EQUATIONS OF PERPENDICULAR LINESWhen two lines at a angle ,they are said to be .CRITERION FOR PERPENDICULAR LINESTwo nonvertical lines are if and only if the product oftheir is .SHOWING THAT TWO LINES ARE PERPENDICULAREXAMPLE 8: Show that the lines given by the following equations areperpendicular.1x 1021y 2 x 3 yCREATED BY SHANNON MYERS (FORMERLY GRACEY)33
FINDING THE EQUATION OF A LINE GIVEN INFORMATIONThe following examples will guide you on how to find the equation of a line whenyou are given different types of information.EXAMPLE 9: Find an equation for the line with the given properties. Express youranswer using the general form and the slope-intercept form.a. Slope 2; containing the point ( 4, 3) . 1 b. Slope undefined; containing the point , 7 . 2 c. x-intercept is -4; y-intercept is 4d. Containing the points ( 3, 4 ) and ( 2,5 ) .CREATED BY SHANNON MYERS (FORMERLY GRACEY)34
5 ; containing the point ( 5,1) .e. Parallel to the line x 2 y f. Perpendicular to the line y 8 ; containing the point ( 3, 4 ) .CREATED BY SHANNON MYERS (FORMERLY GRACEY)35
EXAMPLE 10: The equations of two lines are given. Determine if the lines areparallel, perpendicular, or neither.a. y 4x 5y 4 x 2b.1x 33y 3 x 4 y2.1: FUNCTIONSWhen you are done with your homework, you should be able to ππππDetermine Whether a Relation Represents a FunctionFind the Value of a FunctionFind the Domain of a Function Defined by an EquationForm the Sum, Difference, Product, and Quotient of Two FunctionsWARM-UP: Find the value(s) of x for which the rational expressionx 1is2 x x 102undefined.DETERMINE WHETHER A RELATION REPRESENTS A FUNCTIONWhen the of one variable is to the value of asecond variable, we have a . A relation is abetween two . If andCREATED BY SHANNON MYERS (FORMERLY GRACEY)36
are two elements in these sets and if a relation exists betweenand , then we say that to or thaton , and we write .Relations can be expressed as an , ,and/or a .Example 1: Find the domain and range of the relation.VEHICLENUMBER OF WHEELSCAR4MOTORCYCLE2BOAT0DEFINITION OF A FUNCTIONLet and represent two nonempty sets. A frominto is a relation that associates with each ofexactly element of .FUNCTIONS AS EQUATIONS AND FUNCTION NOTATIONFunctions are often given in terms of rather than asof . Consider the equation below, whichCREATED BY SHANNON MYERS (FORMERLY GRACEY)37
describes the position of an object, in feet, dropped from a height of 500 feetafter x seconds.y 16 x 2 500The variable is a of the variable . For each value of x ,there is one and only one value of . The variable x is called thevariable because it can be any value fromthe . The variable y is called the variablebecause its value on x . When anrepresents a , the function is often named by a letter such asf , g , h, F , G, or H . Any letter can be used to name a function. The domain isthe of the function’s and the range is the of thefunction’s . If we name our function , the input isrepresented by , and the output is represented by . The notation 16 x 500is read “ of ” or “ at . So we may rewrite y 2as . Now let’s evaluate our function after 1 second:Example 2: Determine whether each relation represents a function. Then identifythe domain and range.a.{( 6,1) , ( 1,1) , ( 0,1) , (1,1) , ( 2,1)}CREATED BY SHANNON MYERS (FORMERLY GRACEY)38
b.{( 3,3) , ( 2, 0 ) , ( 4, 0 ) , ( 2, 5)} x 4x .Example 3: Find the indicated function values for f ( x ) 2a. f ( 4 )b. 3 f ( 2 )c. f ( x 1)CREATED BY SHANNON MYERS (FORMERLY GRACEY)39
f ( x h) f ( x), h 0d.hExample 4: Find the indicated function and domain values using the table below.a. h ( 2 )b. h (1)c. For what values of x is h ( x ) 1 ?xh ( x)-22-11001122Example 5: Determine if the following equations define y as a function of x.a. xy 5CREATED BY SHANNON MYERS (FORMERLY GRACEY)2216b. x y 40
FINDING VALUES OF A FUNCTION ON A CALCULATOR3Example 6: Let f ( x ) x x 2 .Use a graphing calculator to find the followingvalues:a. f ( 4 )b. f ( 2 )STEPS FOR FINDING THE DOMAIN OF A FUNCTION DEFINED BY ANEQUATION1. Start with the domain as the set of numbers.2. If the equation has a denominator, any numbers thatgive a denominator.3. If the equation has a of even ,exclude any numbers that cause the expression inside the radical to be.Example 7: Find the domain of each of the following functions.( x)a. h 2x 1CREATED BY SHANNON MYERS (FORMERLY GRACEY)41
b. g ( x ) 8xx 812THE ALGEBRA OF FUNCTIONSConsider the following two functions:f ( x ) 2 x and g ( x ) x 1Let’s graph these two functions on the same coordinate plane.CREATED BY SHANNON MYERS (FORMERLY GRACEY)42
Now find and graph the sum of f and g .(f g )( x ) Now find and graph the difference of f and g . f ( x ) 2 x and g ( x ) x 1(f g )( x ) Now find and graph the product of f and g on your graphing calculator.( fg )( x ) CREATED BY SHANNON MYERS (FORMERLY GRACEY)43
Now find and graph the quotient of f and g on your graphing calculator. f ( x) g THE ALGEBRA OF FUNCTIONS: SUM, DIFFERENCE, PRODUCT, ANDQUOTIENT OF FUNCTIONSLet f and g be two functions. The f g , the f g ,fthe fg , and theg are whosedomains are the set of all real numbers to the domains of fand g , defined as follows:1. Sum:2. Difference:3. Product:4. Quotient: , providedCREATED BY SHANNON MYERS (FORMERLY GRACEY)44
) x 2 4 x and g ( x ) 2 x . Find the following:Example 8: Let f ( x a.(f g )( x )b.(f g )( 4 )d.( fg )( x )e.( fg )( 3)c. f ( 3) g ( 3) f ( x)g f. The domain of 2.2: THE GRAPH OF A FUNCTIONWhen you are done with your homework, you should be able to π Identify the Graph of a Functionπ Obtain Information from or about the Graph of a FunctionWARM-UP:Graph the following equations by plotting points.a.y x2CREATED BY SHANNON MYERS (FORMERLY GRACEY)45
y 3x 1b. THE VERTICAL LINE TEST FOR FUNCTIONSIf any vertical line a graph in more than point,the graph define as a function of .Example 1: Determine whether the graph is that of a function.a.b.CREATED BY SHANNON MYERS (FORMERLY GRACEY)46
c.OBTAINING INFORMATION FROM GRAPHSYou can obtain information about a function from its graph. At the right or left ofa graph, you will often find dots, dots, or .π A closed dot indicates that the graph does not beyond thispoint and the belongs to theπ An open dot indicates that the graph does not beyond thispoint and the DOES NOT belong to theπ An arrow indicates that the graph extends in thedirection in which the arrowREVIEWING INTERVAL NOTATIONCREATED BY SHANNON MYERS (FORMERLY GRACEY)47
INTERVALSET-BUILDERNOTATION NOTATIONGRAPH( a, b )x[ a, b ]x[ a, b )x( a, b ]x( a, )x[ a, )x( ,b )x( ,b]x( , )xExample 2: Use the graph offto determine each of the following.fCREATED BY SHANNON MYERS (FORMERLY GRACEY)48
a.f ( 0)b.f ( 2 )c. For what value ofd. The domain ofe. The range ofx is f ( x ) 3 ?ffExample 3: Graph the following functions by plotting points and identify thedomain and range.CREATED BY SHANNON MYERS (FORMERLY GRACEY)49
a. f ( x ) x 2b. H ( x ) x2 1Example 4: Consider the function f ( x ) CREATED BY SHANNON MYERS (FORMERLY GRACEY)x2 2.x 450
3 a. Is the point 1, on the graph? 5 b. If x 0 , what is f ( x ) ? What point is on the graph of f ?c. If f ( x ) 1, what is x ? What point(s) are on the graph of f ?2d. What is the domain of f ?e. List the x-intercepts, if any, of the graph of f .f. List the y-intercepts, if any, of the graph of f .APPLICATIONCREATED BY SHANNON MYERS (FORMERLY GRACEY)51
If an object weighs m pounds at sea level, then its weight W, in pounds, at aheight of h miles above sea level is given approximately by 4000 W (h) m 4000 h 2a. If Amy weighs 120 pounds at sea level, how much will she weigh on Pike’sPeak, which is 14,110 feet above sea level?b. Use a graphing calculator to graph the function W W ( h ) .0.5 to see how the weight Wc. Create a TABLE with TblStart 0 and Tbl varies as h changes from 0 to 5 miles.d. At what height will Amy weigh 119.95 pounds?e. Does your answer to part d seem reasonable? Explain.2.3: PROPERTIES OF FUNCTIONSCREATED BY SHANNON MYERS (FORMERLY GRACEY)52
When you are done with your homework you should be able to π Determine Even and Odd functions from a Graphπ Identify Even and Odd functions from the Equationπ Use a Graph to Determine Where a Function is Increasing, Decreasing, orConstantπ Use a Graph to Locate Local Maxima and Local Minimaπ Use a Graph to Locate the Absolute Maximum and Absolute Minimumπ Use a Graphing Utility to Approximate Local Maxima and Local Minimaπ Find the Average Rate of Change of a Function x 2 3 for symmetry with respect to theWARM-UP: Test the equation y x-axis, y-axis, and the origin.EVEN FUNCTIONSA function f is if, for every number in its domain, thenumber is also in the domain andCREATED BY SHANNON MYERS (FORMERLY GRACEY)53
ODD FUNCTIONSA function f is if, for every number in its domain, thenumber is also in the domain andTHEOREMA function is if and only if its graph is symmetric with respect tothe . A function is if and only if its graphis symmetric with respect to the .Example 1: Determine whether each graph given below is the graph of an evenfunction, an odd function, or a function that is neither even nor odd.a.b.c.Example 2: Determine algebraically whether each function is even, odd, or neither.x ) 3x3 5a. h ( CREATED BY SHANNON MYERS (FORMERLY GRACEY)54
b. F ( x ) 2xxx ) 2x4 x2c. f ( INCREASING/DECREASING/CONSTANT INTERVALS OF A FUNCTIONA function f is on an open if, forany choice of and in I, with , we have .A function f is on an open if, forany choice of and in I, with , we have .A function f is on an open if, forall choices of in I, the values of are .CREATED BY SHANNON MYERS (FORMERLY GRACEY)55
**NOTE: We describe the behavior of a graph in terms of its !!!LOCAL EXTREMAA function f has a at if there is an openinterval I containing c so that for all x in I, . We calla of .A function f has a at if there is an openinterval I containing c so that for all x in I, . We calla of .**NOTE: The word is used to suggest that it is only near , thatis, in some open interval containing c, that the value of has theseproperties.**NOTE: The is the local maximum or minimum value and itoccurs at some .CREATED BY SHANNON MYERS (FORMERLY GRACEY)56
Example 3: Consider the graph of the function given below.a. On what interval(s) is f increasing?b. On what interval(s) is f decreasing?c. On what interval(s) is f constant?d. List the local minima.e. List the ordered pair(s) where a local minimum occurs.f. List the local maxima.g. List the ordered pair(s) where a local maximum occurs.CREATED BY SHANNON MYERS (FORMERLY GRACEY)57
ABSOLUTE EXTREMALet f denote a function defined on some interval I. If there is a number inI for which for all x in I, then is theof on and we say theof occurs at .If there is a number in I for which for all x in I, thenis the of on and wesay the of occurs at .Example 4: Find the absolute minimum and the absolute maximum, if they exist, ofthe following graphs below.a.The absolute minimum is .The absolute minimum occurs at .The absolute maximum is .The absolute maximum occurs at .CREATED BY SHANNON MYERS (FORMERLY GRACEY)58
b.The absolute minimum is .The absolute minimum occurs at .The absolute maximum is .
PRECALCULUS I: COLLEGE ALGEBRA GUIDED NOTEBOOK FOR USE WITH SULLIVAN AND SULLIVAN PRECALCULUS ENHANCED WITH GRAPHING UTILITIES, BY SHANNON MYERS (FORMERLY GRACEY) Section 1.1: THE DISTANCE AND MIDPOINT FORMULAS; GRAPHING UTILITIES; INTRODUCTION TO GRAPHING EQUATIONS . When you are done with your homework you should be able to π Use the Distance Formula π Use the Midpoint Formula π Graph .