Transcription
Why is my LMS so slow? A Case Study of D2L Performance IssuesSourish Roy and Carey WilliamsonDepartment of Computer Science, University of CalgaryCalgary, AB, Canada T2N 1N4(sourish.roy, cwill)@ucalgary.caAbstractThis paper presents a network traffic measurementstudy of Desire2Learn (D2L), which is the LearningManagement System (LMS) used by the University ofCalgary. Our study is motivated by anecdotal reports ofsluggish D2L performance, particularly for file uploads.Using active and passive network measurements, weidentify the root causes of the poor D2L performance.The main issues identified are: (1) excessive HTTPredirections in our university’s D2L setup; (2) nonnegligible network latency to the server hosting the D2Lcontent; and (3) suboptimal TCP configurations thatlimit end-to-end throughput. We discuss these issues,and identify potential solutions.keywords: Learning Management System (LMS), Network traffic measurement, User-perceived performance,Web-based systems, TCP, Throughput, Response time1IntroductionAlmost every university has a Learning ManagementSystem (LMS) as part of its IT infrastructure tosupport its educational mandate. LMS technologyaugments classroom learning with support for onlinelearning. The concept of e-learning has been aroundfor a long time, but it is only over the last decade thatthe deployment of Web-based LMS software has becomeubiquitous. Prior to this Internet migration, mostLMS solutions were typically closed systems withinindividual institutions.An LMS is essential for managing the learning activities for courses online. It provides instructors withtechniques to create and deliver content. It also allowsthem to check student participation and engagement inthe course curriculum, and assess student performanceon assignments, quizzes, and exams.One popular LMS is Brightspace by D2L(Desire2Learn), which we refer to as “D2L” inthis paper [7]. D2L was started by John Baker in 1999as a system to manage courses and student learning.The company is headquartered in Kitchener, Ontario,Canada, and has more than 800 employees in Canada,Australia, Brazil, Singapore, USA, and the UK.In 2014, the University of Calgary selected D2Las its new LMS, as a replacement for Blackboard.Every instructor and student now has access to D2Las our official LMS. Thus, thousands of on-campususers are using D2L each day to create/view coursecontent, record/watch lectures, and enter/view grades.These LMS activities generate a lot of network traffic,using thousands of TCP connections, from many IPaddresses, and multiple heterogeneous devices. Knowledge of the D2L traffic patterns can help us understandits impact on the learning environment at the University of Calgary. Thus a workload characterization studyof D2L LMS traffic is warranted [17].Anecdotal reports from faculty/staff at the Universityof Calgary indicate that D2L is “slow”. This problemhas existed since 2014, but has not yet been resolved.One possible reason for the sluggishness is that D2Lcontent is hosted remotely in Ontario, approximately3200 km from Calgary. Indeed, our network measurements confirm that this is an important contributingfactor. However, we also find other technical issueswith the D2L configuration that hamper user-perceivedperformance. For example, file uploads for contentproducers (i.e., faculty/staff) are much slower than filedownloads for content consumers (i.e., students).An analysis of D2L traffic can help identify thereasons for its slow performance. In computer networking, traffic measurement and analysis are crucialto the design, operation, and maintenance of localand wide-area networks. This area of research [11] isused extensively in both academia and industry. Bycollecting network traffic measurement data, we canassess the usage of a network, and develop improvedcommunication protocols for future networks.The rest of this paper is organized as follows. Section 2 provides some background on network trafficmeasurement, and prior research literature. Section 3describes the research methods used for our work.Section 4 presents the results from our study, focusing on HTTP redirection, network latency, and TCPthroughput. Section 5 concludes the paper.
2Background & Related WorkNetwork traffic measurement provides a means toanalyze network usage and understand network performance. Lots of prior research has characterizedInternet traffic from the early 1990’s [9] to the presentday [11] (e.g., Web traffic [3, 6, 13, 15], peer-to-peer filesharing [4], YouTube [10, 12], online social networks [5],Netflix [1, 14]). Network traffic measurement studiessuch as these are useful not only for workload characterization, but also for network troubleshooting, protocoldebugging, and performance evaluation.In 1996, Arlitt et al. [3] characterized Web serverworkloads by analyzing access logs. These logs recordrequests for Web site URLs, including time of request,client IP address, content accessed, and document size.They used 6 different data sets in their study: threefrom universities, two from research organizations,and one from a commercial Internet provider. Theyidentified common workload characteristics, such asZipf-like object popularities and heavy-tailed file sizedistributions. Based on their findings, they proposedimproved Web caching systems with frequency-basedcache management policies.In 2001, Almeida et al. [2] analyzed server log data foreducational media servers at two major US universities(University of Wisconsin, and University of California,Berkeley). Their paper focused on the eTeach systemand BIBS (Berkeley International Broadcasting System), which delivered high quality media content. Theirstudy provides a benchmark against which future mediaserver workloads can be compared.Newton et al. [15] conducted a long-term Web trafficmeasurement study to see how this traffic has changedover time. They used the TCP/IP packet headers(1999-2012) in packet traces collected on the Internetlink for the University of North Carolina. Theyperformed an in-depth analysis of HTTP request sizesand responses, identifying growth in the size andcomplexity of Web pages, and increased use of cookies.3MethodologyNetwork traffic measurement can be classified [11, 20]based on the location of the network monitor (e.g., edgeor core), the network analysis tools used (e.g., hardwareor software), and the data collection mechanism (e.g.,passive or active). In our work, we use a combinationof passive and active measurement approaches.In passive network measurements, data is gathered bypassively listening to network traffic, without generating any additional traffic. In our study, we use specialized hardware to collect information about all campus-level traffic on our edge network. The monitor recordsinformation about the inbound/outbound network traffic passing through the university’s edge routers. Thiscollection takes place through a mirrored stream ofall packet-level Internet traffic entering/leaving theUniversity of Calgary network.Our network monitor is a Dell server, which processesthe mirrored traffic stream. It is equipped with twoIntel Xeon E5-2690 CPUs (32 logical cores @2.9 GHz),64 GB RAM, and 5.5 TB of local hard disk storagefor the logs. The operating system (OS) on this serveris CentOS 6.6 x64. The monitor utilizes an EndaceDAG 8.1SX for capturing the traffic and filtering it. Itwas designed for 10 Gbps Ethernet, and uses severalprogrammable functions in the hardware to boost theperformance of packet processing. The primary use ofthe Endace DAG card is to split the incoming trafficinto streams for processing by the Bro logging system.Bro is an open-source framework for network analysisand security [8, 16]. In our work, the Bro loggingsystem monitors all packet-level network activities,and produces connection-level logs summarizing all thetraffic. Our primary interest is in the connection,HTTP, and SSL logs. The connection logs provide dataregarding each observed connection, such as start time,end time, bytes transferred (inbound/outbound data),duration, and termination state. The HTTP log helpsus identify the source/destination IPs, HTTP methods,hosts, URIs, referer URLs, and user agents. Finally,the SSL logs show us HTTPS connections, with fieldslike timestamps, TLS/SSL encryption methods, plussource/destination ports.Bro collects and generates logs on an hourly basis,which we aggregate together to provide a semester-longview of D2L traffic. We collect and analyze data fromthe HTTP, SSL, and connection logs to produce theresults reported in this paper.In addition to the Endace/Bro data collection described above, we also use Wireshark [21] to collectpacket-level details on several D2L test sessions fromour own desktop computers. Wireshark captures packets in real time, and displays them in a human-readableformat. Using Wireshark, we can explore the details ofD2L interactions for our own test sessions.Unlike passive approaches, active measurements generate extra packets on the network. These can beused to measure the time taken to reach a targetdestination, the capacity available for a network path,or the response time for an application. Since thiscategory of measurement generates additional traffic,we have performed active measurements judiciously,using basic active measurement tools like ping andtraceroute that have minimal impact on the network.
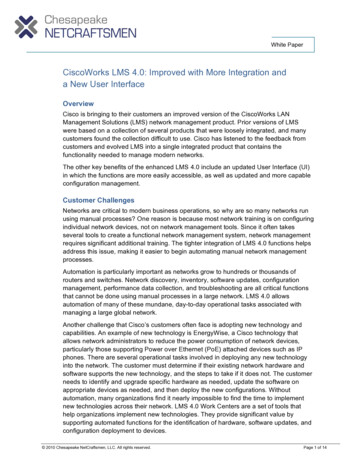
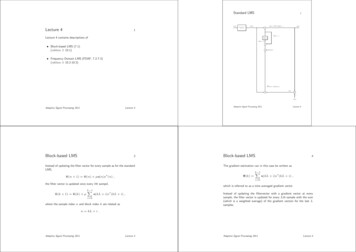
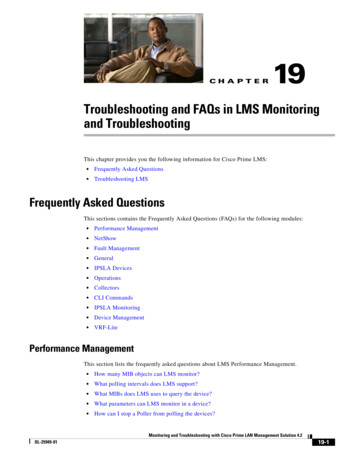
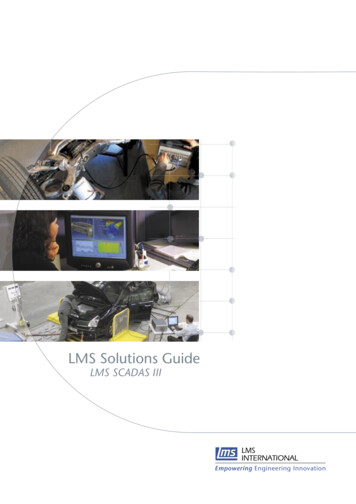
44.1Experimental ResultsD2L Traffic OverviewFigure 1 provides a high-level overview of the D2Ltraffic observed on our campus network during theWinter 2016 semester (January-April 2016). Notethat D2L traffic occurs over both HTTP (for initiation/termination of D2L sessions) and HTTPS (foractual D2L interactions), and that there is a strongcorrelation between the two types of traffic.(a) HTTP requests per day(b) HTTPS requests per dayFigure 1: D2L Traffic Profile for Winter 2016Our measurements allow us to quantify the trafficvolume, data volume, response time, and throughputfor all D2L users during the Winter 2016 semester.When lectures began on January 11, the D2L trafficincreased. The D2L traffic pattern varies throughoutthe semester, with a dip during Reading Week break inFebruary, and a sharp decline after final exams in April.The D2L traffic shows strong daily and weekly patterns, with weekday traffic far exceeding that on weekends. On a typical weekday, we observe about 16,000HTTP requests to D2L from the University of Calgary network, and about 500,000 HTTPS requeststo D2L. The 30-fold difference between HTTP andHTTPS indicates that most D2L interactions occurvia HTTPS. The HTTP traffic is primarily for sessioninitiation/termination.4.2HTTP Redirection IssueThe first D2L performance issue that we have identified is related to how D2L is configured to operatewithin the University of Calgary IT infrastructure. Inparticular, session initiation involves user authentication. This step actually involves several HTTP redirections to the Central Authentication Service (CAS) atthe University of Calgary. These interactions are complex, and add noticable latency to the D2L experience.Figure 2 shows a schematic illustration of a minimalD2L test session that we conducted, in which wesimply login/logout as quickly as we can. This wholeprocess takes about 6 seconds, and involves severalsteps. First, the initial attempt to contact D2L viaHTTP is redirected to use HTTPS instead. Second,the request is redirected from D2L to CAS at theUniversity of Calgary for user authentication. Third,the Web browser uses multiple TCP connections inparallel to load the CAS login page (i.e., CSS file, logo,background, Javascript). Fourth, once the user logsin successfully, another HTTPS redirection occurs tore-connect with D2L. The Web browser then launchesmultiple TCP connections to retrieve the differentcomponents of the D2L landing page, including colourtemplate, university logo, menu buttons, and coursehome page. The user is now ready to begin their D2Lsession. At this point, however, we simply logout.During logout, another series of HTTP redirectionsoccur. The first of these is from D2L to an e-learningserver hosted by the Taylor Institute for Teaching andLearning (TITL) at the University of Calgary. Next,the Web browser uses parallel TCP connections to loadthe different components of the session logout page.Finally, there is a superfluous HTTP redirection fromthe TITL server to itself, to change the URL from“logout” to “logout/”.4.3Network Latency IssueThe second D2L performance problem relates to howfar away the D2L server is from the University ofCalgary. In particular, the network round-trip-time(RTT) is about 40 ms, which is non-negligible.Figure 3 shows how an on-campus user accesses D2L.In this figure, the campus network is enclosed withina triangle, while the D2L hosted service in Ontario isindicated by the oval on the right. We are interested incharacterizing the Internet path between the two.Figure 4 shows the traceroute results, whichindicate that the D2L hosted service )is located at a data center in Toronto. The networkpath has 17 hops with a total RTT of 37 ms.
A recurring theme in our study is the adverse impactof network latency on user-perceived performance inD2L. The performance of D2L is affected by these highRTT values. Users spend time waiting for responsesfrom a distant data center in Toronto. This hindersthe responsiveness of the D2L Web site, particularlywhen multiple HTTP/HTTPS redirections occur. Furthermore, the network bandwidth is not well utilizedduring TCP slow start, and D2L performance suffers.4.4Figure 2: Example of Minimal D2L SessionTCP Throughput IssueThroughput is an important factor that affects network application performance. Using our empiricalmeasurement data, we calculated the Average DataRate (ADR) for D2L data transfers, which is the size ofa transferred file divided by theeelapsed time duration.This metric indicates the average throughput for D2Lconnections, in bits per second (bps).Figure 5 shows a Log-Log Complementary Distribution (LLCD) plot of the ADR from some of ourempirical data. The average ADR is 500 Kbps, withsome data points up to 5 Mbps for inbound connections.A much lower ADR is seen for outbound connections,with the average being 50 Kbps, and a maximum ADRof around 350 Kbps. Note that these throughput valuesrepresent only the average, and not the instantaneousthroughput. Specifically, they are calculated fromthe byte counts and the durations reported in theconnection logs, and the duration includes all the TCPconnection handshaking, slow start effects, and anytimeouts used for persistent connections.Figure 3: Network Path for D2L Users on Campus traceroute d2l.ucalgary.catraceroute to d2l.ucalgary.ca (199.30.181.42), 30 hops max, 60 byte packets1 deptNFSgate (172.17.10.1) 0.233 ms 0.217 ms 0.302 ms2 * * *3 10.58.48.1 (10.58.48.1) 0.367 ms 0.370 ms 0.363 ms4 * * *5 10.16.18.1 (10.16.18.1) 0.433 ms 0.404 ms 0.401 ms6 10.16.18.4 (10.16.18.4) 0.302 ms 0.246 ms 0.237 ms7 10.16.17.1 (10.16.17.1) 0.438 ms 0.403 ms 0.432 ms8 10.59.226.26 (10.59.226.26) 0.334 ms 0.324 ms 0.333 ms9 h74.gpvpn.ucalgary.ca (136.159.199.74) 3.296 ms 3.333 ms 3.471 ms10 h66-244-233-17.bigpipeinc.com (66.244.233.17) 0.744 ms 0.633 ms 0.624 ms11 h208-118-103-166.bigpipeinc.com (208.118.103.166) 0.880 ms 0.869 ms 0.836 ms12 clgr2rtr2.canarie.ca (199.212.24.66) 0.721 ms 0.755 ms 0.726 ms13 wnpg1rtr2.canarie.ca (205.189.33.199) 36.400 ms 36.180 ms 36.307 ms14 canariecds.ip4.torontointernetxchange.net (206.108.34.170) 36.543 ms 36.514 ms 36.368 ms15 desire2learn.ip4.torontointernetxchange.net (206.108.34.184) 36.668 ms 36.511 ms 36.484 ms16 * * *17 ucalgary.desire2learn.com (199.30.181.42) 36.727 ms 36.810 ms 36.770 msFigure 4: Traceroute Results for d2l.ucalgary.caFigure 5: LLCD Plot of D2L ThroughputThere are two intriguing observations in Figure 5.First, the throughput values are very low (i.e., muchlower than expected on CANARIE’s fast national network). Second, the average throughput differs foruploads and downloads, almost by a factor of two.
To further investigate this issue, we conducted someD2L test sessions involving uploads and downloads for asingle 3.2 MB data file. Table 1 summarizes the resultsof our experiment, which confirms the asymmetricperformance for uploads and downloads. The highestthroughput achieved for downloads was 14 Mbps, whilethat for uploads was 7 Mbps. These results wereconsistent across all test scenarios considered.Table 1: TCP Throughput for D2L Transfers (3.2 MB)ScenarioDeviceOSDownloadUploadOn campus, wiredOn campus, wirelessOff campus, wirelessDesktopLaptopLaptopWindows 8Mac OS XMac OS X14 Mbps14 Mbps14 Mbps7 Mbps7 Mbps7 MbpsWe used Wireshark and some active measurementsto learn more about the TCP version and settingsused by D2L data transfers.Wireshark providesinformation such as TCP options, maximum segmentsize (MSS), slow start, window size, sequence numberanalysis, and others. OS fingerprinting allows usto infer the operating system (Windows 2008 R2)and TCP version (Compound TCP [18, 19]) used bythe D2L server, which is running Microsoft’s InternetInformation Server (IIS version 7.5).Figure 6 illustrates the TCP receiver window sizeadvertised by the D2L server during a file upload. Thefirst observation is that the maximum advertised window size is 64 KB, which is the default socket buffer sizefor Compound TCP. This is a very small window size touse on networks with a large delay-bandwidth product,such as our scenario. The second observation is thatthe advertised window size fluctuates a lot, indicatingthat the server is slow in processing the arriving datapackets. There are a half-dozen occurrences of smallwindows where the data transfer is inhibited. There iseven a window stall event between 11 and 12 seconds,where the receiver window is almost zero (395 bytes,too small for the uploader to send another MSS).Figure 6: TCP Receive Window for D2L File UploadThese results demonstrate that the D2L data transferperformance is window-limited. Even if data transferswere perfect, with 64 KB of data exchanged every 40ms, the maximum throughput would be 14 Mbps, whichis what we observed in our download experiments. Alarger window size of approximately 1 MB would berequired to better exploit the network path betweenCalgary and Toronto.Understanding why upload performance (7 Mbps)is worse than downloads (14 Mbps) requires evenfurther investigation.To obtain insight into thisproblem, we conducted our own active measurementexperiment on a D2L test session using special softwarecalled mitmproxy, which acts as a man-in-the-middle(mitm) proxy. This software intercepts the trafficbetween a client and a server, and can report all theHTTP/HTTPS traffic requests made by the user.With mitmproxy in place, we can view the details of our D2L test sessions, including HTTP requests/responses, file names/sizes, and response times.These experiments showed that downloads use theGET method, while uploads use the POST method.However, the file uploads involve many POST requests,each with a small transfer size. Furthermore, D2Linternally updates a file directory structure on uploads,as indicated by UpdateTreeBrowser in one of its URLs.In addition, there is an activity feed popup right afterthe new content is uploaded into D2L, as a notificationfor the user. These activities all increase the delay forD2L file uploads.5ConclusionsIn this paper, we presented an empirical measurementstudy of the Desire2Learn (D2L) Learning ManagementSystem (LMS) adopted for use at the University ofCalgary. The motivation for our study was to gain abetter understanding of the system configuration, andits performance limitations.While studying an LMS such as D2L is complex, thereare three main technical issues that emerge from ourstudy as root causes for the poor performance of D2L.The first issue is the excessive use of HTTP redirectionat the University of Calgary to manage login/logoutfor D2L sessions. The second issue is the networkRTT latency for D2L users in Calgary to access coursecontent that is remotely hosted in Ontario. Finally, theTCP configuration on the D2L server is suboptimal,and limits data transfer throughput.The main conclusion from our study is that D2L isslow, and unnecessarily so. Fortunately, the observedperformance problems are all fixable, as follows. First,we observed over one million HTTP redirects duringthe Winter 2016 term, which could be eliminated tominimize network round-trips and reduce server load.
Second, there is a 40 ms RTT latency for University ofCalgary users to access D2L content. Using a contentdelivery network (CDN), or placing a CDN node locallyon campus, could greatly accelerate content delivery.Finally, the TCP window size used by D2L is small,and does not scale dynamically based on the observedcharacteristics of the network path. An expandedTCP socket buffer size (i.e., maximum receive window)would solve this problem, improving throughput forboth uploads and downloads. We hope that the insightsfrom our study will improve future D2L deployments,both at our university and elsewhere.AcknowledgementsFinancial support for this research was provided byNSERC. The authors thank D’Arcy Norman at TITLfor his detailed knowledge of D2L, and the reviewers fortheir feedback and suggestions on the paper.References[1] V. Adhikari, Y. Guo, F. Hao, V. Hilt, Z-L. Zhang,M. Varvello, and M. Steiner, “Measurement Studyof Netflix, Hulu, and a Tale of Three CDNs”,IEEE/ACM Transactions on Networking, Vol. 23,No. 6, pp. 1984-1997, December 2015.[2] J. Almeida, J. Krueger, D. Eager, and M. Vernon,“Analysis of Educational Media Server Workloads”, Proceedings of ACM NOSSDAV, PortJefferson, NY, January 2001.[3] M. Arlitt and C. Williamson, “Internet WebServers: Workload Characterization and Performance Implications”, IEEE/ACM Trans. onNetworking, Vol. 5, No. 5, pp. 631-645, Oct. 1997.[4] N. Basher,A. Mahanti,A. Mahanti,C. Williamson, and M. Arlitt, “A ComparativeAnalysis of Web and Peer-fo-Peer Traffic”,Proceedings of WWW, pp. 287-296, Beijing,China, April 2008.[5] F. Benevenuto, T. Rodrigues, M. Cha, andV. Almeida, “Characterizing User Behavior inOnline Social Networks”, Proceedings of ACMIMC, pp. 49-62, Chicago, IL, November 2009.[6] L. Breslau, P. Cao, L. Fan, G. Phillips, andS. Shenker, “Web Caching and Zipf-like Distributions: Evidence and Implications”, Proceedings ofIEEE INFOCOM, pp. 126-134, New York, NY,March 1999.[7] Brightspace By D2L, The Brightspace CloudContent Delivery Network. https://community.brightspace.com/resources (Aug 2017)[8] Bro, The Bro Network Security Monitor, https://www.bro.org (Jan 2018)[9] R. Caceres, P. Danzig, S. Jamin, and D. Mitzel,“Characteristics of Wide-area TCP/IP Conversations”, Proceedings of ACM SIGCOMM, pp. 101112, Zurich, Switzerland, August 1991.[10] M. Cha, H. Kwak, P. Rodriguez, Y. Ahn, andS. Moon, “I Tube, You Tube, Everybody Tubes:Analyzing the World’s Largest User-GeneratedContent Video System”, Proceedings of ACM IMC,pp. 1-14, San Diego, CA, November 2007.[11] M. Crovella and B. Krishnamurthy, Internet Measurement: Infrastructure, Traffic and Applications,John Wiley & Sons, 2006.[12] P. Gill, M. Arlitt, Z. Li, and A. Mahanti,“YouTube Traffic: A View from the Edge”,Proceedings of ACM IMC, pp. 15-28, San Diego,CA, November 2007.[13] F. Hernandez-Campos, K. Jeffay, and F. Smith,“Tracking the Evolution of Web Traffic: 19952003”, Proceedings of IEEE MASCOTS, pp. 16-25,Orlando, FL, October 2003.[14] M. Laterman, M. Arlitt, and C. Williamson,“A Campus-Level View of Netflix and Twitch:Characterization and Performance Implications”,Proceedings of SCS SPECTS, pp. 15-28, Seattle,WA, July 2017.[15] B. Newton, K. Jeffay, and J. Aikat, “TheContinued Evolution of Web Traffic”, Proceedingsof IEEE MASCOTS, pp. 80-89, San Francisco, CA,August 2013.[16] V. Paxson, “Bro: A System for Detecting NetworkIntruders in Real-time”, Computer Networks,Vol. 31, No. 23, pp. 2435-2463, December 1999.[17] S. Roy, Characterizing D2L Usage at the U of C,MSc Thesis, University of Calgary, August 2017.[18] K. Tan and J. Song, “Compound TCP: A Scalableand TCP-friendly Congestion Control for Highspeed Networks”, Proceedings of 4th Internationalworkshop on Protocols for Fast Long-DistanceNetworks, Nara, Japan, February 2006.[19] K. Tan, J. Song, Q. Zhang, and M. Sridharan,“A Compound TCP Approach for High-Speed andLong-Distance Networks”, Proceedings of IEEEINFOCOM, Barcelona, Spain, April 2009.[20] C. Williamson, “Internet Traffic Measurement”,IEEE Internet Computing, Vol. 5, No. 6, pp. 70-74,November/December 2001.[21] Wireshark. www.wireshark.org (Jan 2018)
In 2014, the University of Calgary selected D2L as its new LMS, as a replacement for Blackboard. Every instructor and student now has access to D2L as our o cial LMS. Thus, thousands of on-campus users are using D2L each day to create/view course content, record/watch lectures, and enter/view grades. These LMS activities generate a lot of .