Transcription
October 2016Central Council for Financial Services Information(Secretariat: Public Relations Department, Bank of Japan)Financial Literacy Survey: 2016 Results*IntroductionThe Financial Literacy Survey 2016 is Japan's first large-scale questionnaire surveyconducted with the aim of understanding the current state of financial literacy, i.e., financialknowledge and financial decision-making skills, of individuals aged 18 and over.ContentsI. Overview3II. Summary of the Results5III. Survey Results8A. Current State of Financial Literacy8B. Comparison with Overseas Surveys16C. Analysis by Segment18D. Needs for Financial Education, Its Implementation Status, and Its Effects20E. Behavioral Economic Analysis22F. Analysis by Prefecture23IV. Future Challenges25Box 1 Financial Literacy Quiz: A Learning Tool Based on the Survey Results27Box 2 Financial Literacy and Investment Behavior30V. Survey Outline33VI. Questionnaire (Simple Tabulation of Data)37Statistics tables (see next page for the contents)OutlinePeriodSample sizeMethodology: From February 29 to March 17, 2016: 25,000 individuals aged 18 to 79 throughout Japan: Online surveyInquiries: Secretariat of the Central Council for Financial Services InformationMr. Noriaki Kawamura (e-mail: noriaki.kawamura@boj.or.jp)* This is an English translation of the Japanese original released on June 17, 2016. Figures for the UnitedStates are from "Financial Capability in the United States 2016" released by the U.S. Financial IndustryRegulatory Authority (FINRA) Investor Education Foundation in July 2016.1
Contents of Statistics TablesFinancial knowledge and financial decision-making skillsAnalysis by prefecture1. Correct answers given to true/false questions37. Hokkaido2. Matrix analysis of the percentage of correct answers38. Aomori62. Kyoto39. Iwate63. Osaka40. Miyagi64. Hyogo41. Akita65. Nara42. Yamagata66. Wakayama43. Fukushima67. Tottori44. Ibaraki68. Shimane45. Tochigi69. Okayama46. Gunma70. Hiroshima47. Saitama71. Yamaguchigiven to true/false questions3. Analysis of the percentage of correct answers given totrue/false questions by attribute4. Comparison of self-assessment and objectiveassessment of financial knowledge5. Distribution of the percentage of correct answers givento true/false questions6. Analysis by level of financial knowledge61. Shiga48. Chiba72. Tokushima7. The U.S. survey49. Tokyo73. Kagawa8. The OECD survey50. Kanagawa74. Ehime51. Niigata75. Kochi52. Toyama76. FukuokaComparison with overseas surveysNeeds for and experience of financial education9. Needs for and experience of financial education53. Ishikawa77. Saga10. Those who have financial education54. Fukui78. Nagasaki11. Those who have not financial education55. Yamanashi79. Kumamoto12. Students who have financial education56. Nagano80. Oita13. Students who have not financial education57. Gifu81. Miyazaki58. Shizuoka82. Kagoshima59. Aichi83. Okinawa60. Mie84. Prefectural comparisonAnalysis by segment14. Students15. Young adults16. AdultsInvestment behavior17. Senior citizens85. Those who invested in all three products(stocks, investment trusts, and foreign currency deposits, etc.)18. Company employees19. Government employees86. Those who did not invest in any of the three products(stocks, investment trusts, and foreign currency deposits, etc.)20. Self-employed21. Part-timers22. Full-time homemakersComparison with the 2011 Financial Literacy Survey23. Those who experienced financial trouble87. Comparison of questions24. The high-literacy group88. Comparison of attributes25. The low-literacy group26. Those who have mortgagesList of survey data27. Those who have consumer loans89. By gender/age group28. Those who have life insurance policies90. By prefecture29. Those who never acquire financial and economic information30. Those with high annual incomeReference 1.31. Males/femalesCalculation methodology of the percentage of correct32. List of analysis results by segmentanswers by categoryReference 2.Calculation methodology of survey dataBehavioral economic analysis33. Behavioral economic analysisReference 3.34. Those with strong loss aversion who do not investCitation of survey data35. Those with a strong myopic behavioral biasReference 4.36. Those with a strong herd behavioral biasMethod of use of individual dataNote: The tables are available in Japanese, except for "49. Tokyo," which is shown on page 24.2
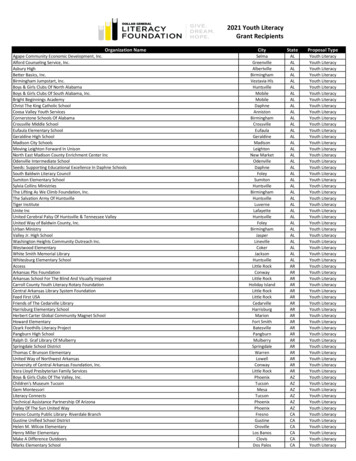
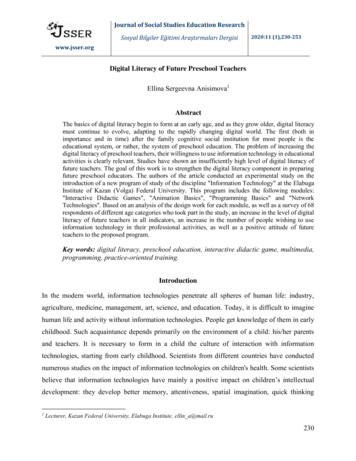
I. OverviewPurposes The Financial Literacy Survey is a questionnaire survey conducted with the aim ofunderstanding the current state of financial literacy, i.e., financial knowledge andfinancial decision-making skills, of individuals aged 18 and over in Japan. The Central Council for Financial Services Information conducted the first survey in2011, and for this second 2016 round, the Council made a sweeping review of thecontents and methodology, reflecting changes in the situation surrounding financialeducation, such as the release of the Financial Literacy Map* in 2014, which wascompiled based on a report of the Study Group on Financial Education (Secretariat:Financial Services Agency in Japan). As a result, the 2016 survey is Japan's first large-scale survey in this area, covering allcategories of the Financial Literacy Map.* The "Standard Learning Goals for Different Age Groups" from the "Minimum Level of FinancialLiteracy That Should Be Attained" prepared by the Committee for the Promotion of FinancialEducation (Secretariat: Central Council for Financial Services Information. See next page fordetails).Methodology An online survey was conducted on 25,000 individuals aged 18 to 79 who have beenchosen in proportion to Japan's demographic structure. The previous (2011) survey was conducted by extracting samples aged 18 and over from500 locations nationwide and obtaining responses through face-to-face interviews,postal mail, or the Internet. The sample size was 3,531.Characteristics of questions The questions were a combination of true/false questions on "financial knowledge andfinancial decision-making skills" and questions on "characteristics of behavior andattitude" relating to the eight categories of the Financial Literacy Map. About half of thequestions were made similar to those in surveys conducted by the U.S. FinancialIndustry Regulatory Authority (FINRA) Investor Education Foundation and theOrganisation for Economic Co-operation and Development (OECD) so that the resultscould be compared.Figure 1 Composition of the survey questionsNumberofquestionsFamily budget managementLife planningBasics of financialFinancialtransactionsLiteracyBasics of financeFinancialMapand h buildingUse of outside expertiseNeeds for and experience ofOtherparticipating in financial educationTotalFinancialknowledge andInternationally financial decision- Internationallycomparablecomparablemaking 0033532626102716Questions cover all categories of theFinancial Literacy Map, which serves as astandard for financial literacy in Japan.3About half of the questions arecomparable to those of overseassurveys.
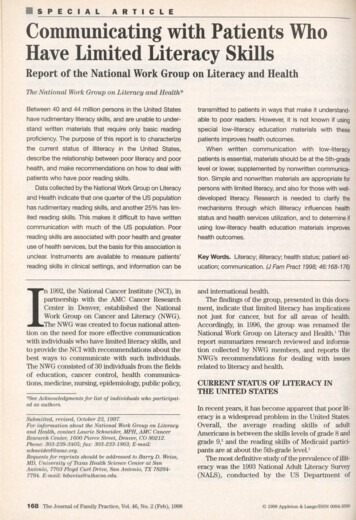
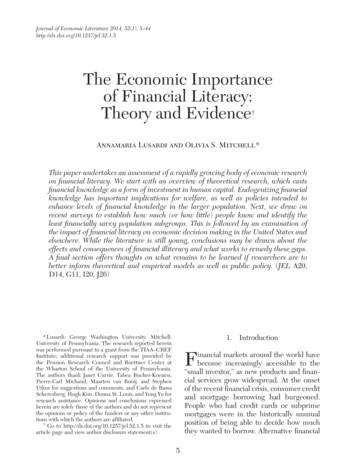
Figure 2 "Minimum Level of Financial Literacy That Should Be Attained" from the reportreleased by the Study Group on Financial Education[ In su ran c e produ c ts ]Item 8 Understanding which contingencies (death, illness, fire,etc.) one should seek insurance coverage forItem 9 Understanding the amount of economic security requiredshould a covered contingency occur1. Family budget managementItem 1Making a habit of proper income/expenditure management(eliminating debts and staying in the black)[ Loan s/ c re dit ]Item 10 Understanding basic precautions when arranging a homeloan(1) Importance of setting a reasonable loan limit and puttingtogether a repayment plan(2) Importance of preparing for the possibility ofcircumstances that could make repayment difficultItem 11 Making a habit of avoiding thoughtless/reckless use of creditcards and credit card loans/personal loans using cards issuedby banks, etc., termed “card loans” in Japan2. Life planningItem 2Articulating life plans and understanding the need to securethe funds required for life plans3. Financial knowledge, understanding offinancial/economic circumstances, andappropriate selection/use of financial products[ We alth bu ildin g produ c ts ]Item 12 Understanding that seeking higher returns will entailassuming higher risks, although risk tolerance varies fromperson to personItem 13 Understanding the effectiveness of diversification inwealth building (diversifying investment assets andinvestment start times)Item 14 Understanding the effectiveness of long-terminvestments in building wealth[ Kn owle dge of th e basic s of fin an c ial tran sac tion s ]Item 3 Making a habit of assuming a fundamentally careful attitudetoward contractsItem 4 Making a habit of confirming the reliability of informationsources and contract counterpartiesItem 5 Understanding that Internet transactions are convenient butrequire some precautions different from face-to-facetransactions[ Common to all c ate gorie s of fin an c e ]Item 6 Understanding the key concepts constituting the foundations offinancial education (interest [simple interest and compoundinterest], inflation, deflation, exchange rates, risk-return, etc.), andthe selection/use of financial products suited to financial andeconomic circumstancesItem 7 Understanding the importance of ascertaining the actualcost (price) of a transaction4. Appropriate use of outside expertiseItem 15 Understanding the importance of appropriately employingoutside expertise when selecting/using financial productsFigure 3 Summary extract of the Financial Literacy MapCategoryFamily budgetmanagementLife planningUniversity studentsEstablishing the ability ity of income andexpenditure managementand being able to spendmoney according to a planin order to improve one'sskills, while improving thebalance of payments byearning more from apart-time job as needed.Envisioning one's dreamsand hopes in detail so thatone can achieve them whileengaging in an occupationaftergraduation,andworking hard in study andtraining toward realizingthose dreams and hopes.Having an image of one'sreal life, while bearing inmind the funds for the threebiggest events in life.Young adultsStartingtoliveindependently in termsof lifestyle and financialaspects.Being able to spendmoney on one's hobbyor improving one's skillsaccording to a plan,whileproperlymanaging income andexpenditure to supportone's household income.AdultsLiving independently andassumingfull-fledgedresponsibility as workingpeople.Being able to understandincome and expenditure aswell as assets and liabilitiesof one's household bykeepingahouseholdaccount book as thebreadwinnerofthehousehold, and improve thebalance as necessary.Senior citizensCoveringlivingexpensesmainly with pension incomeand money obtained by cashingout financial assets.Being able to manage incomeand expenditure and takenecessaryactionforimprovement according to apost-retirement plan.Working on a life planso that one can achieveone's dreams and hopeswhile engaging in theoccupation one haschosen.Being able to estimatehow much money onewould need to achieveone's life plan, and tosave money and manageassets according to aplan.Reconsidering one's lifeplan, financial plan, andassets to hold whennecessity arises in light ofthe changes in one'scircumstances, and makingconstant efforts to achieveone's life plan in view ofone's life in old age.Engaginginfinancialeducation for children athome in cooperation withschool.Reviewingone'spost-retirement life plan whiletaking into consideration theeffective use of leisure time andcontribution to one's family andsociety.Changing one's lifestyle to oneaffordable with a pension andmaking steady efforts so thatone can live a spiritually richand stable life. Note: For details on the Financial Literacy Map, see the website of the Central Council for FinancialServices Information (https://www.shiruporuto.jp/e/).4
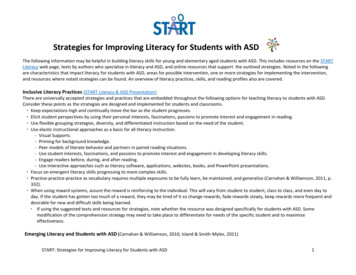
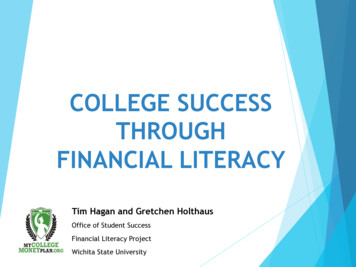
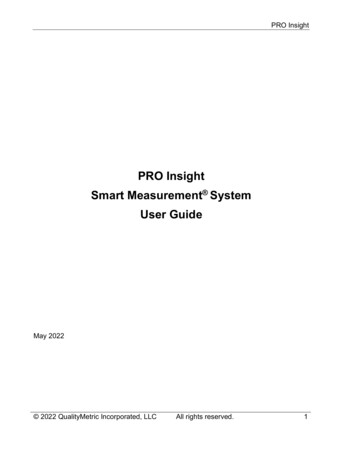
Some questions on "characteristics of behavior and attitude" include viewpoints ofbehavioral economics such as "loss aversion" and "herd behavior." Attributes of survey samples include gender, age, place of residence, occupation, annualincome, as well as their experience of participating in financial education. In sum, this survey has enabled analysis of data from various perspectives, namely, age,region, the experience of participating in financial education, and the degree of lossaversion.Figure 4 Analysis of 25,000 sample dataSample sizeAnalysis from various perspectivesAnalysis by category/level of financialknowledge, effects of financial education,behavioral economic analysis, analysis byprefecture and other aspects25,000 sample data in proportion toJapan's demographic structureII. Summary of the ResultsCharacteristics concerning financial literacy The percentage of correct answers given to true/false questions was55.6%. By category, the percentage was the highest for "basics offinancial transactions" at 72.9% and lowest for "basics of finance andeconomy" at 48.8%.Financialknowledge andfinancialdecision-making The percentage of correct answers given to true/false questions was theskillslowest for the 18–29 age group and became higher as the age rose(slightly declining for those in their 70s).Figure 5 Correct answers given by category of the Figure 6 Correct answers given to true/falseFinancial Literacy Mapquestions by age group(25 questions including Q4*)CategoryCorrectanswers (%)Family budget management51.0Life planning50.4Basics of financial transactions72.9Basics of finance and Wealth building52.553.354.3Use of outside 70s42.9403020100Age 18–29 30s40s* "Q number" indicates the question number.For the contents of the questions, see "VI. Questionnaire (Simple Tabulation of Data)."560.750s
As much as 70% of the respondents answered that, before they boughtCharacteristicssomething, they carefully considered whether they could afford it.of behavior Only about 20–30% of the respondents answered that they had purchasedand attituderisk assets such as stocks or investment trusts.Figure 7 Percentage of those who, beforebuying something, carefullyconsidered whether they couldafford it (Q1-1)Agree133.8Analysis bylevel offinancialknowledgeFigure 8 Experience of purchasing risk sdeposits, etc.Disagree2336.722.0455.3(%) I have purchased themI have never purchased2.3 them31.625.817.368.474.282.7 Groups for which the percentage of correct answers given to true/falsequestions was relatively high showed the following characteristics: (1)acquiring financial and economic information frequently; (2) securelymanaging family budget; (3) choosing financial products afterunderstanding the product details; and (4) having less tendency for lossaversion and herd behavior.Figure 9 Analysis by level of financial knowledge(%)AllsamplesThose who acquired financial and economic information at least once a week (Q48)Those who paid their bills on time (Q1-2)Those who purchased investment trusts after understanding the product details (Q34)Those with strong loss aversion (Q6)Those with a strong herd behavioral bias (Q1-3)* Those ranking in the top 20% in terms of the percentage of correct 94.281.764.99.2Comparison with overseas surveys Compared with the United States, the percentage of correct answers given to commontrue/false questions was 7% lower in Japan. Compared with Germany and the United Kingdom, the percentage of correct answersgiven to common true/false questions was 7–9% lower in Japan. Also, the percentage ofthose with desirable behavior such as, before buying something, carefully consideringwhether they could afford it, was 7–17% lower in Japan.Note: When comparing with overseas, some leeway should be allowed since there are differences infinancial products and services, tax systems, educational systems, etc.Figure 10 Comparison with the United States(correct answers; Q19 and others)Figure 11 Comparison with Germany and theUnited Kingdom (Q18 and others)(%)Japan (A) U.S. (B) Gap K.586765658272708277455743JapanKnowledge titude6
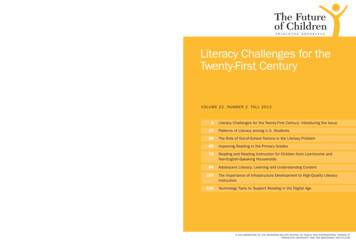
Gap between needs for financial education and the actual situation and effects offinancial education While many respondents indicated that financial education should be offered, only alimited number of them had actually participated in such education. The percentage of correct answers given by students who had participated in financialeducation (56.4%) was higher than that of correct answers given by students who had notparticipated in such education (38.2%), and was also higher than the average for all agegroups (55.6%).Figure 12 Gap between needs for financial education and the actual situation (Q39 and 41)Those whoThose whoanswered thatfinancial education had financialshould be offered educationDon't know24.7FinancialeducationNot neededNumber ofrespondents(%)should s who had actually participated in financialeducation accounted for only 8.3% of those who answeredthat financial education should be offered.Future challenges In order to respond to needs for financial education, it is necessary to promote financialeducation more extensively, bearing in mind the priority issues for each age group.Those who exhibited desirable financial behavior (%),average of all samples: 57.1%Figure 13 Correct answers and behavior of each segment (Q24 and others)Those who participated infinancial education65.060.0For students and young adults, both thepercentage of correct answers and theproportion of those who exhibited desirablefinancial behavior* were lower.Adults(age 30–59)55.0Youngadults(age 18–29)50.0Average forall samples* Proportion of those who made comparisonswith other financial institutions or productswhen investing funds, taking out a loan, orpurchasing a life insurance policy.Senior citizens(age 60–79)On the other hand, for respondents whoparticipated in financial education, both thepercentage of correct answers and theproportion of those who exhibited desirablefinancial behavior were higher.Students(age t answers given to true/false questions (%),average of all samples: 55.6%Figure 14 Preparation for retirement by those in their 50s(Q8, 9, 10, and 27)Aware of the required amountFunds forHad a financial planretirementHad set aside fundsPension Aware of the receivable king at how respondents in their50s were preparing for theirretirement, about 50% of them werenot aware of the amount that wouldbe required as living expenses forretirement, and about 60% did nothave a financial plan for suchexpenses. Also, about 60% of themwere not aware of how much publicpension they would receive.
III. Survey ResultsA. Current State of Financial Literacy1. Analysis by Financial Literacy Map categoryFamily budget managementAround 70–90% of the respondents managed their monthly income and expenditureappropriately and kept payment due dates. Also, before buying something, they carefullyconsidered whether they could afford to buy it.More than half of the respondents had set aside emergency or rainy day funds in caseof sickness, job loss, etc.― However, the level of understanding was not high regarding credit cardtransactions.Figure 15 Awareness of monthly household incomeand expenditure (Q3)Figure 16 Setting aside of emergencyor rainy day funds (Q11)(%)All samplesCompany employeesFull-time Don'tknow15.4HavesetasideHavenot setaside54.929.7Figure 17 Questions on characteristics of behavior (Q1)Agree1Before I buy something I carefullyconsider whether I can afford itI pay my bills on timeI keep a close personal watch on myfinancial affairsI have too much debt right 71.522.534.930.48.83.34.47.014.813.360.6Note: Shaded cells indicate desirable financial behavior.Figure 18 Correct answers given to true/false questions on family budget managementQ4Q5ContentAppropriate income and expenditure managementAppropriate income and expenditure managementand credit card useCorrect answers (%)55.146.9Slightly less than half of the respondents understood that a creditcard fee (interest) is charged for installment payments.8
Life planningThe proportion of respondents who thought that they should set long-term financialgoals and avoid living for today was larger than those who thought otherwise.Slightly less than 50% of the respondents knew the so-called three major expenses inlife, namely, living expenses for retirement, children's educational expenses, and costsof buying a house.Regarding these major expenses, 50–60% of the respondents were aware of therequired amount, 40–50% had a financial plan, and 20–30% had set aside funds.Figure 19 Questions on characteristics of behavior and attitude (Q1)Agree12Disagree345(%)I set long-term financial goals and striveto achieve them17.629.936.011.05.6I tend to live for today and let tomorrowtake care of itself3.913.228.325.628.9Note: Shaded cells indicate desirable financial behavior.Figure 20 Correct answers given to true/false questions on life planningQ12Q13ContentUnderstanding of the compound interest and theaccumulation period related to cumulativedepositsUnderstanding of three major expenses in lifeFigure 21 Recognition of three majorexpenses in life* (Q13)* Living expenses for retirement,children's educational expenses, andcosts of buying a house.Correct answers (%)53.247.6Figure 22 Proportions of respondentsregarding three major expensesin terms of the required amount,a financial plan, and settingaside of funds (Q8, 9, and 10)Those who wereaware of therequired amountThose who had afinancial planThose who hadset aside funds9(%)LivingChildren's Costs ofexpenseseducational buying 226.032.815.5
Financial knowledge, understanding of financial/economic circumstances, andappropriate selection/use of financial productsRespondents with correct answers on the basics of financial transactions were about70% of the total, but those on the basics of finance and economy, insurance, loans andcredit, and wealth building were about 50%.― About 50–60% of the respondents made comparisons with other financialinstitutions or products when taking out a loan, purchasing a life insurance policy,or investing funds.― About 40% of the respondents knew the amounts they were qualified to receive, thecategory of insured person they fell into, and the required number of years ofpaying contributions in order to qualify for pension benefits with regard to theirpensions.― About 20–30% of the respondents had the experience of purchasing stocks,investment trusts, foreign currency deposits, etc., out of which about 20–30% hadpurchased the products without understanding the product details.Figure 23 Correct answers on financialknowledgeNumber ofquestionsFinancial knowledgeFigure 24 Comparison with otherproducts (Q24, 29, and orrectanswers (%)1855.1 LoansBasics of financial transactions*372.9 Life insuranceBasics of finance and economy648.8 InvestmentInsurance352.5Loans/credit353.3Wealth building354.3* Basic attitude concerning contracts, appropriate behavior to avoid being involved infinancial trouble, and the method to avoid trouble related to Internet transactions.Figure 25 Understanding of one's own pension (Q27)I don't knowI knowReceivable amount36.6%Category of insured person63.4%41.9%58.1%Required number of years of payment44.6%55.4%Age of starting to receive the pension45.2%54.8%Category of public pension63.5%0%20%Figure 26 Purchasing of risk assets its, etc.I have purchased them31.625.817.3I have never purchasedthem68.474.282.740%36.5%60%80%100%Figure 27 Understanding of the productdetails upon purchase (Q34)I have purchased themI did not understand the productdetails so wellI did not understand the productdetails at its, etc.100.0100.0100.017.424.518.76.97.76.9
Appropriate use of outside expertiseAbout 70% of the respondents knew a consultant office or a system to be used whenfinancial trouble occurred.― One-third of those who had experienced financial trouble did not know such aconsultant office or a system even at the time of the survey.Nearly 40% of the respondents acquired financial and economic information less oftenthan once a month.― The major information sources used when choosing a financial product were in thefollowing order: (1) websites; (2) consultation at financial institutions; (3)pamphlets provided at financial institutions; (4) television, newspapers, magazines,etc.; and (5) conversations with family members/friends.― The percentage of correct answers given to true/false questions for those who neveracquired financial and economic information was about 60% of the averagepercentage of correct answers for all respondents.Figure 28 Recognition of a consultant office,etc. to be used when financialtrouble occurred (Q38)Figure 29 Frequency of acquiring financialand economic information (Q48)(%)Incorrect26.3Correct73.7(%)Correct IncorrectAll respondents73.726.3Those who had experienced financial trouble66.633.4Figure 30 Information sources used whenchoosing a financial product (Q35)*(%)2016.2(-)6.0(2.6)Conversations with familymembers/friendsThrough TV, newspapers, etc.From pamphlets provided atfinancial institutionsConsultation at financialinstitutions4.7(8.3)Consultation with financialprofessionals, etc.At a lecture meeting or aseminarConversations with familymembers/friendsThrough TV, newspapers, etc.From pamphlets provided atfinancial institutionsConsultation at financialinstitutionsFrom websitesFrom websites19.5About once a month8.3Less often than the above18.6Never18.5Nearly 40% of the respondents acquiredfinancial and economic information lessoften than once a month.Figure 31 Correct answers by category forthose who never acquired financialand economic information (Q48)2. Life planning16.1 14.5(25.8) (35.5)100About once a week8. Outside expertiseConsultation with financialprofessionals, etc.23.722.4(17.1)(42.6)34.91. Family budgetmanagement100.0At a lecture meeting or a seminar30Almost every day7. Wealth building0.06. Loans3. Financialtransactions4. Financial basics5. InsuranceThose who did not acquire information (correct answers: 33.9%)All respondents (correct answers: 55.6%)* Figures in parentheses represent results of the 2011Financial Literacy Survey conducted mainly throughface-to-face interviews and postal mail. The 2016survey was an online survey.11A
2. Analysis of financial knowledge by attributeThe characteristics of the percentage of correct answers by attribute were as follows.(1) The percentage was the lowest for the 18–29 age group. The percentage tended tobecome higher as the age rose (slightly declining for those in their 70s).(2) The percentage was relatively low for students and part-timers.(3) The percentage tended to be higher for those who had higher annual income and alarger amount of financial assets.(4) The percentage tended to be higher for those who acquired financial and economicinformation more frequently.(5) The percentage was higher for those who had more experience in financialtransactions.Figure 32 Correct answers given to true/false questions (25 questions including Q4)By age groupBy employment or work Age 18–2940s30s50sBy annual )By amount of financial lionyen)10(millionyen)0By frequency of acquiring financialand economic informationFigure 33 Effects of experience in financialtransactions (Q24, 32, and 45)(%)70605040302010060.464.865.662.255.8Correct answersCorrectanswers for for those whohad experienceallin stmentMortgageAlmost every About once a About once a Less often thandayonce a monthweekmonthLife insuranceNever1254.359.752.573.669.657.4(%)Effects ofexperience infinancialtransactions(B-A)19.39.94.9The percentage of correct answers was higher for thosewho had more experience in financial transactions.
3. Analysis by level of financial knowledgeWhen the answers to the true/false questions (25 questions) were converted intoscores by giving 4 points to one correct answer, the scores were widely distributed from0 to 100 points.The proportion of those who had high scores was large among males in their 40s to70s. The proportion of those who had participated in financial education was alsorelatively high among these age groups.The characteristics of behavior and attitude found in those who had high scoresincluded: (1) acquiring financial and economic information frequently; (2) securelymanaging family budget; (3) purchasing a financial product after comparing it withother products, searching for relevant information on websites, consulting with financialinstitutions, etc., and understanding the product details; (4) having less tendency for lossaversion and herd behavior; (5) having a financial plan; and (6) setting aside emergencyor rainy day funds. As a result, they (1) were less likely to become involved in financialtrouble, (2) did not use consumer loans frequently, (3) felt a less sense of burden fromloans
1 October 2016 . Central Council for Financial Services Information (Secretariat: Public Relations Department, Bank of Japan) Financial Literacy Survey: 2016 Results * Introduction The Financial Literacy Survey 2016 is Japan's first large-scale questionnaire survey conducted with the aim of understanding the current state of financial literacy, i.e., financial knowledge and financial decision .