Transcription
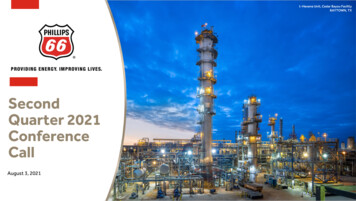
Phillips 66 Branded Marketing SiteHOUSTON, TXSweeny ethylene unit1-HexeneCedarBayouFacilityPhillips 66Unit,BrandedMarketingSite TXOLDOCEAN,BAYTOWN,TXHOUSTON, TXSecondQuarter 2021ConferenceCallAugust 3, 20211
Cautionary StatementThis presentation contains certain forward-looking statements within the meaning of Section 27A of the Securities Act of 1933, as amended, and Section 21E of theSecurities Exchange Act of 1934, as amended, which are intended to be covered by the safe harbors created thereby. Words and phrases such as “is anticipated,” “isestimated,” “is expected,” “is planned,” “is scheduled,” “is targeted,” “believes,” “continues,” “intends,” “will,” “would,” “objectives,” “goals,” “projects,” “efforts,”“strategies” and similar expressions are used to identify such forward-looking statements. However, the absence of these words does not mean that a statement is notforward-looking. Forward-looking statements included in this presentation are based on management’s expectations, estimates and projections as of the date they aremade. These statements are not guarantees of future performance and you should not unduly rely on them as they involve certain risks, uncertainties and assumptions thatare difficult to predict. Therefore, actual outcomes and results may differ materially from what is expressed or forecast in such forward-looking statements. Factors thatcould cause actual results or events to differ materially from those described in the forward-looking statements include: the continuing effects of the COVID-19 pandemicand its negative impact on commercial activity and demand for refined petroleum products; the inability to timely obtain or maintain permits necessary for capital projects;changes to worldwide government policies relating to renewable fuels and greenhouse gas emissions that adversely affect programs like the renewable fuel standardsprogram, low carbon fuel standards and tax credits for biofuels; fluctuations in NGL, crude oil, and natural gas prices, and petrochemical and refining margins; unexpectedchanges in costs for constructing, modifying or operating our facilities; unexpected difficulties in manufacturing, refining or transporting our products; the level and successof drilling and production volumes around our Midstream assets; risks and uncertainties with respect to the actions of actual or potential competitive suppliers andtransporters of refined petroleum products, renewable fuels or specialty products; lack of, or disruptions in, adequate and reliable transportation for our NGL, crude oil,natural gas, and refined products; potential liability from litigation or for remedial actions, including removal and reclamation obligations under environmental regulations;failure to complete construction of capital projects on time and within budget; the inability to comply with governmental regulations or make capital expenditures tomaintain compliance; limited access to capital or significantly higher cost of capital related to illiquidity or uncertainty in the domestic or international financial markets;potential disruption of our operations due to accidents, weather events, including as a result of climate change, terrorism or cyberattacks; general domestic andinternational economic and political developments including armed hostilities, expropriation of assets, and other political, economic or diplomatic developments, includingthose caused by public health issues and international monetary conditions and exchange controls; changes in governmental policies relating to NGL, crude oil, natural gas,refined petroleum products, or renewable fuels pricing, regulation or taxation, including exports; changes in estimates or projections used to assess fair value of intangibleassets, goodwill and property and equipment and/or strategic decisions with respect to our asset portfolio that cause impairment charges; investments required, or reduceddemand for products, as a result of environmental rules and regulations; changes in tax, environmental and other laws and regulations (including alternative energymandates); the operation, financing and distribution decisions of equity affiliates we do not control; the impact of adverse market conditions or other similar risks to thoseidentified herein affecting PSXP, and other economic, business, competitive and/or regulatory factors affecting Phillips 66’s businesses generally as set forth in our filingswith the Securities and Exchange Commission. Phillips 66 is under no obligation (and expressly disclaims any such obligation) to update or alter its forward-lookingstatements, whether as a result of new information, future events or otherwise.This presentation includes non-GAAP financial measures. You can find the reconciliations to comparable GAAP financial measures at the end of the presentation materials orin the “Investors” section of our website.2
Executing the StrategySweeny Ethylene UnitSWEENY/OLD OCEAN, TXHumberSouth TexasRefineryGateway TerminalN. LINCOLNSHIRE, U.K. INGLESIDE, TX3
2Q 2021 OverviewPonca City RefineryPONCA CITY, OK MM (UNLESS OTHERWISE NOTED)Adjusted earningsAdjusted EPS1Operating cash flowPhillips 66 Branded Marketing SiteHOUSTON,Ponca Refinery, PONCACITY, OKTXLake Charles RefineryWESTLAKE, LA 3290.741,743Capital expenditures and investments380Shareholder distributions2394Common shares outstanding at June 30438 MMPhillips 66 Branded Marketing SiteST. LOUIS, MO1) Dollars per share2) Shareholder distributions represent dividends; share repurchases remained suspended4Billings RefineryBillings, Montana
2Q 2021 Adjusted Earnings2Q 2021 VS. 1Q 2021 ( MM)1Q g& SpecialtiesCorporate& Other1897IncomeTaxes2Q )(12)473329(509)40316657(706)479(244)(95)(78)2Q 2021 Adjusted Pre-Tax Income (Loss)5
2Q 2021 Midstream Adjusted Pre-Tax Income2Q 2021 VS. 1Q 2021 ( MM)4718Higher TransportationvolumesLower NGL operating costsand higher volumesResumed construction ofSweeny Frac 4 in July(25)3162761Q 2021TransportationAdjustedPre-Tax Income224NGL& OtherDCPMidstream8392Q 2021AdjustedPre-Tax Income2Q 20216
2Q 2021 Chemicals Adjusted Pre-Tax Income2Q 2021 VS. 1Q 2021 ( MM)55419(1)Record quarter earnings657102% O&P utilizationBegan construction onworld-scale 1-hexene unit1841Q 2021AdjustedPre-Tax IncomeOlefins &Polyolefins593Specialties,Aromatics &Styrenics82Other2Q 2021AdjustedPre-Tax Income(18)2Q 20217
2Q 2021 Refining Adjusted Pre-Tax Loss2Q 2021 VS. 1Q 2021 ( MM)1Q 2021AdjustedPre-Tax LossAtlanticBasin /EuropeGulfCoastCentralCorridorWestCoast2Q 2021AdjustedPre-Tax Loss88% crude utilization82% clean product yield 3.92/BBL realized margin(706)(1,026)117165 118 MM turnaround costs44(6)(108)(253)(76)(269)2Q 20218
2Q 2021 Refining Margins – Market vs. RealizedWORLDWIDE REFINING ( /BBL, UNLESS OTHERWISE NOTED)(3.89)0.27(2.38)17.76(7.84)2Q 2021Market3:2:1ConfigurationAvg Market Crude: 67.80Secondary ProductsFeedstockOther3.922Q 2021RealizedMargin22% Market Capture9
2Q 2021 Marketing & Specialties Adjusted Pre-Tax Income2Q 2021 VS. 1Q 2021 ( MM)8181Strong U.S. MarketingearningsImproved demand479290Refined product exports of216 MBPD1Q 2021AdjustedPre-Tax IncomeMarketing& OtherSpecialties392872Q 2021AdjustedPre-Tax Income2Q 202110
2Q 2021 Cash Flow B0.8(0.4)0.9(0.4)(0.1)2.21.4March 31,2021CashBalance Expenditures& InvestmentsShareholderDistributionsOtherJune 30,2021CashBalance 1111) Includes cash and cash equivalents
OutlookSouth Texas Gateway TerminalINGLESIDE, TXDenver TerminalDENVER, CO3Q 2021Global Olefins & Polyolefins utilizationMid-90%Refining crude utilizationMarket ConditionsRefining turnaround expenses (pre-tax) 120 MM – 150 MMCorporate & Other costs (pre-tax) 240 MM – 250 MMPhillips 66 Hot Air BalloonALBUQUERQUE INTERNATIONAL BALLOON FIESTA12
Phillips 66 Branded Marketing SiteST. LOUIS, MOQuestionsand Answers
Phillips 66 Branded Marketing SiteST. LOUIS, MOAppendix
2021 Estimated SensitivitiesAnnual EBITDA MMMidstream - DCP (net to Phillips 66)10 /Gal Increase in NGL price14Chemicals - CPChem (net to Phillips 66)1 /Lb Increase in Chain Margin (Ethylene, Polyethylene, NAO)65Worldwide Refining 1/BBL Increase in Gasoline Margin 1/BBL Increase in Distillate Margin350300Impacts due to Actual Crude Feedstock Differing from Feedstock Assumed in Market Indicators: 1/BBL Widening WTI / WCS Differential (WTI less WCS) 1/BBL Widening LLS / Maya Differential (LLS less Maya) 1/BBL Widening LLS / WTI Differential (LLS less WTI) 1/BBL Widening WTI / WTS Differential (WTI less WTS)10 /MMBtu Increase in Natural Gas price100753530(15)15Sensitivities shown above are independent and are only valid within a limited price range
YTD 2021 Cash Flow B0.9(0.5)1.1(0.7)(0.8)(0.3)2.5December WorkingCapitalDebtCapitalExpenditures& InvestmentsShareholderDistributionsOtherJune 30,2021Cash1Balance161) Includes cash and cash equivalents
Capital StructureExcluding PSXPConsolidated %27%23%22%17%27.227.221.511.811.23.02018Equity Debt B1Q20213.02.21.42Q2021Cash & Cash Equivalents 8.218.02.21.31Q20212Q2021Net Debt-to-Capital17
2Q 2021 Refining Margins – Market vs. RealizedATLANTIC BASIN / EUROPE ( /BBL, UNLESS OTHERWISE NOTED)Brent: 68.83(3.81)(0.65)(1.83)96% crude utilization17.52(6.60)4.6326% market capture2Q tockOther2Q 2021RealizedMarginMarket 3:2:1 - Dated Brent / Gasoline 83.7 RBOB NYH / Diesel 15ppm NYH18
2Q 2021 Refining Margins – Market vs. RealizedGULF COAST ( /BBL, UNLESS OTHERWISE NOTED)LLS: 67.951.62(3.98)88% crude utilization14.99(2.68)14% market capture2Q tock(7.85)2.10Other2Q 2021RealizedMarginMarket 3:2:1 - LLS / Gasoline 85 CBOB / Diesel 62 10ppm19
2Q 2021 Refining Margins – Market vs. RealizedCENTRAL CORRIDOR ( /BBL, UNLESS OTHERWISE NOTED)WTI: 66.091.45(2.81)87% crude utilization(3.70)19.44(7.98)6.4033% market capture2Q tockOther2Q 2021RealizedMarginMarket 3:2:1 - WTI / Gasoline Unl Sub Octane Group 3 / ULSD Group 320
2Q 2021 Refining Margins – Market vs. RealizedWEST COAST ( /BBL, UNLESS OTHERWISE NOTED)ANS: 68.44(4.67)79% crude utilization(2.87)21.60(0.94)16% market capture2Q tock(9.75)3.37Other2Q 2021RealizedMarginMarket 3:2:1 - ANS / Los Angeles CARBOB / Los Angeles No. 2 CARB21
2Q 2021 Adjusted Earnings2Q 2021 VS. 2Q 2020 ( MM)186(20)161568(285)(28)329(324)2Q ing& SpecialtiesCorporate& 479(244)(95)(78)2Q 2021AdjustedEarnings2Q 2021 Adjusted Pre-Tax Income (Loss)22
2Q 2021 Midstream Adjusted Pre-Tax Income2Q 2021 VS. 2Q 2020 ( MM)94—(23)3162452Q 2020AdjustedPre-Tax IncomeTransportation224NGL & Other83DCPMidstream92Q 2021AdjustedPre-Tax Income2Q 202123
2Q 2021 Chemicals Adjusted Pre-Tax Income2Q 2021 VS. 2Q 2020 ( MM)7110487657892Q 2020AdjustedPre-Tax IncomeOlefins &PolyolefinsSpecialties,Aromatics &StyrenicsOther59382(18)2Q 2021AdjustedPre-Tax Income2Q 202124
2Q 2021 Refining Adjusted Pre-Tax Loss2Q 2021 VS. 2Q 2020 ( MM)(706)(867)11237103(91)2Q 2020AdjustedPre-Tax LossAtlanticBasin /EuropeGulfCoastCentralCorridorWest Coast(108)(253)(76)(269)2Q 2021AdjustedPre-Tax Loss2Q 202125
2Q 2021 Marketing & Specialties Adjusted Pre-Tax Income2Q 2021 VS. 2Q 2020 ( MM)531334792932Q 2020AdjustedPre-Tax IncomeMarketing& OtherSpecialties392872Q 2021AdjustedPre-Tax Income2Q 202126
2Q 2021 Corporate & Other Adjusted Pre-Tax Loss2Q 2021 VS. 2Q 2020 ( MM)2Q 2020AdjustedPre-Tax LossNet InterestExpenseCorporateOverhead& Other(224)2Q 2021AdjustedPre-Tax Loss(244)(19)(1)27
2Q 2021 Corporate & Other Adjusted Pre-Tax Loss2Q 2021 VS. 1Q 2021 ( MM)1Q 2021AdjustedPre-Tax LossNet InterestExpenseCorporateOverhead& Other2Q 2021AdjustedPre-Tax Loss(244)(251)2528
Non-GAAP ReconciliationsMillions of DollarsExcept as IndicatedJun YTDPhillips 66Consolidated Earnings (Loss)Pre-Tax Adjustments:ImpairmentsImpairments by equity affiliatesPending claims and settlementsCertain tax impacts 20212Q20201QJun 84)(283)202412638—20(84)(208)2024(324)Pension settlement expenseWinter-storm-related costsLower-of-cost-or-market inventory adjustmentsAsset dispositionsTax impact of adjustments1Other tax impactsNoncontrolling interestsAdjusted Earnings (Loss) 4765——(64)(17)(51)(180)Earnings (Loss) Per Share of Common Stock (dollars) (0.83)0.66(1.49)(6.00)(0.33)Adjusted Earnings (Loss) Per Share of Common Stock (dollars)2 (0.43)0.74(1.16)0.28(0.74)1) We generally tax effect taxable U.S.-based special items using a combined federal and state annual statutory income tax rate of approximately 25%. Taxable special items attributable to foreignlocations likewise use a local statutory income tax rate. Nontaxable events reflect zero income tax. These events include, but are not limited to, most goodwill impairments, transactionslegislatively exempt from income tax, transactions related to entities for which we have made an assertion that the undistributed earnings are permanently reinvested, or transactions occurringin jurisdictions with a valuation allowance.2) YTD 2020 is based on adjusted weighted-average diluted shares outstanding of 440,653 thousand, and other periods are based on the same weighted-average diluted shares outstanding asthat used in the GAAP diluted earnings per share calculation. Income allocated to participating securities, if applicable, in the adjusted earnings per share calculation is the same as that used inthe GAAP diluted earnings per share calculation.29
Non-GAAP ReconciliationsMillions of DollarsExcept as Indicated2021Jun YTD20202Q1QJun YTD2QMidstreamPre-Tax Income (Loss) 38831276(378)324198—1981,161—Pension settlement expense44—55Winter-storm-related costs2—2——Lower-of-cost-or-market inventory adjustments———1—Asset dispositions———(84)(84) 592316276705245 77762315421142Impairments by equity affiliates———1515Pension settlement expense1818———Winter-storm-related costs461630——Lower-of-cost-or-market inventory adjustments———563284165718428289Pre-Tax Adjustments:ImpairmentsAdjusted Pre-Tax IncomeChemicalsPre-Tax IncomePre-Tax Adjustments:Adjusted Pre-Tax Income 30
Non-GAAP ReconciliationsMillions of DollarsExcept as Indicated2021Jun YTD20202Q1QJun YTD2QRefiningPre-Tax Loss �1,845—Pension settlement expense2020—2626Winter-storm-related costs17314——Pre-Tax Adjustments:Lower-of-cost-or-market inventory adjustmentsAdjusted Pre-Tax Loss————(15) (1,732)(706)(1,026)(1,268)(867) 766476290799286———(37)—33—44———153 769479290781293 (497)(246)(251)(416)(219) keting & SpecialtiesPre-Tax IncomePre-Tax Adjustments:Pending claims and settlementsPension settlement expenseLower-of-cost-or-market inventory adjustmentsAdjusted Pre-Tax IncomeCorporate & OtherPre-Tax LossPre-Tax Adjustments:Certain tax impactsPension settlement expenseAdjusted Pre-Tax Loss31
Non-GAAP ReconciliationsMillions of DollarsExcept as Indicated2021Jun YTD20202Q1QJun YTD2QMidstream - TransportationPre-Tax Income 2312247414214198—198———Pre-Tax d costs———(84)(84) 430224206330130 114793525778Pension settlement expense44—55Winter-storm-related costs1—1—— 119833626283 -cost-or-market inventory adjustments———1—4393411332Asset dispositionsAdjusted Pre-Tax IncomeMidstream - NGL & OtherPre-Tax IncomePre-Tax Adjustments:Adjusted Pre-Tax IncomeMidstream - DCP MidstreamPre-Tax Income (Loss)Pre-Tax Adjustments:Adjusted Pre-Tax Income 32
Non-GAAP ReconciliationsMillions of DollarsExcept as Indicated2021Jun YTD20202Q1QJun YTD2QChemicals - Olefins & PolyolefinsPre-Tax Income 70756214524770Impairments by equity affiliates———1515Pension settlement expense1616———Winter-storm-related costs441529——Lower-of-cost-or-market inventory adjustments———3721 767593174299106 10579264—Pension settlement expense22———Winter-storm-related costs211—————1911 10982272311 (35)(18)(17)(40)(28)————— (35)(18)(17)(40)(28)Pre-Tax Adjustments:Adjusted Pre-Tax IncomeChemicals - Specialties, Aromatics & StyrenicsPre-Tax IncomePre-Tax Adjustments:Lower-of-cost-or-market inventory adjustmentsAdjusted Pre-Tax IncomeChemicals - OtherPre-Tax LossPre-Tax Adjustments:NoneAdjusted Pre-Tax Loss33
Non-GAAP ReconciliationsMillions of DollarsExcept as IndicatedJun YTDRefining - Atlantic Basin / EuropePre-Tax LossPre-Tax Adjustments:ImpairmentsPension settlement expenseWinter-storm-related costsAdjusted Pre-Tax LossRefining - Gulf CoastPre-Tax LossPre-Tax Adjustments:ImpairmentsPension settlement expenseWinter-storm-related costsAdjusted Pre-Tax Loss20212Q20201QJun YTD2Q (263)(110)(153)(864)(227) —(220) (517)(264)(253)(1,208)(365) �(356)34
Non-GAAP ReconciliationsMillions of DollarsExcept as IndicatedJun YTDRefining - Central CorridorPre-Tax LossPre-Tax Adjustments:ImpairmentsPension settlement expenseWinter-storm-related costsLower-of-cost-or-market inventory adjustmentsAdjusted Pre-Tax Income (Loss)Refining - West CoastPre-Tax LossPre-Tax Adjustments:ImpairmentsPension settlement expenseAdjusted Pre-Tax Loss20212Q20201QJun YTD2Q 41)4356 —67—(317)——110—6—(15)(113) 433)—4 —4(655)(178)35
Non-GAAP ReconciliationsMillions of DollarsExcept as IndicatedJun YTDMarketing & Specialties - Marketing & OtherPre-Tax IncomePre-Tax Adjustments:Pending claims and settlementsPension settlement expenseAdjusted Pre-Tax IncomeMarketing & Specialties - SpecialtiesPre-Tax IncomePre-Tax Adjustments:Lower-of-cost-or-market inventory adjustmentsAdjusted Pre-Tax Income20212Q20201QJun YTD2Q 600389211726255 —3603—3392——211(37)4693—4259 16687797331 —166—87—79158833436
Non-GAAP ReconciliationsMillions of Dollars (Except as Indicated)Atlantic Basin/Europe2Q 2021CentralCorridorGulf CoastWest CoastWorldwideRealized Refining MarginsLoss before income taxes (110)(264)(82)(273)(729)Taxes other than income taxes1825112276Depreciation, amortization and impairments52773457220Selling, general and administrative expenses181471049217299125281922Equity in losses of affiliates2—65—67Other segment income, net(8)(6)(8)(2)(24)Plus:Operating expensesProportional share of refining gross margins contributed by equity affiliatesRealized refining 46628,158170,96749,97969,36443,18928,158190,690 (2.20)(3.81)(3.49)(9.70)(4.26) 4.632.106.403.373.92 Total processed inputs (thousands of barrels)1Adjusted total processed inputs (thousands of barrels)Loss before income taxes (dollars per barrel)2Realized refining margins (dollars per barrel)31) Adjusted total processed inputs include our proportional share of processed inputs of an equity affiliate.2) Loss before income taxes divided by total processed inputs.3) Realized refining margins per barrel, as presented, are calculated using the underlying realized refining margin amounts, in dollars, divided by adjusted total processed inputs, in barrels. As such, recalculated per barrel amountsusing the rounded margins and barrels presented may differ from the presented per barrel amounts.37
Non-GAAP Reconciliations2021 June YTDNumerator ( MM)Net Loss (265)After-tax interest expense228GAAP ROCE loss(37)After-tax special items229Adjusted ROCE earnings 192 36,716Denominator ( MM)GAAP average capital employed12021 Annualized GAAP ROCE2021 Annualized Adjusted ROCE—%1%381) Capital employed is total equity plus total debt
Non-GAAP ReconciliationsMillions of Dollars (Except as Indicated)June 30, 2021Total Debt Total EquityDebt-to-Capital RatioTotal CashNet Debt-to-Capital RatioPhillips 66ConsolidatedPhillips 66Partners1Phillips 66 ExcludingPhillips 66 Partners15,4133,91011,50320,6022,42618,17643 % 2,20739 %239 %2,20534 %391) Phillips 66 Partners’ third-party debt and Phillips 66's noncontrolling interest attributable to Phillips 66 Partners
Non-GAAP ReconciliationsMillions of Dollars2Q 2021GrowthSustainingTotalCapital Expenditures and InvestmentsMidstream 10140141Refining68118186Marketing & Specialties101222Corporate & Other—3131179201380———179201380Adjusted Capital SpendingCapital Expenditures and Investments Funded by a Joint Venture Partner(Midstream)Capital Expenditures and Investments 40
Non-GAAP ReconciliationsMillions of DollarsExcept as Indicated2Q 2021Effective Tax RatesIncome before income taxes Special items43666Adjusted income before income taxes 502Income tax expense 62Special itemsAdjusted income tax expense33 95GAAP effective tax rate14.2 %Adjusted effective tax rate18.9 %41
transporters of refined petroleum products, renewable fuels or specialty products; lack of, or disruptions in, adequate and reliable transportation for our NGL, crude oil, natural gas, and refined products; potential liability from litigation or for remedial actions, including removal and reclamation obligations under environmental regulations;


