Transcription
Airline Operating Costs andProductivityTehran, 20‐23 February 2017
Airline Economics: Costs and Productivity1.Airline Operating Costs 2.Functional Operating Expense Comparisons 3.DOT Form 41 DataObjective vs. Functional Cost CategoriesPercentage Break Down of Operating ExpensesFlight Operating CostsExample: B-757 Operating CostsCost comparisons across aircraft typesAirline Cost and Productivity Comparisons Unit Costs per ASMAircraft and Employee Productivity2
1. Airline Operating Costs DOT Form 41 traffic, financial, and operating cost data reported to the DOT by US Major airlines––Data is reported and published quarterly for most tablesDetail of reporting differs for different expense categories Aircraft operating expenses by aircraft type and region of operationOther expenses more difficult to allocate by aircraft typeDOT Form 41 includes the following schedules:––––––P12 : Profit and Loss statementP52 : Aircraft Operating ExpensesP6 : Operating Expenses by Objective GroupingsP7 : Operating Expenses by Functional GroupingsP10 : Employment StatisticsB1 : Balance Sheet3
Objective Cost Categories Salaries and related fringe benefits– Materials purchased– Aircraft fuel & oil, maintenance materials, passenger food, other materialsServices purchased– General management, flight personnel, maintenance labor, aircraft & traffic handlingpersonnel, other personnelAdvertising & promotions, communications, insurance, outside maintenance, commissions,other servicesSeparate categories for:–Landing fees, rentals (including aircraft), depreciation (including aircraft), other expenses4
Functional Cost Categories Aircraft operating costs– Aircraft servicing costs– Meals, flight attendants, in-flight servicesReservation and Sales costs– Processing passengers, baggage and cargo at airportsPassenger service costs– Handling aircraft on the ground, includes landing feesTraffic service costs– Expenses associated with flying aircraft, also referred to as “Direct Operating Costs” (DOC)Airline reservations and ticket offices, travel agency commissionsOther costs, including:––Advertising and publicity expenseGeneral and administrative expense5
Total Airline Operating Cost Breakdown US Major airline total operating costs :––44% is aircraft operating expense, which includes fuel, direct maintenance,depreciation, and crew29% is servicing expense –14% is reservations and sales expense –Aircraft servicing (7%)Traffic servicing (11%)Passenger service (11%)This figure was 19.5% in 1993, but declined steadily throughout the 1990s13% is overhead expense Advertising and Publicity (2%)General and Administrative (6%)6
Functional Cost Comparison Adapted from Form 41, used by Boeing, MIT (and Aviation Daily) for more detailedcomparisonsFLIGHT (DIRECT) OPERATING COSTS (DOC) 50% All costs related to aircraft flying operationsInclude pilots, fuel, maintenance, and aircraft ownershipGROUND OPERATING COSTS 30% Servicing of passengers and aircraft at airport stationsIncludes aircraft landing fees and reservations/sales chargesSYSTEM OPERATING COSTS 20% Marketing, administrative and general overhead itemsIncludes in-flight services and ground equipment ownershipPercentages shown reflect historical “rules of thumb”.7
Activity Drivers per Functional Category Aircraft Operating Costs– Aircraft Servicing Costs– Per RPM (average 0.015)Reservations and Sales Costs– Per Enplaned Passenger (average 15)Passenger Servicing Costs– Per Aircraft Departure (average 800)Traffic Servicing Costs– Per Block Hour (for example, 2550 for 185-seat B757-200)% of Total Revenue (average 14%)Other Indirect and System Overhead Costs–% of Total Operating Expense (average 13%)8
Flight Operating Costs Flight operating costs (FOC) by aircraft type:––– Reflect an average allocation of system-wide costs per block hour, as reported by airlines foreach aircraft typeCan be affected by specific airline network or operational patternsCollected by US DOT as Form 41 operating data from airlinesTypical breakdown of FOC for US carrier:CREW: Pilot wages and benefitsFUEL: Easiest to allocate and most clearly variable costMAINTENANCE: Direct airframe and engine maintenance cost, plus “burden” or overhead (hangarsand spare parts inventory)OWNERSHIP: Depreciation, leasing costs and insurance9
Example: B757-200 FOC Costs per block-hour of operations (avg. 186 seats):CREW 489FUEL 548MAINTENANCE 590OWNERSHIP 923TOTAL FOC 2550 per block-hrBased on 1252 mile average stage length and 11.3 block-hr daily utilization (average forUS Major):––Different stage lengths and utilization by different airlines result in substantial variations in blockhour costs for same aircraft typeAlso, differences in crew costs (union contracts, seniority), maintenance costs (wage rates), andownership costs (age of a/c)10
Boeing 757‐200 Flight Operating CostsAirlineAmericanContinentalDeltaAmerica WestNorthwestTrans World AirUnitedUSAirAVERAGENumber 1179186182186FOC perBlock Hour 2,568 2,568 2,357 2,065 2,260 2,656 2,684 3,069 2,48111FOC perSeat Hour 13.66 14.35 12.95 10.87 11.83 14.84 14.43 16.87 13.34Utilization Stage 16711.7113711.8140511.2128111.1125411.31252
Comparison of FOC Across Aircraft Types All else being equal, larger aircraft should have highest flight operating cost per hour,lowest unit cost per ASM:–– There exist some clear economies of aircraft size (e.g., two pilots for 100 and 400 seat aircraft,although paid at different rates)Also economies of stage length, as fixed costs of taxi, take-off and landing are spread overlonger flight distanceBut, many other factors distort cost comparisons:––––Pilots paid more for larger aircraft that fly international routesNewer technology engines are more efficient, even on small planesReported depreciation costs are subject to accounting proceduresAircraft utilization rates affect allocation of costs per block-hour12
FOC Comparison: Selected AircraftA/C TypeSeats100FOC /block-hr 1973FOC /seat-hr 19.73DC9-30A320148 2270 15.33119111.7B727-200150 2555 17.037048.4B757-200186 2550 13.71125211.3B747-400375 6455 17.21406512.413AverageDailystage(mi) block-hrs4728.1
FOC Comparisons (cont’d) Flight operating cost comparisons on previous slide provide insights intodifferent aircraft characteristics:– Largest B747-400 aircraft has highest total FOC per block hour, while smallest DC930 has highest FOC per seat hour, as expected– However, lowest cost per seat hour (and in turn per ASM) provided by newtechnology mid-sized B757, followed by A320– B747-400 costs suffer from high wage rates paid to senior pilots who flyinternational services on this aircraft type– Comparisons of same-sized B727 and A320 show newer A320 with lower costs: A320 more fuel efficient, with two pilots (vs 3 on B727) A320 has higher daily utilization, due to longer stage length14
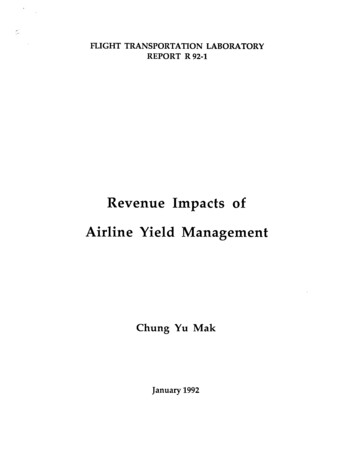
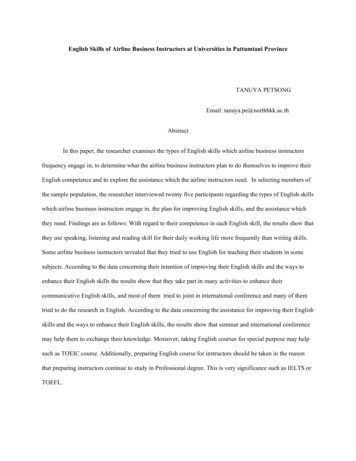
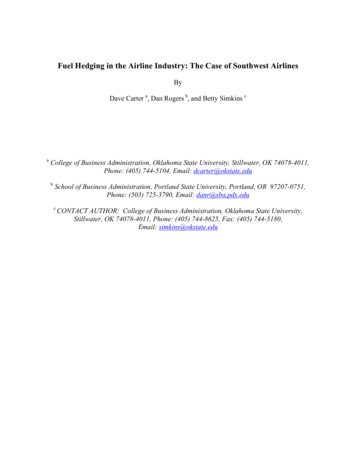
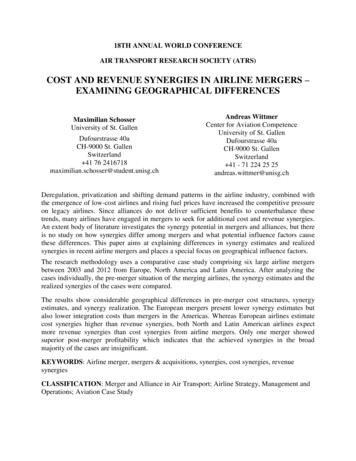
Cost and Productivity Comparisons Average unit cost for 8 selected majors increased from 9.15 to 9.53cents (4%) between 1993-1999The top four major carriers have very similar unit costs in this timeperiodUnit cost increased dramatically between 1993 and 1999 forContinental (17%) and USAir (24%)Southwest and America West had the lowest unit cost, while USAir hadthe highest unit cost15
Unit Cost (Total System Operating Expense/ASM)0.150.14Unit Cost ( /ASM)0.130.128 Majors 0.070.061992199319941995199619971998Year1619992000
Unit Cost (Total System Operating Expense/ASM)0.150.14Unit Cost ( /ASM)0.130.12US Air8 Majors AverageAmerica 2199319941995199619971998Year1719992000
Aircraft Productivity Measured in ASMs generated per aircraft per day: # departures X average stage length X # seatsAircraft “utilization” measured in block-hours/day:– Block hours begin at door close (blocks away from wheels) to door open (blocks under wheels)– Gate-to-gate time, including ground taxi timesIncreased aircraft productivity achieved with:– More flight departures per day, either through shorter turnaround (ground) times or off-peakdeparture times– Longer stage lengths (average stage length is positively correlated with increased aircraftutilization block hours per day)– More seats in same aircraft type (no first class seating and/or tighter “seat pitch”)18
Example: Boeing 737‐500 ProductivityAirlineFlightsper 10.2400122399,74619
Example: Boeing 737‐500 FOC per block ental 510 430 651 698 2,291United 927 487 1048 510 2,974Southwest 388 537 251 350 1,52620
Daily Aircraft Utilization (block‐hrs/day)Top 3 Majors and Southwest1211.511Block 102-2
Unit Aircraft Operating Cost ( /ASM)0.0550.050.045 /ASMAAUADLWN0.040.0350.031998 1998 1998 1998 1999 1999 1999 1999 2000 2000 2000 2000 2001 2001 2001 2001 2002 200212341234123412341222
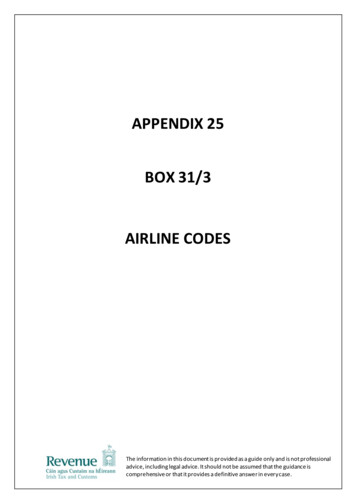
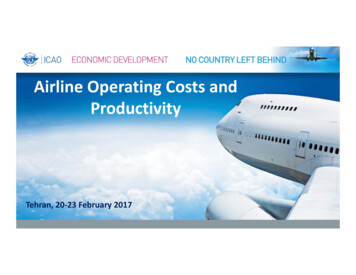
Employee Productivity Measured in ASMs per employee per periodAs with aircraft, employee productivity should be higher with:– Longer stage lengths (amount of aircraft and traffic servicing for each flightdeparture not proportional to stage length)– Larger aircraft sizes (economies of scale in labor required per seat for each flightdeparture)– Increased aircraft productivity due to shorter turnaround times (more ASMsgenerated by aircraft contribute to positive employee productivity measures) Yet, network airlines with long stage lengths and large aircraft have loweremployee productivity rates23
ASMs/employee and Average Stage Length24
ASMs/employee and Average A/C Size25
Summary: Costs and Productivity Challenges Unit cost differences not entirely due to labor costs:–– Network carriers are exploring alternatives for increasing aircraft productivity to reduceunit costs:––– Differences in aircraft productivity can account for up to one half of difference in aircraftoperating expenses per ASMTranslates into about 25% of total unit cost difference between traditional carriers and LCCsContinuous connecting banks to reduce ground times at hubsHigher density seating options (e.g. removal of First Class)More “point-to-point” flying to increase aircraft utilizationSuccessful new “business models” will depend on reducing both aircraft and labor unitcosts–In addition to fine-tuning fare structures to maximize unit revenues26
https://www4.icao.int/newdataplus27
DOT Form 41 Data Objective vs. Functional Cost Categories Percentage Break Down of Operating Expenses 2. Functional Operating Expense Comparisons Flight Operating Costs Example: B-757 Operating Costs Cost comparisons across aircraft types 3. Airline Cost and Productivity Comparisons Unit Costs per ASM