Transcription
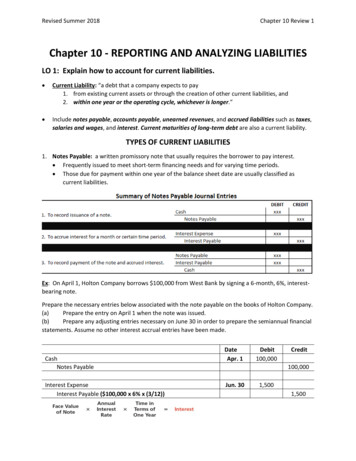
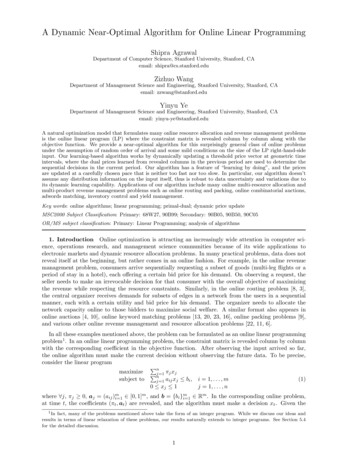
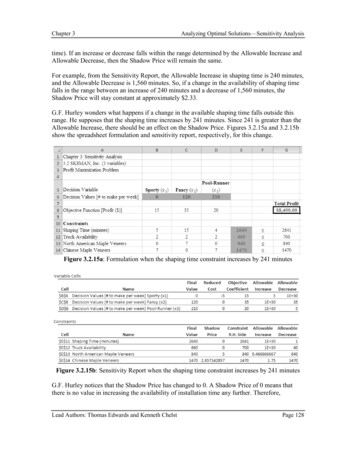
Chapter 3Analyzing Optimal Solutions—Sensitivity Analysistime). If an increase or decrease falls within the range determined by the Allowable Increase andAllowable Decrease, then the Shadow Price will remain the same.For example, from the Sensitivity Report, the Allowable Increase in shaping time is 240 minutes,and the Allowable Decrease is 1,560 minutes. So, if a change in the availability of shaping timefalls in the range between an increase of 240 minutes and a decrease of 1,560 minutes, theShadow Price will stay constant at approximately 2.33.G.F. Hurley wonders what happens if a change in the available shaping time falls outside thisrange. He supposes that the shaping time increases by 241 minutes. Since 241 is greater than theAllowable Increase, there should be an effect on the Shadow Price. Figures 3.2.15a and 3.2.15bshow the spreadsheet formulation and sensitivity report, respectively, for this change.Figure 3.2.15a: Formulation when the shaping time constraint increases by 241 minutesFigure 3.2.15b: Sensitivity Report when the shaping time constraint increases by 241 minutesG.F. Hurley notices that the Shadow Price has changed to 0. A Shadow Price of 0 means thatthere is no value in increasing the availability of installation time any further. Therefore,Lead Authors: Thomas Edwards and Kenneth ChelstPage 128
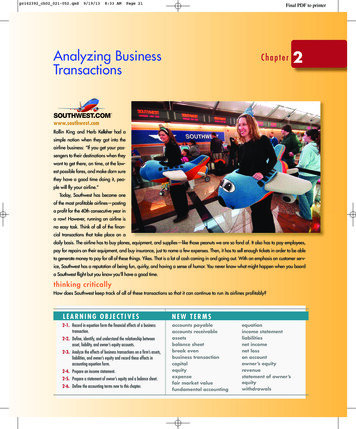
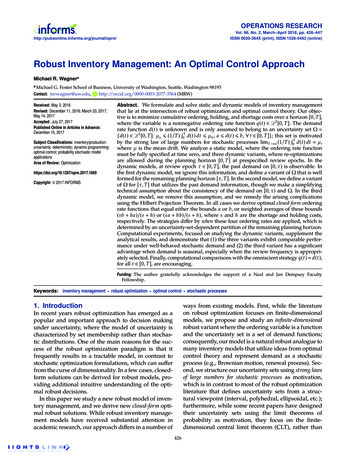
Chapter 3Analyzing Optimal Solutions—Sensitivity Analysisincreasing the availability of a resource beyond the Allowable Increase decreases the ShadowPrice.He also notices that increasing the available shaping time changes the optimal solution to 0Sporty boards, 120 Fancy boards, and 210 Pool-Runner boards per week. Furthermore, theAllowable Increase for shaping time has changed to infinity (1E 30). This means there is novalue in increasing the available shaping time any more.Next, G.F. Hurley investigates what happens if the available shaping time decreases below theAllowable Decrease of 1,560. Suppose he decreases it by 1,561 minutes. The available shapingtime becomes 839 minutes. Figures 3.2.16a and 3.2.16b show the spreadsheet formulation andsensitivity report for this change.Figure 3.2.16a: Formulation when the shaping time constraint decreases by 1,561 minutesFigure 3.2.16b: Sensitivity Report when the shaping time constraint decreases by 1,561 minutesG.F. Hurley notices that this change increases the value of the Shadow Price to 5. That is,decreasing the availability of a resource beyond the Allowable Decrease increases the ShadowLead Authors: Thomas Edwards and Kenneth ChelstPage 129
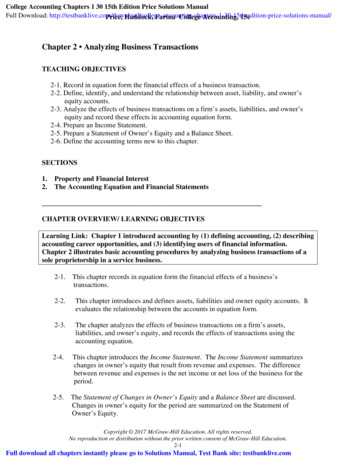
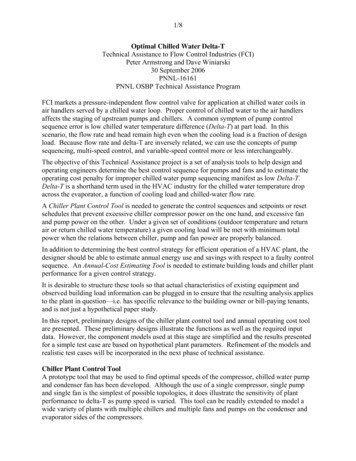
Chapter 3Analyzing Optimal Solutions—Sensitivity AnalysisPrice. This makes economic sense, because decreasing the availability of a resource, as he did,increases the value per unit of that resource.3.2.3 Adding a Fourth Product—Is it profitable?The managers at SK8MAN, Inc. are now considering adding a fourth line of skateboards to theirportfolio of products. The EasyRider skateboard will be made from seven North American mapleveneers, require 12 minutes of shaping time, and, of course, require 2 trucks. The managersbelieve that each EasyRider skateboard manufactured will earn 25 profit. They are excited bythe prospect of adding a new product to their line, but the key question is whether it will beprofitable to do so. Figures 3.2.17 and 3.2.18 display the problem formulation with a fourthdecision variable and the optimal solution, as well as the Sensitivity Report.Figure 3.2.17: Formulation for the 4-decision variable SK8MAN problemFigure 3.2.18: Sensitivity Report for the 4-variable SK8MAN problemNotice that the optimal solution has not changed, despite the addition of a new product. Thatmeans it is not profitable to make the new product. SK8MAN, Inc. will earn more profit bycontinuing to make only Fancy and Pool-Runner skateboards. Now the question is what, ifLead Authors: Thomas Edwards and Kenneth ChelstPage 130
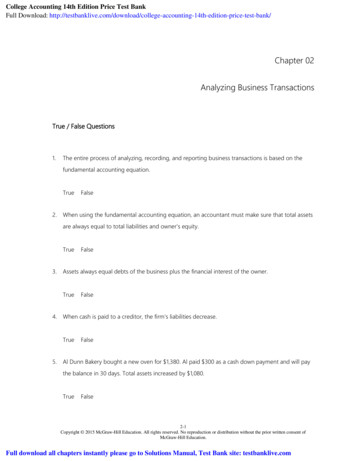
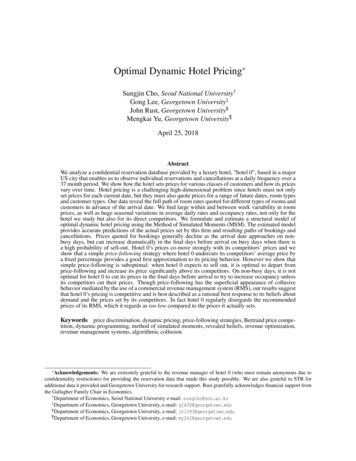
Chapter 3Analyzing Optimal Solutions—Sensitivity Analysisanything, can be done so that making the new EasyRider boards would be part of SK8MAN’soptimal production plan.To answer that question, G.F. Hurley turns his attention to the Sensitivity Report. Consideringthe information on the EasyRider board (product x4), he sees that the Allowable Increase in theobjective coefficient is 3. That means that the profitability of EasyRider boards would have toincrease by at least 3 (to 28) per board before they would become part of the optimal solution.The shadow prices on the constraints help explain why the profit margin would need to be atleast 28 for each EasyRider skateboard. Each EasyRider board requires 7 North Americanmaple veneers and 2 trucks. The related resource constraints have 0 shadow prices because notall of these resources are currently being used. However, each EasyRider requires 12 minutes ofinstallation. Each minute has a shadow price of 2.333. If G.F. Hurley multiplies 12 by 2.333,he obtains 28. Thus the resources needed to produce an EasyRider board are valued at 28 withthe current optimal production plan.Now, suppose the marketing division at SK8MAN, Inc. has just signed a contract with AllieLoop, the top female skateboarder in the world. She will endorse the new EasyRider board.Taking into consideration the cost of Allie Loop’s endorsement contact, the marketing divisionestimates that the retail price of an EasyRider can be increased by 5. This would then increasethe profitability of EasyRider to 30 per board. Since the increase in profitability is larger thanthe Allowable Increase, this should be enough to make it profitable to produce EasyRider boards.Figures 3.2.19a and 3.2.19b shows the problem formulation and the Sensitivity Report afterincreasing the profitability of the EasyRider board (x4) to 30 per board.Figure 3.2.19a: Formulation when the profitability of EasyRider boards is 30Lead Authors: Thomas Edwards and Kenneth ChelstPage 131
Chapter 3Analyzing Optimal Solutions—Sensitivity AnalysisFigure 3.2.19b: Sensitivity Report when the profitability of EasyRider boards is 30When the profitability of the EasyRider board is increased to 30 per board, it becomesprofitable to produce 80 of them per week. G.F. Hurley compares this optimal production planwith the optimal production plan before SK8MAN got the Allie Loop endorsement (see Figure3.2.17). He notices that 210 Pool-Runner boards (x3) will still be produced, but only 40 Fancyboards will be produced. So, in order to produce 80 EasyRider boards, 64 fewer Fancy boardswould have to be made.G.F. Hurley wonders why this is more profitable to produce 64 fewer Fancy boards whileproducing 80 more EasyRider boards. He considers the profit margins on each of the boards.Making 64 fewer Fancy boards would decrease the total profit by (64)( 35) 2,240. At thesame time, making 80 EasyRider boards that were not being made before would increase thetotal profit by (80)( 30) 2,400. Thus, the total profit is being increased by 2,400 – 2,240 160 per week.Lead Authors: Thomas Edwards and Kenneth ChelstPage 132
Chapter 3Analyzing Optimal Solutions—Sensitivity AnalysisSection 3.3: The Pallas Sport Shoe CompanyRecall from Chapter 2 that the Pallas Sport Shoe Company manufactures six different lines ofsport shoes: High Rise, Max-Riser, Stuff It, Zoom, Sprint, and Rocket. Table 3.3.1 displays theamount of daily profit generated by each pair of shoes for each of these six products. It also liststhe amount of time each line of shoes requires for the six steps of production. The last line of thetable shows the total amount of time per day available for each of the six production steps. SuePainter, the production manager of the company would like to determine the daily productionrates for each line of shoes that will maximize profit.Total TimeAvailable(minutes perday)182322201819Profit ( )Stamping (min)1.2521.51.7511.25420Upper Finishing (min)3.53.755344.251,260Insole Stitching (min)23.25 2.75 2.2532.5840Molding (min)5.5676.5852,100Sole-to-Upper Joining (min) 7.57.25676.756.52,100Inspecting (min)232323840Table 3.3.1: Profit and production detail per pair for six lines of sport shoesHigh Max- StuffZoom Sprint RocketRise RiserIt3.3.1 Problem FormulationThe formulation of the problem is given below.Decision VariablesLet:Objective FunctionMaximize:x1 the daily production rate of High Risex2 the daily production rate of Max-Riserx3 the daily production rate of Stuff Itx4 the daily production rate of Zoomx5 the daily production rate of Sprintx6 the daily production rate of Rocketz 18x1 23x2 22x3 20x4 18x5 19x6 ,where z the amount of profit Pallas Sport Shoe Company earns per day.Lead Authors: Thomas Edwards and Kenneth ChelstPage 133
Chapter 3Analyzing Optimal Solutions—Sensitivity AnalysisConstraintsSubject to:Stamping (min):Upper Finishing (min):Insole Stitching (min):Molding (min):Sole-to-Upper Joining (min):Inspecting (min):Non-Negativity (#):1.25 x13.5 x12 x15.5 x17.5 x12 x1x1 2 x2 1.5 x3 1.75 x4 1x5 3.75 x2 5 x3 3 x4 4 x5 3.25 x2 2.75 x3 2.25 x4 3 x5 6 x2 7 x3 6.5 x4 8 x5 7.25 x2 6 x3 7 x4 6.75 x5 3 x2 2 x3 3 x4 2 x5,x2,x3,x4,x5 ,1.25 x64.25 x62.5 x65 x66.5 x63 x6x6ddddddt4201, 2608402,1002,1008400This formulation as it appears in a spreadsheet is presented in Figure 3.3.1. Solver has been run,and the optimal solution also appears in the spreadsheet.Figure 3.3.1: Pallas Sport Shoes Spreadsheet Formulation and Optimal Solution3.3.2 Interpreting the SolutionQ1.Without referring to an Answer or Sensitivity Report, which of the constraints in thespreadsheet in Figure 3.3.1 are binding and which are non-binding? How do you know?Q2.Similarly, which one of the constraints will show a Shadow Price of zero in theSensitivity Report, and why does that make sense?Sue Painter has seen the Answer and Sensitivity Reports. She wonders, “How do I go aboutimplementing this optimal solution?” In order to answer this question, the production managermust understand what the optimal solution means.Q3.The optimal solution given in the spreadsheet from Figure 3.3.1 lists x1 0. What doesthat mean? What does it mean that x2 4.2829?Lead Authors: Thomas Edwards and Kenneth ChelstPage 134
Chapter 3Analyzing Optimal Solutions—Sensitivity AnalysisRecalling that the decision variables in the problem were defined as daily production rates, x2 4.2829means that on most days, 4 Max-Riser shoes will be produced. Then, approximately everyfourth day, 5 Max-Riser shoes will be produced. This production plan would yield 4.25 MaxRiser shoes every four days.Similarly, a daily production rate for x3 45.1217 means that on most days 45 will be produced,but on about every eighth day, 46 will be produced. This production plan would yield 45.125Stuff It shoes every eight days.Q4.How might the production rate of 72.3275 for product x4 be implemented?So, in order to implement the optimal production plan, the production manager will have toallocate production resources in such a way that the optimal production rates are achieved.Figure 3.3.2 shows the Sensitivity Report for the optimal solution to the Pallas Sport Shoeproblem. The production manager notices that it reports an Allowable Increase of about 0.0507in the coefficient of x1 in the objective function.Figure 3.3.2: Sensitivity Report for the Pallas Sport Shoe problemQ5.Suppose Pallas Shoes was able to increase the profit margin on x1 to 18.05. Would thischange affect the optimal solution? Why or why not?Q6.Suppose Pallas Shoes was able to increase the profitability of x1 to 18.10. What wouldbe the effect on the optimal solution of this increase?3.3.3 Using the Sensitivity Report to Make DecisionsPallas Shoes is considering adding an hour of overtime to one of the workers. Sue Painter mustdecide to which of the production tasks the overtime should go.Lead Authors: Thomas Edwards and Kenneth ChelstPage 135
Chapter 3Q7.Analyzing Optimal Solutions—Sensitivity AnalysisUsing the Sensitivity Report in Figure 3.3.2 to guide the decision, to which of the sixproduction tasks should the extra time be added? Why?Suppose that the union contract mandates that any overtime work be paid at double the normalrate of 28 per hour.Q8.Would it be profitable to add to one hour of overtime? If so, how much larger than thecost of the overtime would the increase in profits be? If not, at what hourly pay ratewould it be profitable?Finally, the managers at Pallas Sport Shoes are considering adding another line of shoes. Thedata for the new Pro-Go model is shown in Table 3.3.2.Pro-GoProfit 20Stamping1.5Upper Finishing3.9Insole Stitching2.6Molding6.3Sole-to-Upper Joining6.8Inspecting2.5Table 3.3.2: Profit and production detail per pair of Pro-Go sport shoesAt present, there are no plans to increase the total amount of time available for each of the sixsteps of production. Figure 3.3.3 contains the new spreadsheet and optimal solution with theinformation for Pro-Go as decision variable x7. Figure 3.3.4 shows the Sensitivity Report.Figure 3.3.3: Formulation with seven decision variablesLead Authors: Thomas Edwards and Kenneth ChelstPage 136
Chapter 3Analyzing Optimal Solutions—Sensitivity AnalysisFigure 3.3.4: Sensitivity Report with seven decision variablesQ9.Why was it not profitable to produce the new product?Q10.How much would its profit margin have to increase to make it profitable enough toproduce?Lead Authors: Thomas Edwards and Kenneth ChelstPage 137
Chapter 3Analyzing Optimal Solutions—Sensitivity AnalysisSection 3.4 Chapter 3 (Sensitivity Analysis) Homework Questions1. Recall in Section 2.1.6. The Computer Flips Junior Achievement Company produces fourmodels. Four JA students do the installation work and each of them works 10 hours perweek. Another student does the testing work and he also works for 10 hours per week.Market research indicates that the combined sales of Simplex and Multiplex cannot exceed20 computers per week, and the com
Chapter 3 Analyzing Optimal Solutions—Sensitivity Analysis Lead Authors: Thomas Edwards and Kenneth Chelst Page 132 Figure 3.2.19b: Sensitivity Report when the profitability of EasyRider boards is 30 When the profitability of the EasyRider board is increased to 30 per board, it becomes