Transcription
Sensitivity Analysis Using SensItAdd-In for Microsoft ExcelContentsHow to Install SensIt.2How to Uninstall or Delete SensIt.2Overview.2Example Problem.3Plot.4Spider.6Tornado.9Tornado Tips .11
Sensit is a sensitivity analysis add-in for Microsoft Excel 5, 95, 97, 98, 2000, and 2001 forWindows and Macintosh. It was written by Mike Middleton of the University of San Franciscoand Jim Smith of Duke University.How to Install SensItHere are three ways to install SensIt:(1) Start Excel, and use Excel’s File Open command to open the SensIt.xla file from floppy orhard drive.(2) Copy the SensIt.xla file to the Excel Library subdirectory of your hard drive. Start Excel, anduse Excel’s Tools Add-Ins command to load and unload SensIt as needed.(3) Copy the SensIt.xla file to the Excel Startup subdirectory of your hard drive, in which casethe file will be opened every time you start Excel.All of SensIt’s functionality, including its built-in help, is a part of the SensIt.xla file. There is noseparate setup file or help file.How to Uninstall or Delete SensIt(A) First, use your file manager to locate SensIt.xla, and delete the file from your hard drive.(B1) If SensIt is listed under Excel's add-in manager and the box is checked, when you start Excelyou'll see "Cannot find ." Click OK. Choose Tools Add-Ins, uncheck the box for SensIt; you'llsee "Cannot find . Delete from list?" Click Yes.(B2) If SensIt is listed under Excel's add-in manager and the box is not checked, start Excel andchoose Tools Add-Ins. Check the box for SensIt; you'll see "Cannot find . Delete from list?"Click Yes.OverviewTo run SensIt, start Excel and open the SensIt.xla file. Alternatively, install SensIt using one ofthe methods described above. SensIt adds a Sensitivity Analysis command to the Tools menu.The Sensitivity Analysis command has four subcommands: Plot, Spider, Tornado, and Help.Before using the SensIt options, you must have a spreadsheet model with one or more inputs andan output. All three SensIt options make it easy for you to see how sensitive the output is tochanges in the inputs.Use SensIt’s Plot option to see how your model’s output depends on changes in a single inputvariable.2
Use SensIt’s Spider option to see how your model’s output depends on the same percentagechanges for each of the model’s input variables.Use SensIt’s Tornado option to see how your model’s output depends on ranges you specify foreach of the model’s input variables.Example ProblemModel t Model For Eagle AirlinesInput VariablesCharter Price/HourTicket Price/HourHours FlownCapacity of Scheduled FlightsProportion of Chartered FlightsOperating Cost/HourInsuranceIntermediate CalculationsTotal RevenueTotal CostPerformance MeasureAnnual ProfitCInput Cells 325 10080050%0.5 245 20,000 230,000 216,000 14,000Adapted from Bob Clemen's textbook,Making Hard Decisions, 2nd ed., Duxbury (1996).Model FormulasA1112131415161718BIntermediate CalculationsTotal RevenueTotal Cost (B8*B6*B4) ((1-B8)*B6*B5*B7*5) (B6*B9) B10Performance MeasureAnnual Profit B13-B143
PlotUse SensIt’s Plot option to see how your model’s output depends on changes in a single inputvariable.PLOT INPUT VARIABLEPlot Input Variable’s Cells: Option: In the Label edit box, type a cell reference, or point to the cellcontaining a text label and click. Required: In the Cell edit box, type a cell reference, or point tothe cell containing a numeric value that’s an input to your model.PLOT OUTPUT VARIABLEPlot Output Variable’s Cells: Option: In the Label edit box, type a cell reference, or point to thecell containing a text label and click. Required: In the Cell edit box, type a cell reference, or pointto the cell containing a formula that’s the output of your model.PLOT INPUT VALUESPlot Input Values: Type numbers in the Start, Step, and Stop edit boxes to specify values to beused in the input variable’s cell. Cell references are not allowed.Send Output To: Select the destination for the output table and chart. If you send output to ThisWorksheet, enter a Cell reference for the top left corner of the output. Output options are notavailable on the Macintosh; output is always sent to a new worksheet.Click OK: SensIt Plot uses the Start, Step, and Stop values to prepare a table of values. Eachvalue is copied to the input variable cell, the worksheet is recalculated, and the value of the outputvariable cell is copied to the table. (You could do this manually using the Edit Fill Series andData Table commands.) SensIt Plot uses the input and output values to prepare an XY (Scatter)chart; optionally, the text in the label cells you identified are used as the chart’s axis labels. (Youcould do this manually using the ChartWizard.)4
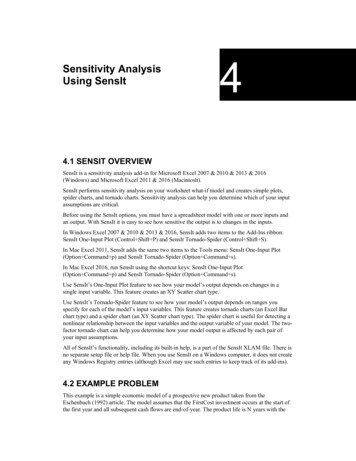
SensIt Plot Dialog BoxSensIt Plot Numerical and Chart OutputSensitivity Analysis .SensIt - Sensitivity Analysis - PlotAnnual ProfitInputOutputCapacity of Scheduled Flights Annual Profit40%- 6,00042%- 2,00044% 2,00046% 6,00048% 10,00050% 14,00052% 18,00054% 22,00056% 26,00058% 30,00060% 34,000 30,000 20,000 10,000 0- 10,00040%45%50%55%Capacity of Scheduled Flights560%
SpiderUse SensIt’s Spider option to see how your model’s output depends on the same percentagechanges for each of the model’s input variables. Before using Spider, arrange your model inputcells in adjacent cells in a single column, arrange corresponding labels in adjacent cells in a singlecolumn, and be sure your model’s input cells contain base case values.For example, if your model has five inputs, the names of the five inputs could be text in A1:A5.The input cells of your model could be numbers in B1:B5; when you change a number in one ofthese cells, the output of your model changes; enter base case values in the input cells B1:B5before using Spider.SPIDER INPUT VARIABLESSpider Input Variables’ Ranges: Labels edit box: Type a range reference, or point to the range(click and drag) containing text labels. Cells edit box: Type a range reference, or point to therange containing numeric values that are inputs to your model. Each range must be adjacent cellsin a single column.SPIDER OUTPUT VARIABLESpider Output Variable’s Cells: Label edit box: Type a cell reference, or point to the cellcontaining a text label and click. Cell edit box: Type a cell reference, or point to the cellcontaining a formula that’s the output of your model.SPIDER INPUT CHANGESSpider Input Changes (%): Type numbers in the Start (%), Step (%), and Stop (%) edit boxes todefine the percents that will be multiplied times the current value in each input variable’s cell.Cell references are not allowed.Send Output To: Select the destination for the output table and chart. If you send output to ThisWorksheet, enter a Cell reference for the top left corner of the output. Output options are notavailable on the Macintosh; output is always sent to a new worksheet.Click OK: SensIt Spider uses the Start (%), Step (%), and Stop (%) values and the original (basecase) numeric value in each input variable cell to prepare a table of percentage change inputvalues. For each input variable, all other input values are set at their base case values, eachpercentage change input value is copied to the input variable cell, the worksheet is recalculated,and the value of the output variable cell is copied to the table. The output variable values are alsoexpressed as percentage change of the base case output value. SensIt Spider prepares two XY(Scatter) charts; the horizontal axis is percentage change of input variables; the vertical axis ismodel output value on one chart and percentage change of model output value on the other; theinput variables’ labels are used for chart legends.6
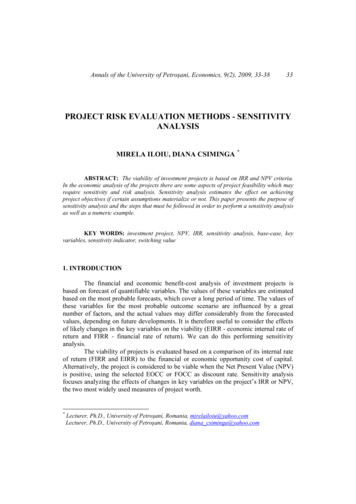
SensIt Spider Dialog BoxSensIt Spider Numerical Output1234567891011121314151617181920AInput Variables ValuesBCDEF80% 260 8064040%0.4 196 16,00090% 293 9072045%0.45 221 18,000100% 325 10080050%0.5 245 20,000110% 358 11088055%0.55 270 22,000120% 390 12096060%0.6 294 24,000Output Variable Values (Annual Profit)80%Charter Price/Hour- 12,000Ticket Price/Hour- 6,000Hours Flown 7,200Scheduled Capacity- 6,000Chartered Proportion 8,000Operating Cost/Hour 53,200Insurance 18,00090% 1,000 4,000 10,600 4,000 11,000 33,600 16,000100% 14,000 14,000 14,000 14,000 14,000 14,000 14,000110% 27,000 24,000 17,400 24,000 17,000- 5,600 12,000120% 40,000 34,000 20,800 34,000 20,000- 25,200 10,000Charter Price/HourTicket Price/HourHours FlownCapacity of Scheduled FlightsProportion of Chartered FlightsOperating Cost/HourInsurance7
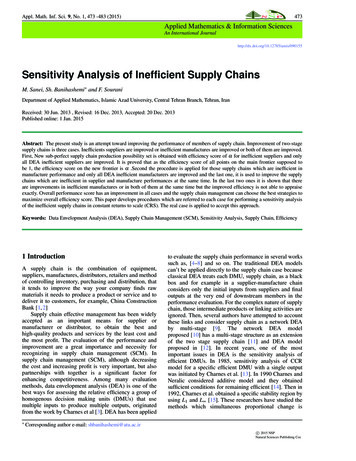
SensIt Spider Chart OutputAnnual Profit ValueCharter Price/HourSensit - Sensitivity Analysis - SpiderTicket Price/Hour 60,000 50,000 40,000 30,000 20,000 10,000 0- 10,000- 20,000 76808488929610101011111212- 30,000 % % % % % % 0 4 8 2 6 0 4%% % % % % %% Change in Input ValueHours FlownCapacity ofScheduled FlightsProportion ofChartered FlightsOperatingCost/HourSensIt Spider Chart Output After FormattingSensit - Sensitivity Analysis - Spider 60,000 50,000Annual Profit Value 40,000Charter Price/Hour 30,000Ticket Price/HourHours Flown 20,000Scheduled Capacity 10,000 075%- 10,000Chartered ProportionOperating Cost/Hour80%85%90%95% 100% 105% 110% 115% 120% 125%- 20,000- 30,000% Change in Input Value8Insurance
TornadoUse SensIt’s Tornado option to see how your model’s output depends on ranges you specify foreach of the model’s input variables. Before using Tornado, arrange your model input cells inadjacent cells in a single column, arrange corresponding labels in adjacent cells in a singlecolumn, and arrange Low, Base, and High input values for each input variable in three separatecolumns. Alternatively, the three columns containing input values can be worst case, likely case,and best case.For example, if your model has five inputs, the names of the five inputs could be text in A1:A5.The input cells of your model could be numbers in B1:B5; when you change a number in one ofthese cells, the output of your model changes. The Low input values could be numbers in D1:D5,chosen as the min imum possible value you think each input variable could be. The Base inputvalues could be numbers in E1:E5, chosen as the most likely value for each input; you might alsohave these same numbers in B1:B5 as current inputs to your model. The High input values couldbe numbers in F1:F5, chosen as the maximum possible value you think each input variable couldbe.TORNADO INPUT VARIABLESTornado Input Variables’ Ranges: Labels edit box: Type a range reference, or point to the range(click and drag) containing text labels. Cells edit box: Type a range reference, or point to therange containing numeric values that are inputs to your model. Each range must be adjacent cellsin a single column.TORNADO OUTPUT VARIABLETornado Output Variable’s Cells: Label edit box: Type a cell reference, or point to the cellcontaining a text label and click. Cell edit box: Type a cell reference, or point to the cellcontaining a formula that’s the output of your model.TORNADO INPUT VALUESTornado Input Values’ Ranges: In the Low, Base, and High edit boxes, type a range reference, orpoint to the range (click and drag) containing numeric values for each of your model’s inputs.Send Output To: Select the destination for the output table and chart. If you send output to ThisWorksheet, enter a Cell reference for the top left corner of the output. Output options are notavailable on the Macintosh; output is always sent to a new worksheet.Click OK: For each input variable, SensIt Tornado sets all other input values at their Base casevalues, copies the Low input value to the input variable cell, recalculates the worksheet, andcopies the value of the output variable cell to the table; the steps are repeated using each Highinput value. For each input variable, SensIt Tornado computes the range of the output variablevalues, sorts the table from largest range down to smallest range, and prepares a bar chart.9
Example with Lower and Upper Bounds1234567891011121314151617181920ABSpreadsheet Model For Eagle AirlinesInput VariablesCharter Price/HourTicket Price/HourHours FlownCapacity of Scheduled FlightsProportion of Chartered FlightsOperating Cost/HourInsuranceIntermediate CalculationsTotal RevenueTotal CostPerformance MeasureAnnual ProfitCInput Cells 325 10080050%0.5 245 20,000DEFLower Bound Base Value Upper Bound 300 325 350 95 100 108500800100040%50%60%0.450.50.7 230 245 260 18,000 20,000 25,000 230,000 216,000 14,000Adapted from Bob Clemen's textbook,Making Hard Decisions, 2nd ed., Duxbury (1996).SensIt Tornado Dialog Box10
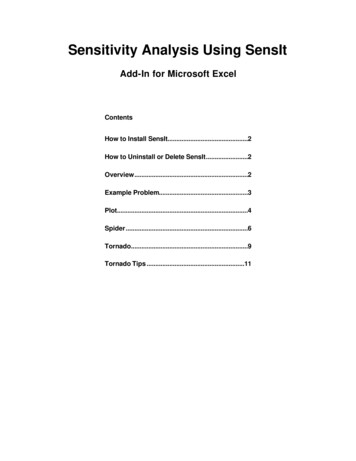
SensIt Tornado Numerical and Chart 7282930313233ATornado Analysis .BInput VariableCapacity of Scheduled FlightsOperating Cost/HourHours FlownCharter Price/HourProportion of Chartered FlightsTicket Price/HourInsuranceCLow40% 230500 3000.45 95 18,000DEFInput ValuesBaseHigh50%60% 245 2608001000 325 3500.50.7 100 108 20,000 25,000GHIOutput Values (Annual Profit)LowBaseHigh- 6,000 14,000 34,000 26,000 14,000 2,000 1,250 14,000 22,500 4,000 14,000 24,000 11,000 14,000 26,000 9,000 14,000 22,000 16,000 14,000 9,000JKPercentSwing Variance 40,00046.1% 24,00016.6% 21,25013.0% 20,00011.5% 15,0006.5% 13,0004.9% 7,0001.4%SensIt - Sensitivity Analysis - TornadoCapacity of Scheduled Flights40%Operating Cost/Hour60% 260Hours Flown 230500Charter Price/Hour1000 300 350Proportion of Chartered Flights0.45Ticket Price/Hour 95Insurance 25,000- 15,000- 5,000 5,0000.7 108 18,000 15,000 25,000 35,000Annual ProfitTornado TipsWhen defining the high and low cases for each variable, it is important to be consistent so that the"high" cases are all equally high and the "low" cases are equally low. For example, you mighttake all of the base case values to be estimates of the mean of the input variable, take low cases tobe values such there is a 1-in-10 chance of the variable being below this amount, and take thehigh cases to be values such that there is a 1-in-10 chance of the variable being above thisamount. Alternatively, you may specify low and high values that are the absolute lowest andhighest possible values.When you click OK, SensIt sets all of the input variables to their base-case values and records theoutput value. Then SensIt goes through each of the input variables one at a time, plugs the lowcase value into the input cell, and records the value in the output cell. It then repeats the processfor the high case. For each substitution, all input values are kept at their base-case values exceptfor the single input value that is setn at it low or high value. SensIt then produces a spreadsheetthat lists the numerical results as shown in columns F, G, and H above.In the worksheet, the variables are sorted by their "swing" -- the absolute value of the differencebetween the output values in the low and high cases. "Swing" serves as a rough measure of theimpact of each input variable. The rows of numerical output are sorted from highest swing at thetop down to lowest swing at the bottom. Then SensIt creates a bar chart of the sorted data.11
"Percent variance" is a standardized measure of impact: it squares each swing, sums them up toget a "Total Variance", and reports the percentage of the "total variance" attributed to each inputvariable.In general, you should focus your modeling efforts on those variables with the greatest impact onthe value measure.If your model has input variables that are discrete or categorical, you should create multipletornado charts using different base case values of that input variable. For example, if your modelhas an input variable "Government Regulation" that has possible values 0 (zero) or 1, the low andhigh values will be 0 and 1, but you should run one tornado chart with base case 0 and anothertornado chart with base case 1.Copyright 2001 by Michael R. MiddletonDecision Support Services2105 Buchanan Street, #1San Francisco, CA 94115-2339Email: decision@compuserve.comWeb Site: http://www.treeplan.com12Michael R. Middleton, Ph.D.Professor of Decision SciencesSchool of Business and ManagementUniversity of San Francisco2130 Fulton StreetSan Francisco, CA 94117-1045Email: middleton@usfca.eduWeb Site: http://www.usfca.edu/ middleton
To run SensIt, start Excel and open the SensIt.xla file. Alternatively, install SensIt using one of the methods described above. SensIt adds a Sensitivity Analysis command to the Tools menu. The Sensitivity Analysis command has four subcommands: Plot, Spider, Tornado, and Help.