Transcription
IOP PUBLISHINGPHYSICAL BIOLOGYdoi:10.1088/1478-3975/8/1/015002Phys. Biol. 8 (2011) 015002 (14pp)Stochastic dynamics of cancer initiationJasmine Foo1 , Kevin Leder1 and Franziska Michor2Department of Biostatistics and Computational Biology, Dana-Farber Cancer Institute, Boston,MA 02115, USAandDepartment of Biostatistics, Harvard School of Public Health, Boston, MA 02115, USAE-mail: michor@jimmy.harvard.eduReceived 16 August 2010Accepted for publication 2 November 2010Published 7 February 2011Online at stacks.iop.org/PhysBio/8/015002AbstractMost human cancer types result from the accumulation of multiple genetic and epigeneticalterations in a single cell. Once the first change (or changes) have arisen, tumorigenesis isinitiated and the subsequent emergence of additional alterations drives progression to moreaggressive and ultimately invasive phenotypes. Elucidation of the dynamics of cancerinitiation is of importance for an understanding of tumor evolution and cancer incidence data.In this paper, we develop a novel mathematical framework to study the processes of cancerinitiation. Cells at risk of accumulating oncogenic mutations are organized into smallcompartments of cells and proliferate according to a stochastic process. During each celldivision, an (epi)genetic alteration may arise which leads to a random fitness change, drawnfrom a probability distribution. Cancer is initiated when a cell gains a fitness sufficiently highto escape from the homeostatic mechanisms of the cell compartment. To investigate cancerinitiation during a human lifetime, a ‘race’ between this fitness process and the aging processof the patient is considered; the latter is modeled as a second stochastic Markov process in anaging dimension. This model allows us to investigate the dynamics of cancer initiation and itsdependence on the mutational fitness distribution. Our framework also provides amethodology to assess the effects of different life expectancy distributions on lifetime cancerincidence. We apply this methodology to colorectal tumorigenesis while considering lifeexpectancy data of the US population to inform the dynamics of the aging process. We studyhow the probability of cancer initiation prior to death, the time until cancer initiation, and themutational profile of the cancer-initiating cell depends on the shape of the mutational fitnessdistribution and life expectancy of the population.[6]. Some alterations, however, provide the cell with afitness advantage due to increased proliferation capabilities,decreased death, enhanced migration and invasion, or theability to induce angiogenesis [7]. Once a cell has evolveda sufficiently aggressive phenotype, it can escape fromhomeostatic control mechanisms and initiate tumorigenesis[8–14]. During the expansion of this initiated clone, additionalgenetic and/or epigenetic changes are accumulated that drivecancer progression and lead to more malignant and ultimatelyinvasive phenotypes [7].While tumorigenesis has classically been defined as adisease resulting from the accumulation of genetic alterations[15], it is becoming increasingly apparent that epigeneticmodifications are similarly important for the initiation and1. IntroductionTissues of multi-cellular organisms are organized intomorphologically stable compartments or niches [1, 2]. Suchcompartments are made up of separate clones of cells, whichproliferate to fulfill their organ-specific tasks [3, 4]. In healthytissues, compartment sizes are stabilized by homeostaticmechanisms which induce compensatory regulatory responsesvia cellular signaling, apoptosis, and other processes [5].During each cellular replication, a genetic or epigeneticalteration may arise. Many of those changes do not alterthe reproductive fitness of the cell and are selectively neutral12These authors contributed equally to this work.Author to whom any correspondence should be addressed.1478-3975/11/015002 14 33.001 2011 IOP Publishing Ltd Printed in the UK
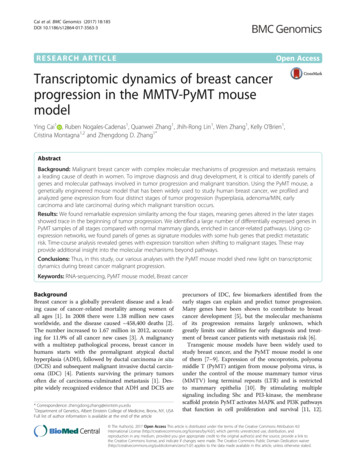
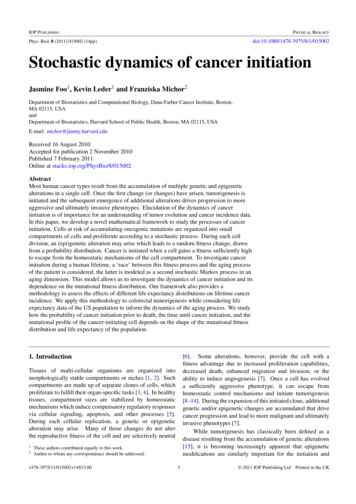
Phys. Biol. 8 (2011) 015002J Foo et alprogression of human cancer [16].Patterns of DNAmethylation and chromatin structure are significantly altered incancer cells and include genome-wide losses of, and regionalgains in, DNA methylation. Aberrant promoter methylation,for instance, is associated with the loss of gene function thatcan provide a selective advantage to tumor cells, as do geneticalterations. For example, the von Hippel–Lindau (VHL) gene,which causes familial renal cancer if mutated in the germ line,is often epigenetically silenced in the sporadic form of thistumor type [17]. Similarly, the breast cancer 1, early onset(BRCA1) and serine/threonine kinase 11 (STK11) genes areoften epigenetically inactivated in sporadic cases of breastand colon cancer, respectively, while they predispose to thesecancer types in carriers of a germ line mutation [18, 19].In addition to gene silencing events that are associated withmethylation changes, methylation patterns can also influencetumorigenesis by other mechanisms; cytosine methylation,for instance, can cause spontaneous hydrolytic deaminationof cytosine and lead to C–T transitions [20]. This enhancedmutagenesis might lead to many gene alterations observed intumors—as many as 50% of inactivating point mutations in thecoding region of the human TP53 tumor suppressor gene insomatic cells occur at methylated cytosines [21]. Epigeneticalterations therefore cannot be neglected in the study of cancer.Due to its importance for an understanding oftumorigenesis, the dynamics of cancer initiation have beenthe subject of several mathematical investigations. Thesestudies considered cancer initiation to occur when a single cellhas accumulated n specific alterations [22–27]. The fitnesseffects of these alterations were assumed to be either neutralor advantageous; the latter was realized as an additive jumpin the growth rate of the mutated cell. Several authors studiedthe situation in which the accumulation of two alterationsis sufficient to initiate tumorigenesis [22–25]; cells wereconsidered to proliferate according to the Moran model in apopulation of fixed size [28]. Later on, scenarios in whichn 2 mutations are necessary for cancer initiation wereinvestigated [26, 27]. These contributions are part of aliterature of mathematical approaches to cancer initiation andprogression [29–51].In this paper, we propose a novel mathematical model ofcancer initiation. Unlike earlier efforts, we do not considerthe situation in which cancer is initiated once a specifiednumber of genetic alterations has been accumulated; rather,cancer initiation occurs as soon as the fitness of a cellpasses a threshold value. Once this threshold is reached,the cell can escape from homeostatic control and initiatesclonal expansion. In particular, we model a mechanismfor the breakdown of homeostasis in a normally fixedsize compartment of cells via the accumulation of randommutational fitness changes emerging during cell replication.The fitness changes conferred by (epi)genetic alterationsare modeled as random variates selected from a mutationalfitness landscape. The fitness threshold necessary for cancerinitiation can then be reached via a large number of mutationseach conferring small fitness changes, a few mutations eachconferring large fitness effects, or a mixture of large andsmall effects. We then investigate the dynamics of cancerinitiation conditioned on the event that initiation occurs priorto death of the patient due to causes other than the cancertype of interest. This conditioning is addressed by addinga second dimension representing an aging process to themodel. This framework is used to determine the probability ofcancer initiation prior to death as well as the expected waitingtime until cancer initiation. Furthermore, we investigate theexpected number of neutral and non-neutral mutations thatare present in the cancer-initiating clone. This quantity is ofclinical interest since it provides insight into the genotype ofthe cancer-initiating cell and thus the genotypic compositionand potentially the drug sensitivity of the resulting tumor.Our mathematical framework sheds light onto the effectsof the shape and characteristics of the mutational fitnesslandscape on the dynamics of cancer initiation, and providesa methodology to assess the consequences of different lifeexpectancy distributions on lifetime cancer incidence and themutational composition of cancer-initiating cells.2. The modelConsider a compartment of N cells that proliferate according toa stochastic Moran process (see the appendix for a discussionof this process) [28, 52]. This compartment consists of thosecells that are at risk of accumulating the (epi)genetic alterationsleading to cancer initiation. If only tissue-specific stem cellslive long enough to accumulate the necessary changes, thenthe population is made up of stem cells [53]; alternatively, thecompartment additionally contains progenitor cells [50, 54].Since healthy tissues are subdivided into small compartmentsof cells [1, 2], N is small. Initially, all cells are unmutatedand have relative fitness 1. The time intervals betweenreproduction events are independent, identically distributedexponential random variables with mean 1/N . During eachreproduction event, one cell is chosen at random to die, andone cell is chosen to reproduce according to its relative fitness.The population size is strictly constant. The probability of aspecific cell being chosen for reproduction during an event isdetermined by the contribution of its fitness to the total fitnessof the population; if there is a single cell of fitness s in apopulation of N 1 cells of fitness 1, then the cell with fitnesss is chosen to reproduce with probability s/[s (N 1)].Here fitness is defined as the relative reproductive success ofcells.Mutational fitness distribution fψ . During each cell divisionevent, an (epi)genetic alteration may occur with probabilityu 1; thus, alterations arise in the compartment ofcells at rate N u.The fitness effects of individualalterations are random variates drawn from a probabilitydistribution, fψ , which represents a mutational fitnesslandscape. This distribution fψ may be state-dependentand thus vary according to the fitness of the parent cell(e.g. fψx is dependent on the fitness x of the parent cell).Figure 1 shows a schematic of this process for a stateindependent distribution fψ . This flexible framework allowsus to study the effects of mutational fitness landscapes on thedynamics of cancer initiation.2
Phys. Biol. 8 (2011) 015002J Foo et alnon-neutral mutation reaches fixation in the compartment, andtakes values in the space of all possible fitness values dictatedby the fitness landscape. By equation (1), this process closelyapproximates the behavior of cellular fitness values in a smallcompartment for the vast majority of time. Note that byfocusing on the times when the process is homogeneous, thestate space of the system is significantly reduced, thus allowingfor more feasible computational analysis.Consider the fitness values a and b, for some 0 a b,such that a compartment of cells remains in a homeostatic statefor fitnesses within the range [a, b]; thus, Z(t) [a, b] for alltimes t. Once a cell in the compartment gains a fitness greaterthan the threshold b, it escapes from homeostasis and cancer isinitiated. The fitness value a is defined as a reflecting boundaryfor Z; any cell with fitness below a is immediately replaced bya cell with fitness a. For computational purposes, we considerthe process Z living on a discretized state space on the range[a, b]. Since we consider a homeostatic cell compartmentbefore initiation of tumorigenesis, a natural choice for theparameters is a 1 1/N and b 1 1/N since thesevalues signify the boundaries for neutral evolution [56].Let us now consider in detail the dynamics of Z in fitnessspace. We introduce the mutation kernel M(·, ·), where M(x,y) represents the probability that a cell with fitness x producesa daughter cell with fitness y (i.e. M(x, y) fψx (y x)). Ify x, then the fitness of the daughter cell is advantageousas compared to the fitness of its parent cell; if y x, it isdisadvantageous, and if y x, it is neutral. Since neutralmutations are allowed to occur, M(x, x) can be non-zero. Ifa single cell of fitness y arises in a population of N 1 cellsof fitness x, the probability that the cell with fitness y reachesfixation in the population is given by1 x/y.(2)ρx,y 1 (x/y)NThis expression is called the fixation probability and caneasily be found by first step analysis. By symmetry, we haveρx,x 1/N . The intensity matrix for the Markov process Z isthen defined asFigure 1. A schematic representation of the stochastic processgoverning cellular fitness. We consider a population of N cellsresiding in a compartment or niche of fixed size. These cellsreplicate according to a stochastic Moran process. During eachelementary time step of the process, a cell is chosen at randomproportional to fitness to divide and its offspring replaces anotherrandomly chosen cell. During each cell division, a genetic orepigenetic alteration arises with probability u. Each alteration mayconfer a random additive fitness change to the cell. The parent cell,on the left, thus gives rise to a daughter cell with the same fitness, x,with probability 1 u (upper right). With probability u, the parentcell produces a mutated offspring with fitness x ψ, where ψ is arandom additive fitness change selected according to the mutationalfitness distribution fψ (lower right). If a cell within thecompartment gains a sufficiently large fitness value, thentumorigenesis is initiated.Dynamics in fitness space. Suppose the population consistsof two types of cells at time t 0: N 1 normal cells andone cell carrying a single mutation. Define the waiting timeuntil a cell in this population accumulates a second mutationas Tmut and the time until homogenization (i.e. until the cellcarrying the mutation reaches zero or 100% frequency in thepopulation) as Thom . Then we haveP (Tmut Thom ) 3N u(log N γ ),(1)Q(x, y) N uρx,y M(x, y),where γ is the Euler–Mascheroni constant. In other words, if3Nu(log N γ ) 0, a cell harboring a mutation is far morelikely to reach fixation in the compartment or die out beforea second mutation arises. See the appendix for the proofof equation (1). Therefore, when u 1/N 2 , the periodsof time during which the compartment is not homogeneouscomprise a negligible amount of time. As the population sizeand/or the mutation rate increase during tumor progression,more complex dynamics emerge [55]; this scenario, however,is likely not applicable to situations of cancer initiation sincein healthy tissues, compartment sizes and mutation rates aresmall. For the parameter ranges of interest for the studyof cancer initiation, a cell compartment is almost alwayshomogeneous.Based on these considerations, the process describingthe evolution of fitness values in a compartment of cellsis approximated by a Markov process Z(·), where Z(t)represents the fitness of the homogeneous compartment attime t. The process Z jumps whenever a cell harboring a novelfor y b. This expression becomes Q(x, y) N uM(x, y)when y b. The reflecting behavior at the lower boundaryis realized through the mutation kernel M. By definition, wehave Q(x, y).Q(x, x) y xSince the process stops as soon as one cell gains a fitness valuegreater than b, the states x b are absorbing, so Q(x, y) 0for all y and x b. The summation is over all y in the discretefitness space.Modeling the lifetime of a patient. The Moran modeldynamics described by the coarse-grained process Z representthe change in the fitness values of cells in the compartmentover time. In order to model the dynamics of cancer initiationduring a human lifetime, a ‘race’ between this fitness processZ and the aging process of the patient is considered. To this3
Phys. Biol. 8 (2011) 015002J Foo et alGamma distribution provides a good qualitative approximationfor the lifetime distribution of a population. When modelingthe fraction of people that survive longer than x years viaP (G x), where G is a Gamma(81,1) random variable, thenthis tail probability stays relatively flat until around 68 years,at which point it begins a sharp decay toward zero.In summary, we have designed a model of cancer initiationduring a human lifetime using a two-dimensional Markovprocess. The first dimension of this process, Z, representsthe fitness of cells at risk of accumulating the mutationsinitiating tumorigenesis; these cells are organized into smallcompartments or niches of a constant size. The seconddimension L represents the aging process of a patient. The stateof the process Z is governed by the more detailed dynamicsof a Moran process at the cellular level, and the process Lis chosen so that its absorption time, which has a phase-typedistribution φ, matches mortality data. This model has severalparameters: the mutation rate u, the lifetime distributionφ(t), the number of cells in the compartment N, and themutational fitness distribution fψ . This model is then usedto determine the dynamics of the event that cancer initiationoccurs prior to death, i.e. that the right boundary of Z is reached(corresponding to one cell reaching a fitness value greater thanor equal to the boundary value a) prior to absorption in theL-direction. Figure 2 shows a diagram of this process and twopossible sample paths. All paths initiate at (Z 1, L 1)and sample path (1) demonstrates a trajectory in which cancerinitiation occurs prior to death; such paths, however, compriseonly a fraction of all possible outcomes. Sample path (2)visualizes a trajectory in which death occurs prior to cancerinitiation. Note that cancer initiation is not equivalent todiagnosis of the disease, so that the initiation statistics cannotbe compared to cancer incidence data.Figure 2. Sample path simulations of the two-dimensionalstochastic process. We consider a stochastic process governing theevolution of fitness values of cells within the compartment (seefigure 1) coupled with a stochastic process representing aging anddeath of the patient. The figure shows two sample path simulationsof this two-dimensional process. The fitness of cells within thecompartment is shown on the horizontal axis, and the lifetime of thepatient is displayed on the vertical axis. If the trajectory hits theright boundary before reaching the upper border, then cancerinitiation occurs before death of the patient (sample path (1)); if thetrajectory hits the top boundary before reaching the right border,then death occurs before cancer initiation (sample path (2)). Thefitness values bounding the area of interest are dictated by thecutoffs for neutral evolution [56].end, we introduce a second stochastic process, L(t), whichis a continuous-time Markov chain with an absorbing staterepresenting death of the patient. Thus this process, L, hitsthe absorbing state with probability 1 and the first passagetime of this event represents the age of the patient at death.The transition probabilities of this Markov chain can be tunedto match mortality data for the population of interest. Wefit the dynamics of the process L to qualitatively describe thecurrent life expectancy in the United States [57].To address a similar problem, Liu and Lin [58] utilized aCoxian phase-type distribution to construct an aging processto fit life expectancy data. We follow a simplified versionof this approach and define L to be a Coxian process withd states. In particular, the process L(t) is initialized atstate 1 and takes values in the state space {1, . . . , d}. IfL(t) d, it jumps monodirectionally to state 1 atrate 1, and the final state d is an absorbing state. The timefor the process to hit the absorbing state is described by aGamma(d 1, 1) distribution. The transition intensity matrixfor this process is (S)i,j Si,j , which satisfies Si,i Si,i 1and is constant along the diagonal. Let us denote this valuealong the main diagonal by S instead of unity, since changingthe diagonal allows for flexibility in the choice of time scaleswith respect to the replication rate of cells in the compartment.Figure 2 shows that death of a patient occurs when the processL makes d 1 upward steps; note that the time between eachstep is an exponential random variable with mean 1. The3. AnalysisThe stochastic model outlined above is used to determineseveral quantities: (i) the probability of cancer initiation priorto the time of death; (ii) the waiting time until cancer initiationprior to death, and (iii) the expected number of neutral andnon-neutral mutations present in the cancer-initiating cell,conditional to cancer initiation occurring before death. Theestimates for these quantities are obtained in the form of thesolution to simple linear systems in order to keep the analysisapplicable to general mutation kernels M. These estimates arelater used to study the effect of the mutation kernel and oflifetime distributions on the dynamics of cancer initiation.3.1. The probability of cancer initiation prior to deathFor a given state in the two-dimensional space (x, r), let I(x,r) denote the probability of Z(t) reaching a fitness valueabove b (i.e. initiating cancer) before L(t) reaches theabsorbing state d (i.e. death), starting from the initial conditionZ(0) x, L(0) r. For the process Z, there can be atransition of the form x y, and for the process L(t), therecan be a transition of the form r s. Thus when the current4
Phys. Biol. 8 (2011) 015002J Foo et al(x, r), conditioned on initiation prior to death: w(x, r) E(x,r) [τ τ σ ]. Then we have P̃Z (x, y r)w(r, y) P̃L (r, s x)w(x, s)w(x, r) state of the two processes is (x, r), then, the next jump v hasthe following probability distribution:N uρx,y M(x, y) . PZ (x, y r), Q(x, x) SS. PL (r, s x),P (v (0, s r)) Q(x, x) SP (v (y x, 0)) y3.3. The number of neutral mutations in the cancer-initiatingcellAn accurate understanding of the genomic composition of thecell that leads to clonal expansion and cancer initiation mayaid in the identification of drug targets. Furthermore, it helpsto elucidate the distribution of advantageous and passenger(selectively neutral) mutations in cancer. Let us first considerthe number of neutral mutations that have been accumulated inthe compartment before cancer is initiated. Denote the numberof neutral mutations present in the compartment at time t bym(t). Next we compute the functionsWe also have the boundary conditions I (x, d) 0 for allx [a, b] and I (b, r) 1 for r [0, d). This linear systemcan easily be solved to obtain I(x, r). Cancer initiation isthen defined as the event that the fitness of one cell reachesa 1 1/N before death of the patient; the probabilityof initiation prior to death is pi I (1, 1). The transitionprobabilities for the compound process (Z, L) conditionedupon initiation prior to death are given byI (y, r).P̃Z (x, y r) PZ (x, y r)I (x, r)(4)I (x, s).P̃L (r, s x) PL (r, s x)I (x, r)(5)μ(x, r) E(x,r) [m(τ ) τ σ ] .3.2. The waiting time until cancer initiationLet τ represent the time of cancer initiation and σ the time atwhich the process L is absorbed, i.e. the patient dies. Denotethe time until the first jump of the process (Z, L) by T1 . Thenwe have S Q(x, x).E(x,r) [θ T1 ] E(x,r) [θ T1 τ σ ] S Q(x, x) log θThis result is important because of the following:η(x, r) uM(x, x).uM(x, x) Q(x, x) SThe top of the fraction represents the rate at which neutralmutations which eventually reach fixation arise within thecompartment, and the bottom of the fraction represents thetotal rate at which fixating mutations arrive and the timeprocess changes. With this definition, Yj (x, r) is distributedlike a geometric random variable withE(x,r) [θ τ (Z(T1 ), L(T1 )) (y, r)] E(x,r) [θ T1 ]E(y,r) [θ τ ].This expression results from the independence of the durationof the first jump time and all subsequent jump times. Thegenerating function for the conditioned initiation time startingfrom the state (x, r) is defined asP(Yj (x, r) n) η(x, r)n (1 η(x, r)) ,which gives(6)E[Yj (x, r)] Then, performing first step analysis, we obtain the linearsystemη(x, r).1 η(x, r)By conditioning on the first step, we obtain that μ(·, ·) satisfiesthe following linear system for each possible fitness x in [a, b]: η(x, r)μ(x, r) P̃Z (x, y r)μ(y, r)(1 η(x, r))y P̃L (r, s x)μ(x, s). S Q(x, x)G(x, r, θ ) S Q(x, x) log θ P̃Z (x, y r)G(y, r, θ ) P̃L (r, s x)G(x, s, θ ) .y(8)Thus, μ represents the number of neutral mutationsaccumulated in the cancer-initiating cell conditional to cancerinitiation occurring before death of the patient.Between jumps of the two-dimensional process (Z, L), arandom number of neutral mutations can reach fixation withinthe compartment of cells. Let Tj and Tj 1 be the jump timesof (Z, L), and for simplicity denote (Z(Tj ), L(Tj )) Xj .During the transition from Xj to Xj 1 , the compartment canaccumulate Yj (Xj ) neutral mutations. DefineandG(x, r, θ ) E(x,r) [θ τ τ σ ].(7)with boundary condition w(b, r) 0.for any y x in the fitness space and any s {1, . . . , d},s r.By first step analysis, we obtain a linear system that theprobabilities I(x, r) satisfy: I (x, r) I (y, r)PZ (x, y r) I (x, s)PL (r, s x). (3)ys1 Q(x, x) SsThe boundary condition is G(b, r, θ ) 1.We perform a simpler calculation to determine the meanwaiting time until cancer initiation. Define w(x, r) to bethe expected time until initiation starting from the statesNote that μ(x, r) 0 for those fitnesses that lie outside of[a, b]. Therefore μ(·, ·) can be determined by solving thelinear system above.5
Phys. Biol. 8 (2011) 015002J Foo et althe probability of cancer initiation prior to death from anycrypt becomes approximately 1 exp[ pi Ncrypts ], and theaverage number of crypts containing cancer-initiating cellsemerging prior to death is Ncrypts pi . Note that if piis of order 10 6 or greater, the probability of having atleast one cancer-initiated crypt before death is 1. If piis on the order of 10 8 or less, the probability of havingat least one such crypt before death is much less than 1.Unfortunately no data are available on the frequency ofcancer-initiated crypts in the population since these crypts aregenerally too small to be detected by routine colonoscopies, butslightly larger growths—adenomatous polyps—are observedin approximately 50% of people above age 70 [63–65]. Thesestatistics can be used to guide parameter choices for themutational fitness distribution.For the purpose of our mathematical model, we considera compartment size of N 10 colonic stem cells and astem cell division frequency of approximately once per week[66, 67]. The overall mutation rate—giving rise to neutral,advantageous or deleterious mutations—is about u 0.001per cell division, since there are 3 109 base pairs in thehuman genome and the per base pair mutation rate is about10 11 –10 12 [68]. There are no estimates for the shape ofthe mutational fitness distribution for human colonic epithelialcells. Therefore, to investigate the dependence of the dynamicsof cancer initiation on the mutational fitness distribution fψ ,we construct a general family of fitness distributions with amode at zero. For simplicity, assume that the mutational fitnessdistribution is state independent: fψ fψx . The general formof the mutational distribution is then given by3.4. The number of non-neutral mutations in thecancer-initiating cellLet us next determine the mean number of advantageous anddisadvantageous mutations in the initiating cell. Let n(t) be thenumber of non-neutral mutations present in the compartmentof cells at time t. Then, the number of non-neutral mutationsat initiation is given byν(x, r) E(x,r) [n(τ ) τ σ ],where ν(x, r) satisfies the system P̃Z (x, y r) (ν(y, r) 1) P̃L (r, s x)ν(x, s)ν(x, r) y xswith boundary condition ν(b, r) 0. The expected numberof advantageous or disadvantageous mutations present can beobtained in a similar fashion. For example, by defining na (t)to be the number of advantageous mutations present at time t,the number of advantageous mutations present at initiation isgiven byνa (x, r) E(x,r) [na (τ ) τ σ ],and νa (x, r) satisfies the linear system P̃Z (x, y r) (νa (y, r) 1)νa (x, r) y xy xP̃Z (x, y r)νa (y, r) P̃L (r, s x)νa (x, s),(9)swhere the boundary condition is again νa (b, r) 0.4. Application of the model to colorectal cancerinitiationP (ψ k ) cα k ,Let us now apply this mathematical framework to colorectalcancer as a specific example. Colorectal tumors progressthrough four distinct clinical stages: dysplastic crypts,small benign tumors, malignant tumors invading surroundingtissues, and finally metastatic cancer [11]. This progressionis driven by the accumulation of several genetic changes [59].Mutations of the adenomatous polyposis coli (APC) gene areconsidered the earliest and most prevalent genetic changes incolorectal tumorigenesis [11]; other important contributors aremutations in the KRAS and TP53 genes [11]. Colonic tumorsarise from the rapidly proliferating epithelium of the colon.This epithelium is organized into Ncrypts 107 compartmentsof cells called crypts [60]. Each crypt contains about 1000–4000 cells. Approximately 4–10 of those cells are stem cells,residing at the base of each crypt [4, 61]. The progeny of stemcells migrate up the crypt, continuing to divide until they reachits mid-portion. Then they stop dividing and differentiate intomature cells. When the cells reach the top of the crypt, theyundergo apoptosis and are engulfed by stromal cells or shedinto the gut lumen. The cell migration from the base to the topof the crypt takes about 3–6 days [62].To study the probability of cance
carrying the mutation reaches zero or 100% frequency in the population) as T hom. Then we have P(T mut T hom) 3Nu(logN γ), (1) where γ is the Euler-Mascheroni constant. In other words, if 3Nu(logN γ) 0, a cell harboring a mutation is far more likely to reach fixation in the compartment or die out before a second mutation arises.