Transcription
Cai et al. BMC Genomics (2017) 18:185DOI 10.1186/s12864-017-3563-3RESEARCH ARTICLEOpen AccessTranscriptomic dynamics of breast cancerprogression in the MMTV-PyMT mousemodelYing Cai1 , Ruben Nogales-Cadenas1, Quanwei Zhang1, Jhih-Rong Lin1, Wen Zhang1, Kelly O’Brien1,Cristina Montagna1,2 and Zhengdong D. Zhang1*AbstractBackground: Malignant breast cancer with complex molecular mechanisms of progression and metastasis remainsa leading cause of death in women. To improve diagnosis and drug development, it is critical to identify panels ofgenes and molecular pathways involved in tumor progression and malignant transition. Using the PyMT mouse, agenetically engineered mouse model that has been widely used to study human breast cancer, we profiled andanalyzed gene expression from four distinct stages of tumor progression (hyperplasia, adenoma/MIN, earlycarcinoma and late carcinoma) during which malignant transition occurs.Results: We found remarkable expression similarity among the four stages, meaning genes altered in the later stagesshowed trace in the beginning of tumor progression. We identified a large number of differentially expressed genes inPyMT samples of all stages compared with normal mammary glands, enriched in cancer-related pathways. Using coexpression networks, we found panels of genes as signature modules with some hub genes that predict metastaticrisk. Time-course analysis revealed genes with expression transition when shifting to malignant stages. These mayprovide additional insight into the molecular mechanisms beyond pathways.Conclusions: Thus, in this study, our various analyses with the PyMT mouse model shed new light on transcriptomicdynamics during breast cancer malignant progression.Keywords: RNA-sequencing, PyMT mouse model, Breast cancerBackgroundBreast cancer is a globally prevalent disease and a leading cause of cancer-related mortality among women ofall ages [1]. In 2008 there were 1.38 million new casesworldwide, and the disease caused 458,400 deaths [2].The number increased to 1.67 million in 2012, accounting for 11.9% of all cancer new cases [3]. A malignancywith a multistep pathological process, breast cancer inhumans starts with the premalignant atypical ductalhyperplasia (ADH), followed by ductal carcinoma in situ(DCIS) and subsequent malignant invasive ductal carcinoma (IDC) [4]. Patients surviving the primary tumorsoften die of carcinoma-culminated metastasis [1]. Despite widely recognized evidence that ADH and DCIS are* Correspondence: zhengdong.zhang@eisntein.yu.edu1Department of Genetics, Albert Einstein College of Medicine, Bronx, NY, USAFull list of author information is available at the end of the articleprecursors of IDC, few biomarkers identified from theearly stages can explain and predict tumor progression.Many genes have been shown to contribute to breastcancer development [5], but the molecular mechanismsof its progression remains largely unknown, whichgreatly limits our abilities for early diagnosis and treatment of breast cancer patients with metastasis risk [6].Transgenic mouse models have been widely used tostudy breast cancer, and the PyMT mouse model is oneof them [7–9]. Expression of the oncoprotein, polyomamiddle T (PyMT) antigen from mouse polyoma virus, isunder the control of the mouse mammary tumor virus(MMTV) long terminal repeats (LTR) and is restrictedto mammary epithelia [10]. By stimulating multiplesignaling including Shc and PI3-kinase, the membranescaffold protein PyMT activates MAPK and PI3K pathwaysthat function in cell proliferation and survival [11, 12]. The Author(s). 2017 Open Access This article is distributed under the terms of the Creative Commons Attribution 4.0International License (http://creativecommons.org/licenses/by/4.0/), which permits unrestricted use, distribution, andreproduction in any medium, provided you give appropriate credit to the original author(s) and the source, provide a link tothe Creative Commons license, and indicate if changes were made. The Creative Commons Public Domain Dedication o/1.0/) applies to the data made available in this article, unless otherwise stated.
Cai et al. BMC Genomics (2017) 18:185Sharing both morphological and transcriptional featureswith the human disease [10] and resembling the humanluminal B subtype of breast cancer on gene expression profiles [9], the MMTV-PyMT transgenic mice provide us areliable animal model for breast cancer progression. Theprimary tumors developed in this mouse model go throughfour stereotypical stages of cancer progression –hyperplasia, adenoma/mammary intraepithelial neoplasia (MIN), early and late carcinoma – while progressfrom pre-malignancy to malignancy.Because most previous studies of PyMT mice focusedonly on the carcinoma stages, little is known about geneexpression alterations in the early stages as well as theirimpacts to the later stages. In this study, we examinedgene expression dynamics in the full range of breasttumor development from hyperplasia to late carcinoma.Using RNA sequencing instead of microarray, our datahad a wider dynamic range and a higher sensitivity tobetter detect differentially or lowly expressed genes.Moreover, to go beyond single gene inspected by earlierstudies, we explored biological networks to learn theconnections and interplays among genes. Networks arepowerful in interpreting the underlying mechanisms ofdiseases by revealing disease modules, which are groupsof highly connected genes or gene products [13]. In thisstudy, we carried out differential gene expression profiling, time-course analysis and network-based genescreening to identify candidate genes that may contribute to breast cancer progression. We found that manygenes differentially expressed in the late carcinoma stageinitiated the expression alteration at the hyperplasiastage. We also identified genes with disrupted expressionduring the transition from premalignance to malignance.Last, we found gene modules that co-expressed in tumors with hub genes predict future metastasis. Thus, byproposing novel candidate oncogenes that may promotetumor progression and malignant transition, our studyhelps to find genes as potential biomarkers and drug targets for breast cancer treatment.MethodsAnimals and tissue collectionThis study of cancer in mice was approved by the Institutional Animal Care and Use Committee (IACUC) ofAlbert Einstein College of Medicine. All proceduresinvolving mice were conducted in accordance with theNational Institutes of Health guidelines concerning theuse and care of experimental animals. Male PyMT mice(FVB/N-Tg(MMTV-PyVT)634Mul/J mice, Stock Number:002374, the Jackson Laboratory) were randomly bred withhomozygous FVB females to obtain F1 female mice(PyMT mice hereafter) heterozygous for the PyMT transgene; they developed breast cancer and were used as cases.Homozygous FVB females were used as controls.Page 2 of 14We selected four time points corresponding to differenttumor progression stages: hyperplasia at week 6, adenoma/MIN at week 8, early carcinoma at week 10, and latecarcinoma at week 12 [10]. At each time point, mammarytumors and normal mammary glands were collected fromthree PyMT mice and three age-matched FVB controls,respectively. We snap froze all samples and kept them at–80 C. We had a pathologist examined the morphology ofour PyMT tumor samples and observed typical features ofvarious tumor developmental stages (Additional file 1:Figure S1A). We also estimated the percentage of infiltrating cells as the sample purity. By H&E staining, the pathology report showed less than 5% stromal and musclecells, with rare inflammatory cells in carcinoma samples.In general, we had greater than 90% tumor cells in ourcarcinoma samples, which surpassed the Cancer GenomeAtlas (TCGA) criteria (over 60% tumor cells for humantumor samples) [14, 15].Directional RNA sequencingTotal RNAs were extracted from frozen samples using themiRNeasy mini kit (Qiagen) according to the manufacturer’s protocol. Agilent 2100 Bioanalyzer was used tocheck RNA quality. The total RNA was treated with DNaseI, depleted of ribosomal RNA with Ribo-Zero MagneticGold Kit (Epicentre), followed by ethanol precipitation.Next, RNA was converted to cDNA using SuperScript IIIFirst-Strand Synthesis Kit (Invitrogen) with 80ng randomhexamers and 50mM oligo-dT and subsequently ethanolprecipitated. Single-stranded cDNA was converted todsDNA by DNA polymerase I while incorporating dU/VTPs (10mM). Samples were fragmented to 200–300bpusing Covaris. After fragmentation, samples were purifiedusing the MinElute PCR purification kit (Qiagen). Fragmented samples underwent standard end-repair, dA-tailingand adapter ligation using Illumina TruSeq adapters formultiplexing. Adapter-ligated cDNA was treated withuracil-DNA glycosylase followed by enrichment PCR usingKapa reagents for 14 cycles. Libraries were size selected for150–600 bp on a 2% low-melt ultra low-range agarose gelstained with SYBR Gold (Invitrogen) to eliminate adaptordimers. Purified libraries were used to sequence onHiseq2500 according to standard protocols. The PyMTRNA-sequencing data is available in the Gene ExpressionOmnibus (GEO) database as GSE76772.Statistical analysisSequence data were preprocessed by WASP 3.0 [16], anin-house pipeline. FastQC [17] was used for reads qualitycontrol. The raw FASTQ files were trimmed for adaptersequences using quart. Then GSNAP v2012-07-02 [18]was used to align reads to mm9 reference genome withdefault settings. Gene counts were given by HTSeqv0.5.3p3 [19].
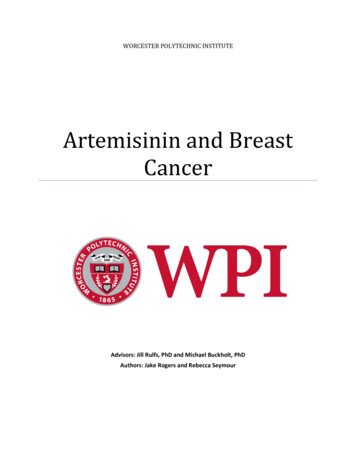
Cai et al. BMC Genomics (2017) 18:185All statistical analyses were carried out with R v3.0.1[20]. After removing transcriptionally inactive genes(read count per million 1 in more than half of the samples) from raw RNA-sequencing gene counts, we gothigh confident gene counts, which were then normalizedby DESeq [21]. The PCA analysis used method adoptedfrom DESeq. The R package edgeR v3.4.2 [22] was used toperform statistical analysis on gene counts and to detectdifferentially expressed genes. Differentially expressedgenes (DEGs) at each stage were analyzed for enrichmenton REACTOME [23] and KEGG [24] pathways using theR package GOseq [25], which corrects bias owing to genelength and expression variability. To reduce noise and redundancy, we used GSEA (Gene Set Enrichment Analysis)[26] to investigate hallmark gene sets (“Hallmark gene setssummarize and represent specific well-defined biologicalstates or processes and display coherent expression”, asdefined by GSEA).Weighted gene co-expression network analysisWe conducted the weighted gene co-expression networkanalysis (WGCNA) using the R package WGCNA [27] toidentify co-expressed genes. We used the normalized expression values from aforementioned analysis as input toconstruct a signed gene co-expression network. Then welooked at module preservation to find the most robustand generalized modules using a composite Z-summarystatistic. For highly preserved modules, we calculated themodule eigengene (the first principal component). Labelsthat denote the disease stages (normal, hyperplasia,adenoma/MIN, early carcinoma and late carcinoma) werepermuted. We permuted the labels 10,000 times, and usedan R package coin to test the statistical significance ofSpearman’s correlation coefficient between tumor progression stages and module eigengenes. The results wereexported to VisANT [28] for network visualization.Time-course data analysisTo model the transitional changes in gene expression,we calculated a log2 ratio change (LRC) of each gene between stages i 1 and i using results from the previousDEGs analysis: LRC log2R(i 1) – log2R(i) (i 1, 2, 3;stage 1 as hyperplasia). After normalizing LRCs to zscores, we categorized the transitional changes into positive ( 1), negative (–1), and constant (0) transition statuses by their deviance from the mean. Since there arethree transitions and three transition statuses, altogetherwe have 33 27 possible groups of transition patterns.To find gene expression trends along tumor progression, we selected the top 1,000 genes with highest PCAloadings, and divided the means of normalized expression at week 8, 10 and 12 by that of week 6 to get relative expression ratios. We then used k-means clusteringto group genes based on the ratio. We plotted thePage 3 of 14number of clusters against the total within cluster SS(sums of squares) and selected the cluster value at thefirst inflection point, which is 5.Quantitative real-time PCR (qPCR)The qPCR was performed using the 2 ΔΔCt method. TheRNA was converted to cDNA using SuperScript IIIFirst-Strand Synthesis Kit (Invitrogen), followed by reactions using ABI StepOnePlus Real-Time PCR System instrument (Applied Biosystems). Each 10μl reactionincluded 5μl Taqman Fast Master Mix, 2.5μl RNAse-freewater, 2μl cDNA (10 nM) and 0.5μl Taqman primer set.Actb was used as the internal control gene to give genestested a relative fold change using the 2 ΔΔCt method.The qPCR primers are by Taqman Gene Expression Assays, catalog number 4448892.ResultsDifferentially expressed genes are enriched in cancerrelated pathways and E2F targetsTo determine the transcriptional distinction among different cancer developmental stages, we first performed PCAanalysis (Methods). The PyMT tumor samples are clearlyseparated from the FVB controls on PC1. There is also atemporal separation among the PyMT samples from various stages except for one adenoma/MIN sample (Fig. 1a,Additional file 1: Figure S1B). In Fig. 1b, we showed contributions to PCs from different biological and technicalconditions as covariates; it is clear that only biologicalcontribute to PCs, but not the technical ones. Diseasecondition and stage strongly contribute to PC1, mouseage contributes to PC3, and litter slightly contributes toPC2. This means that the variance separating PyMT tumors from FVB controls was the underlying biological factors, not the technical ones such as batch effect. Inaddition, we examined genes with top loadings on PC1and found that only Fhl1 and Txnip are cell cycle-relatedgenes. This means that the difference we observed wasmainly due to something other than cell cycle.We then examined differentially expressed genes(DEGs) at each stage. At each time point (week 6, 8, 10and 12), we compared three PyMT samples with threeFBV controls (Methods), and identified 2,070, 2,269,2,489, and 3,476 DEGs respectively (fold change 2, FDR 0.05, Table 1 and Additional file 2: Table S1). The laststage (late carcinoma) had the most DEGs and was with abig increase on the DEG number comparing to all otherstages. We also found that more genes were downregulated than up-regulated ((1,430, 1,486, 1,609, 2,205)vs. (640, 783, 880, 1,271) DEGs at each stage (Table 1).Among the union of all 4391 DEGs, a significant proportion of DEGs (27.2%, 1,211 genes) appeared at all fourstages (Fig. 1c). This is consistent with a previous humanstudy, which showed that gene expression in ADH, DCIS,
Cai et al. BMC Genomics (2017) 18:185Page 4 of 14Fig. 1 Differentially expressed genes along tumor progression. a PCA of PyMT and FVB samples. It shows the separation between tumor andcontrol samples. b Biological and technical confounders’ contribution to PCs. The heatmap shows –log10 p-value of linear regression of top PCson some known covariates. Red indicates significant correlation. The disease status, whether it is tumor or control, contributes most significantlyto PC1 and PC2. No technical covariates exhibited correlation to any PCs. Plotted with the ggplot2 R package [80]. c Venn diagram of DEGs. Amajority of the DEGs at each one of the four time points were also detected in at least one another time point. d Mean expression of 79 E2Ftargeted DEGs at four stages. The red line denotes PyMT tumors, and the blue line controls. The normalized gene counts were plotted with theerror bar showing the standard deviation. 79 targets were differentially expressed in late carcinoma stage (week 12). H, hyperplasia; N, adenoma/MIN; EC, early carcinoma; and LC, late carcinomaand IDC are highly similar during tumor progression [4].Yet, metastatic risk could be predicted based on geneexpression profile of primary carcinoma [29, 30]. Amongthese 4,391 key genes, 92 genes were among the 289breast cancer-related genes identified by MalaCards [5].We then analyzed REACTOME, KEGG, and GSEAhallmark enrichment (Methods) of the DEGs identifiedat each stage. Of the KEGG pathways, the extracellularmatrix (ECM) receptor interaction (KEGG:04512) andmetabolic pathways (KEGG:01100) were enriched in the
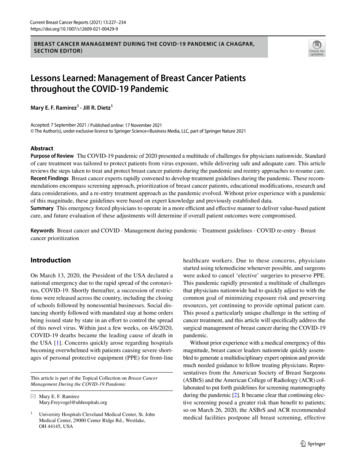
Cai et al. BMC Genomics (2017) 18:185Page 5 of 14Table 1 Differentially expressed genes at four a/MIN14867832269Early carcinoma16098802489Late carcinoma220512713476Union264217494391Note: Numbers of DEGs identified at the four stagesdown-regulated DEGs; DNA-replication (KEGG: 03030)and cell cycle (KEGG: 04110) in the up-regulated DEGs(Fig. 2a). Of the REACTOME pathways, metabolism andextracellular matrix related terms were also enriched inthe down-regulated DEGs; the up-regulated DEGs wereenriched on cell cycle and DNA methylation (Additionalfile 3: Figure S2). Of the GSEA hallmarks, we uncoveredenrichment on the E2F targets, G2M checkpoint,MTORC1 signaling in the up-regulated genes (Fig. 2b).We are mostly interested in the E2F targets because thetranscription factors E2Fs mediate G1/S transition in cellcycles [31] and regulate tumor development and metastasis as indicated by an early study using the PyMT mice[32]. Interestingly, E2F2 was differentially expressed onlyin hyperplasia stage with an increase of 3.7 fold (FDR 0.05) but not in other stages; the E2F targets enrichmentwas more significant in the later three stages, indicatinga possible time lag for the transcription factors to function. We found 79 E2F targets as DEGs from week 12;their differential expression was much higher in thePyMT mice than in controls and this difference maintained throughout tumor progression (Fig. 1d). ManyE2F targets showed a gradual reduction from week 6 toweek 12 in both groups, suggesting a higher activationof development in early life, while some others maintained the high expression in PyMT mice, such asFig. 2 Pathway enrichment analysis. a KEGG enrichment of DEGs at four stages. b GSEA-hallmark enrichment. The top 10 terms with the mostsignificant FDR at each stage were plotted. H: hyperplasia, N: adenoma/MIN, EC: early carcinoma, LC: late carcinoma. Color represents –log10 ofFDR or over represented p-value, dot size represents the number of DEGs in each KEGG or hallmark term
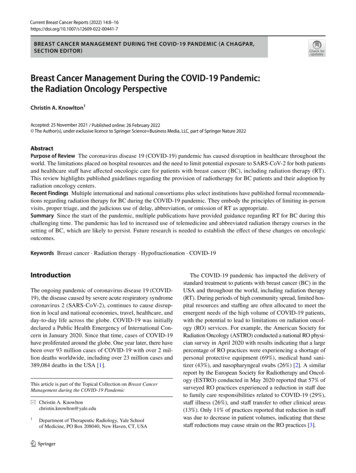
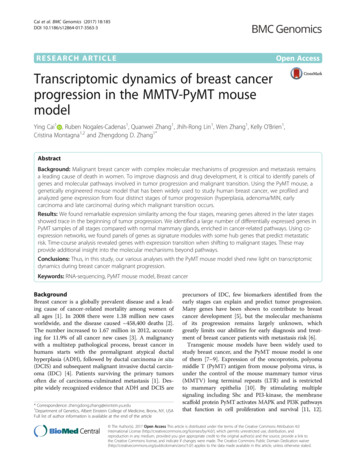
Cai et al. BMC Genomics (2017) 18:185Dnmt1, Diaph3, and Prdx4 (Fig. 1d). Their functionalroles in processes other than cell cycles could also beimportant for tumor progression.We found genes in P53 signaling pathway with increased expression at early carcinoma stage (Fig. 2a), forexample Rrm2, which functions in DNA repair and damage prevention. Rrm2 encodes a ribonucleotide reductase and was reported as an indicator of tamoxifenresistant in luminal patients as well as decreased survivalin patients of all breast cancer subtypes [33]. In ourstudy, the expression of Rrm2 increased throughout thebreast cancer development in PyMT mice (log2 foldchange in hyperplasia, adenoma/MIN, early carcinoma,late carcinoma is 2.5, 4.0, 2.7, and 2.8, respectively) andmay serve as potential biomarker for diagnosis as well asdrug target.In addition to terms related to cell cycle and proliferation, we also observed other significant enrichment suchas PPAR (peroxisome proliferator-activated receptor)signaling (KEGG:03320) and drug metabolism- cytochrome P450 (KEGG:00982) (Fig. 2b). In late carcinoma,Page 6 of 14Pparg was among the 26 down-regulated PPAR pathwaygenes (Cd36, Sorbs1, Pparg, Angptl4, Lpl, Fabp4, Acox1,Acadm, Me1, Cpt2, Slc27a1, Scp2, Adipoq, Acsl1, Fabp3,Ppara, Plin1, Cyp27a1, Acox3, Pltp, Pck1, Ilk, Aqp7,Rxrg, Cpt1c, and Nr1h3); Cyp2e1 was among the 17down-regulated drug metabolism-related cytochromeP450 genes (Mgst3, Ugt1a9, Adh1c, Fmo1, Gstz1, Aox1,Cyp2e1, Gsta3, Gstt2, Maob, Cyp2d6, Fmo2, Gstm1,Ugt1a5, Ugt1a3, Gstm2, and Aldh3b2).Hub genes from co-expression network modules predictmetastasis in human breast cancer datasetsTo identify genes expressed together as modules on ahigher systems level, we explored coordinated transcriptional activities among genes in co-expression networks toreveal higher-order expression patterns and signatures oftumors. This network-based method is useful to detectpotentially new biomarkers, and complements the identification of individual DEGs. We carried out a weightedgene co-expression network analysis (WGCNA). We firstcalculated Pearson’s correlation coefficients to measureFig. 3 Weighted gene co-expression network analysis (WGCNA). a Module conservation. Modules above red line (Zsummary 10) were highlypreserved, above blue line (Zsummary 2) were moderately preserved. b Co-expression connections in the black module. The connections aresimplified to highlight 6 hub genes (Dnmt1, Tacc3, Ptma, Mcm6, H2afx and Rrm1) with annotation in KEGG pathways. For visualization purpose,only strong connections with topological overlap above a threshold of 0.2 are shown. c Module egigengene trajectories (the first principalcomponent, PC1). Red lines are tumor, blue lines are control. Generally, genes in black module increased expression in tumors, and genesin other modules decreased expression
Cai et al. BMC Genomics (2017) 18:185Page 7 of 14gene-gene co-expression in our mouse samples. Then weused a topological overlap measure algorithm and identified 12 gene modules (Methods). Five of them are highlypreserved (Fig. 3a), i.e., gene-gene co-expression in thesefive modules is similar in both PyMT tumors and controls.Among them, four modules showed significant differencebetween tumors and controls (Methods, Fig. 3b). Pathwayenrichment showed that the modules are enriched withpathways of DNA replication (KEGG: 03030) and cellcycle (KEGG: 04110); focal adhesion (KEGG: 04510) andECM receptor interaction (KEGG:04512); oxidative phosphorylation (KEGG: 00190) and TCA cycle (KEGG:00020), and several metabolic pathways including insulinpathway (KEGG: 04910), respectively (Table 2). Genes inthe black module (Additional file 1: Table S1) are involvedin DNA replication and cell cycle hence may shed light onthe molecular mechanisms of breast cancer in this mousemodel. This module is also enriched with targets of E2Fand targets of MYC (GSEA hallmark). Genes with themost connections (‘hubs’) in a module capture most of theexpression variability and can be considered as the module signature. The top 20 hub genes in the black moduleare Uhrf1, Cct3, Dnmt1, Kif11, Top2a, Ptma, Mcm6, Tpx2,Smc2, Rrm1, Mki67, Tacc3, Ncapd2, Prc1, H2afx,Hist2h2bb, Hist1h1d, Npm1, Hist1h3c, and Hist1h2bb(Fig. 3c). Nine genes in this module – Akt1, Brca2, Ccnd1,Dnmt1, Mki67, Palb2, Rrm1, Timeless, and Top2a – areknown human breast cancer genes according to the MalaCards database [5]; four of them are hub genes. Not surprisingly, we found an overlap between hub genes andpreviously identified DEGs, including Dnmt1, Top2a,Tacc3, Mcm6, and Mki67.The PyMT mice provide a very aggressive breast cancer model with a metastatic rate of over 90%. We hypothesized that genes whose expressions correlate withtumor progression may mark more aggressive tumorsand thus can be used to predict metastasis risk. To testthis hypothesis and to translate our model-based findings to the human disease, we assessed the impact ofhub genes on distant metastasis-free survival (DMFS)using the Kaplan-Meier analysis by querying the Geneexpression-based Outcome for Breast cancer Online(GOBO) [34]. Based on their high or low expressionlevels, ten hub genes – H2AFX, KIF11, MCM6, MKI67,NCAPD2, PRC1, SMC2, TACC3, TOP2A, TPX2 –separated breast cancer patients into high- and low-riskgroups, which showed statistically significant differencein DMFS (Additional file 4: Figure S3). Using the tengenes together as a panel also gave a significant prediction but showed no increase on predicting power. In thepurple module, among top 15 genes that we selected asmodule hubs, 12 (PEX19, DHDH, ACSL1, ALDH6A1,PNPLA2, PPP2R5A, IVD, MME, ADIPOR2, ALAS1,CDO1, and CHPT1) are non-cell cycle genes and as agene panel can separate patients with different risks byKaplan-Meier analysis (p-value 0.05), while the otherthree cell cycle-related genes (AKT2, INSR, andYWHAG) cannot. Hubs from the other two modelsshowed no significant ability for separation.Note that many hub genes as E2F targets are involvedin tumorigenesis. As an E2F target, Dnmt1 (DNAmethytrasferase 1) showed differential expressionthroughout tumor progression (expression fold changesin PyMT tumors vs. FVB controls during hyperplasia,adenoma/MIN, early carcinoma, and late carcinoma are2.0, 2,5, 2.3, and 3.2 (FDR 0.05), respectively). DNMT1is crucial for the maintenance of DNA methylation,which causes gene silencing and is known to regulatemany cancer-related genes including many tumor suppressors [35, 36]. These gene expression changes suggesta global methylation deregulation and a potential keyrole of DNA methylation in breast cancer. In addition,we have carried out an enhanced reduced representationbisulphite sequencing (ERRBS) of the same PyMTmouse model to examine DNA methylathion changesduring its cancer progression process in another studyto be published. Mki67 (Ki67) is a widely recognizedmarker for cell proliferation and is associated with breastcancer prognosis statistically [37]. Top2a codes for topoisomerase II Alpha, a key enzyme in DNA replicationthat regulates gene expression and cell division andwhose amplification is a predictor for anthracyclinetreatment in breast cancer [38]. Another hub gene Tacc3plays roles in cell cycle, immune system development,and microtubule cytoskeleton organization. An upregulation of Tacc3 was observed in breast cancer and itwas suggested that Tacc3 might be a deregulator ofDNA damage response and a predictor of survival forbreast cancer patients [39]. Mcm6 and Ncapd2 are E2Ftargets as well, and little is known about their roles inTable 2 WGCNA modules with high preservationModuleGenesGO enrichment (FDR 0.05)Green663Mitochondria, membraneOxidative phosphorylation, TCA cycleRed550Extracellular matrix, cell adhesionFocal adhesion, ECM-receptor interactionPurple357Mitochondria, peroxisomeMetabolism pathways, insulin pathwayBlack372Cell cycle, M phase, mitoticDNA replication, cell cycleNote: Gene numbers in each module with GO and KEGG term enrichmentKEGG pathways enrichment (FDR 0.05)
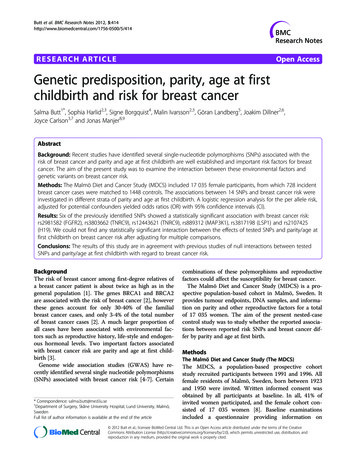
Cai et al. BMC Genomics (2017) 18:185breast tumor progression. Mcm6 is one of the minichromosome maintenance proteins and has been suggested as a prognostic marker in melanoma [40]. In theblack module, we found Mcm2-6 and Mcm9. TheMcm2-7 and Mcm8-9 form protein complexes respectively to function in DNA replication initiation and DNArecombination repair [41, 42]. An early study showed astrong association between the over expression ofMcm2-7 and the short survival in a breast cancer cohort[43] and suggested their roles in breast tumor progression. Here we added an additional layer of evidence.Ncapd2 (non-SMC condensing I complex subunit D2) isinvolved in mitotic sister chromosome segregation [44]without notable involvement in breast cancer. We thinkits alteration may represent elevated cell mitosis in tumors like that of Mki67.The green module showed a slight negative correlationbetween eigengene and tumor progression compared tocontrols. 20 genes from the TCA cycle pathway (Acly,Aco2, Csl, Cs, Dlat, Dlst, Dld, Fh1, Idh2, Idh3a, Idh3b,Idh3g, Mdh1, Ogdh, Pdhb, Pdha1, Sdha, Sdhd, Suclg1, andSucla2) were found in the green module. This enrichmentindicates a significant involvement of energy metabolismin tumor progression. In the purple module, we foundEif4ebp1 with reduced expression in tumor. This gene is aeukaryotic translation initiation factor biding protein thatfunctions in the insulin-signaling pathway. It inhibits theoncogene Eif4e, whose overexpression leads to humanhepatocellular carcinoma development together with Rasactivation [45].Time-course analysis identifies expression patterns oftumor progression and malignant transitionIn PyMT mice, the malignant transition occurs betweenadenoma/MIN (week 8) and early carcinoma (week 10),so we first examined genes that showed fluctuation during this time. We classified the union of all DEGs inweek 8 and week 10 (3,080 genes) into four groupsbased on their up- or down-regulation patterns. 21 genesexhibited up-/down-regulation and 20 genes exhibitedthe opposite down-/up-regulation (Fig. 4a). Genes withsimple expression transition are surprisingly few. As analternative, we defined a type of statistically transition(Methods). Based on their expression profiles, we clustered the union of 4,391 DEGs into 26 groups of transition patterns (because there was no gene showed allpositive transition, left only 26 groups instead of 27groups (Fig. 4b). As defined, most genes (3,116 genes ingroup 2) showed no change for all three transitions. Sincethe malignant transition happens between adenoma/MINand early carcinoma, we were mostly interested in geneswith a peak of either positive or negative change at the second transition. The 193 genes – 113 in group 1 and 80 ingroup 12 (Fig. 4b) – displayed this transition pattern.Page 8 of 14Enrichment (FDR 0.05) revealed KRAS signaling up andestrogen response early (GSEA hallmark); Calcium signaling (KEGG: 04020) in these genes. The GSEA hallmarkE2F targets including Cdk1, Ccnb2, Plk1, Aurkb, and Spag5were also enriched (FDR 0.05) in the group 12. Moreover,we found Erbb4 (log2 fold-change: 0.03, -0.18, 2.39, 2.05) inthe group 12. Erbb4 appears to be an oncogene in breastcancers [
Conclusions: Thus, in this study, our various analyses with the PyMT mouse model shed new light on transcriptomic dynamics during breast cancer malignant progression. Keywords: RNA-sequencing, PyMT mouse model, Breast cancer Background Breast cancer is a globally prevalent disease and a lead-ing cause of cancer-related mortality among women of