Transcription
MEDTRONICTMCARELINKPERSONALGUIDE BOOKMedtronic CareLink Personal softwareEasy to Use, Easy to SharePERSONALISED DIABETES INSIGHTSTO EMPOWER YOUR THERAPY DECISIONS
HOW TO USETHIS GUIDEWELCOMEThis guide book has been producedto enable you to get the most outof CareLinkTM Personal software.Data has shown thatthose who uploadto CareLink software achieve abetter HbA1c thanthose who don’t1,2PERSONALISED DIABETES INSIGHTSTO EMPOWER YOUR THERAPY DECISIONS
GUIDECONTENTSHOW TO USE THIS GUIDEBENEFITS OF CARELINKTMPERSONAL SOFTWARE01REGISTERING YOUR ACCOUNT03INSTALLING THE CARELINKTMPERSONAL UPLOADER04UPLOADING TO CARELINKTMPERSONAL SOFTWARE06GENERATING REPORTS07READING YOUR REPORTS08QUESTIONS AND ANSWERS13
BENEFITS OFCARELINKTM PERSONAL SOFTWAREWHAT ISCARELINK PERSONAL SOFTWARE?CareLink Personal software is a Medtronic web based diabetesdata management platform for patient/carer use at home.It takes all the data from your Medtronic diabetes insulin pumps,continuous glucose monitors and compatible blood glucosemeters and stores it online for your use.WHY USECARELINK PERSONAL SOFTWARE?Abilty to track your personal progress and trends withCareLink software reports.Prepare for and speed up visits with your healthcare teamBack up your settings.Ability to share your data with your healthcare teamwithout going to see them.PERSONALISED DIABETES INSIGHTSTO EMPOWER YOUR THERAPY DECISIONSFIND OUT MOREhttps://carelink.minimed.eu01
YOURCARELINKTM PERSONAL SOFTWARETHIS GUIDEBOOK BELONGS TOMY CARELINKTM PERSONAL SOFTWARE BENEFITSMY CARELINKTM PERSONAL SOFTWARE NOTES02
REGISTERINGYOUR ACCOUNTSIMPLEPROCESSTO REGISTERYOURACCOUNTGo to www.Carelink.minimed.euand click on ‘Create an account’.Select your country andprefered language.2 Confirm your language and country.3 Select ‘Patient’ as your accounttype and click ‘Next’.4 You will be taken through theconsent process and your consentis required for account set up.Please ensure you scroll down tothe bottom of the pages and makeyour selection.5 Please fill in the relevant information in thefields provided. Tip: the password must beat least 8 characters.6 Your enrollment is now complete.
INSTALLING THECARELINKTM PERSONAL UPLOADERIMPROVE YOURDOCTOR VISITSBY UPLOADINGTO CARELINK SOFTWAREUpload regularly.GET STARTED BYDOWNLOADINGTHE NEWUPLOADERINSTALL FILEA one-time download percomputer where you wishto upload your device.Understand yourglucose pattern.§ Log in to CareLinkTM§ Click “How to installUploader” ORClick on the “?” and then“How to install Uploader”.Collaborate with your doctor.Click the download linkand select a location tosave the uploader file.Find the downloadedfile. Open the file andselect “Run”.Click “Next”.Click “Next”.AFTERDOWNLOADING,INSTALL THEUPLOADERChoose your language.§ Make sure your CareLinkTM USB or meterare not plugged in and click “OK”§ Click “Finish” to complete the installation.NOW, YOU’RE READYTO UPLOADReturn to your CareLink Personal softwarehomepage when you are ready to upload datafrom your pump or meter.04
ENSURING A SUCCESSFUL UPLOAD TOCARELINKTM PERSONAL SOFTWARETO ENSURE SUCCESS,GET EVERYTHING READYPlug your CareLinkTM USB ormeter into your computerMY IMPORTANT NOTESAND REMINDERS§ Place your pump as close as possibleto the CareLinkTM USB or meter that isplugged into your computer§ Keep the meter linked with the pumpMake sure your pump isready to uploadCheck that the pump is not onone of these screenso No temp basalso No alarmso No active boluso No low batteryPERSONALISED DIABETES INSIGHTSTO EMPOWER YOUR THERAPY DECISIONS
UPLOADINGYOUR PUMP OR METERClick “Upload now” andwait for uploader screento show.UPLOAD METERA. Select the meter brand if youwant to upload BG meter data only.B. Select meter model.2Click “Add newdevice”if this is yourfirst upload.3Select your devicetype if this is yourfirst upload.UPLOAD PUMPA. Select your pump type.B. Connect link device.C. Click on ‘Next’ to preparedevice for upload.C. Select time range to upload.D. Wait for upload to complete.D. Follow on screen instructionsto prepare device for data upload.E. Upload success.E. Enter your pump serialnumber (first upload only).4If this is not yourfirst upload then selectthe device you wish toupload on the ‘Selectyour device type’ screen.F. Wait for upload to complete.G. Upload success.06
GENERATINGYOUR REPORTSGenerating reports to manage your diabetes is madesimple and accessible with CareLinkTM Personal software.41231Time selection.How many days to look back.3Switch between 30 daysand 90 days view.2Set custom date range.4Click to generate reports.Popup will be shown.To generate your reportsclick on the circles in the topleft of the boxes to selectthe reports you wish to see.When you know which areyour favorites, click the starnext to the report name andthen you can click "SelectFavorites" in the top left toautomatically select allstarred reports.07
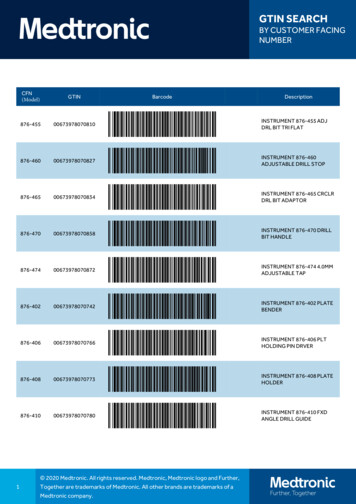
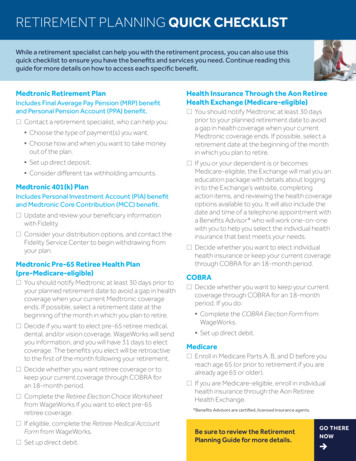
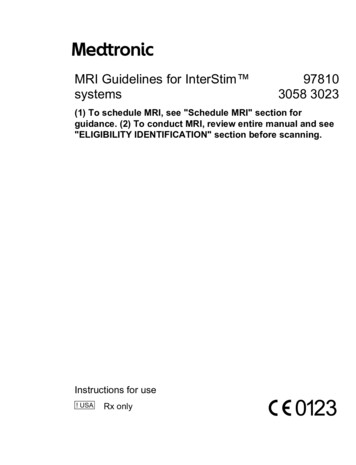
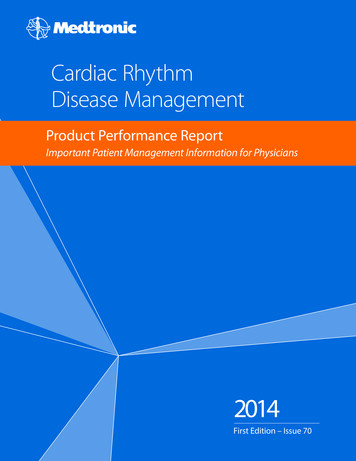
READING YOURGENERATED REPORTSHOW DO I READ MY REPORTS?Reading and understanding the CareLinkTM software reports is animportant aspect of managing your diabetes and improving yourability to make neccessary adjustments. The following reports areexplained in detail, providing you with personalised insights toempower your diabetes therapy decisions.Page 9 - ASSESSMENT & PROGRESS REPORTThis report is a one stop shop for any MiniMed 670G system users.You can see your sensor trace with time in range (TIR) and compare itto how you have done in the past if you wish. You will also be ableto see how long you stayed in Auto Mode, the reasons you cameout of Auto Mode and how often you changed your infusion setand reservoir.Page 10 - WEEKLY REVIEW REPORTThis report generates data from your selected date range.It shows your sensor, insulin delivery and eventsinformation. 7 days are displayed on each page to easilyassess any trends and patterns over the week period.Page 11 - DAILY REVIEW REPORTThis report can help you by showing your selected days in muchmore detail. It can be used to see when you have had Auto Modeexits so that you can identify any patterns and minimise your timein Manual Mode.Page 12 - MEAL BOLUS WIZARD REPORTThis report is designed to help you understand how your mealsand carbohydrate intake can impact your time in range and overallglycemic control. To effectively make use of this report, it isimportant that your preferences for meal times have been setcorrectly. Please see the preferences section if you have not done so.Page 13 - LOG BOOK REPORTThis report shows information on carbohydrate intake, bolusinformation and blood glucose levels day by day and hour byhour. It is in a table instead of a graph if this is how you preferyour information.Page 14 - ADHERENCE REPORTThis report is a quick information table for you to assess yoursensor wear, blood glucose monitoring, bolus details and setchange information. It can be used to see if you haveany behavioral patterns that could be changed.08
ASSESSMENT & PROGRESS REPORTMedtronic CareLink Personal softwareRepresentative patient profile12These are the date ranges of your data. Data A (blue) isyour selected time frame i.e. the past two weeks from thedate of upload. Data B (orange) is your past data i.e. the twoweeks before that to make comparison easy.This graph represents all of your sensor readings over 24hrs(midnight to midnight) the colours remain the same for thedata A or B. The dark shaded areas represent where mostof your SG (sensor glucose) readings fell within that timeperiod. The coloured dotted line represents how far spreadout the rest were. A tighter band means tighter control.The dark dotted line represents your average SG levels fordata A only.4This is your time in range (TIR) data between 4 – 10 mmol/land this can again be compared side by side data A vsdata B so you can easily track any changes.NOTES0956Here you can see all the reasons for Auto Mode exit and howmany times each one happened to you in both data sets.These figures show how long you spent in Auto Mode andManual Mode as well as your average SG value and yourglucose management indicator (GMI). Your GMI may besimilar to your laboratory HbA1c that is taken from yourblood sample but it should not be treated the same asyour lab HbA1c.7This is your blood glucose data. An average value andalso how many times per day you have been calibratingyour sensors.8This is your insulin use data. How much you are usingaltogether, how much is basal and how much is bolus andalso how often you have been changing your infusion setand reservoir.9This section is about your food. It will work out howmany meals per day you are eating and the carbohydrateamounts per day. Your active insulin time is how long yourpump thinks insulin stays active in your body after it hasbeen injected. Consult your healthcare team if you haveany queries about this setting.
WEEKLY REVIEW REPORTMedtronic CareLink Personal softwareRepresentative patient profile12The black boxes indicate periods where your pumpexited Auto Mode. The numbers correspond to the exitreason detail panels in section B.NOTESThis area represents your insulin delivery. Solid pink linesrepresent Manual Mode delivery and the pink shadingrepresents your Auto Mode basal delivery. If you deliver abolus it will be purple with carbohydrate and insulin info.The solid black line is your sensor trace and the smallcircles represent blood glucose values entered. The circlewill be filled black if it was used for a calibration of thesystem. TIP: We recommend calibrating your sensor 3-4times per day.4This report will also show you events such as a setchange or entered exercise periods.10
DAILY REVIEW REPORTMedtronic CareLink Personal softwareRepresentative patient profile111The total insulin delivery for the day and the splitbetween basal and bolus.2Time in range data for that particular day.3An example of a set change – your pump suspends insulindelivery while you change your infusion set and reservoir.TIP: We recommend changing your infusion set andreservoir every 2-3 days.4The orange parts of the graph represent a time when thepump was using SmartGuard insulin suspension to avoidhypoglyceamia.5A break-down of insulin delivery for a bolus. Only availablein Manual Mode.NOTES
MEAL BOLUS WIZARD REPORTMedtronic CareLink Personal software12Breakfast - All BolusesBreakfast - Analyzed MealsObservationsLunch - All BolusesLunch - Analyzed MealsObservationsDinner - Analyzed MealsO3bservationsRepresentative patient profile1All meals for the selected time frame will be displayedin each meal section. For example, if breakfast is set for06:00 to 08:00, all boluses between these two times willhave data displayed in the breakfast section.TIP: Make sure your times are set wide enough toaccommodate different meal times at weekends.2Stats show your carbohydrate ratio for easy review andhow many boluses you are taking. You can also see whatyour current meal time preferences are.NOTESThis section of the report is left blank so if you print yourreport, you have somewhere to take notes.12
LOG BOOK REPORTMedtronic CareLink Personal softwareRepresentative patient profile1Each bolus event corresponds to the time and date takenand contains blood glucose information (red if low, nocolour if in range and orange if above range), carbohydrateentered (in black) and insulin delivered.2These examples allow you to view sudden increases/decreases in carbohydrate intake to help identifyany patterns.This shows a meal time has been set (highlight A) but nomeal bolus was given. The report counts this as a missedmeal and puts in a zigzag line.413Shows an example of a bolus with no carbohydrates.This could be a correction or a manual bolus.NOTES
ADHERENCE REPORTMedtronic CareLink Personal softwareRepresentative patient profile1This lists how many blood glucose tests you havedone each day with an average over the whole timeselection at the bottom per day.2This column shows what duration per day you haveworn a sensor, with a per day average at the bottom.If you have not worn a sensor, this field will be blank.NOTESThese two columns show how many manual bolusesand bolus wizard boluses you have taken/accepted.You should be aiming to use as few manual boluses aspossible. This is further broken down in the next fewcolumns to show if the insulin was given with food orfor a correction and if the bolus wizard was overridden.4This column shows how long per day your pumpwas in suspend and the coloured symbols denotewhat kind of suspend it was.There is a key at thebottom of the report to explain the symbols.5These columns show details on when the pumpregistered reservoir rewinds and cannula fills.You should be aiming to change your infusionset and reservoir every 2-3 days.14
QUESTIONSAND ANSWERSA wide range of questions have been answeredin the FAQ section of the CareLinkTM Personalsoftware website.Please use the link ERSONALISED DIABETES INSIGHTSTO EMPOWER YOUR THERAPY DECISIONS
EUROPEMedtronic International Trading SàrlRoute du Molliau 31Case postaleCH-1131 TolochenazSwitzerlandTel: 41 (0) 21 802 70 00Fax: 41 (0) 21 802 79 00www.medtronic.eu12Shalitin S, et al. Acta Diabetol. 2014; 51(2):247-56Corriveau EA. et al. Pediatric Diabetes 2008: 9(Part II): 360–366Safety Information: CareLink softwareCareLinkTM software is intended for use as a adjunctive tool to help manage diabetesand is NOT intended to be relied upon by itself. For detailed information regarding theinstructions for use, indications, contraindications, warnings, precautions, and potentialadverse events, please consult the device manual. 2020 Medtronic. All rights reserved. Medtronic, Medtronic logo and Further, Togetherare trademarks of Medtronic. All other brands are trademarks of a Medtronic company.UC202009935 EE
CareLink Personal software is a Medtronic web based diabetes data management platform for patient/carer use at home. It takes all the data from your Medtronic diabetes insulin pumps, continuous glucose monitors and compatible blood glucose meters and stores it online for your use.