Transcription
Echo Board Review: TissueDoppler & Strain ImagingSamer Sayyed, MD
Presenter DisclosuresConsultant/Speakers bureausNo DisclosuresResearch fundingNo DisclosuresStockNo -label usesNone
Q1: What signal processing steps are requiredto transform a regular PW Doppler to a highfidelity tissue Doppler signal?A. Turn off high pass filter decrease receiver gain decreasescale Turn on low pass filterB. Turn on high pass filter decrease receiver gain decreasescale Turn off low pass filterC. Turn off high pass filter increase receiver gain increasescale Turn on low pass filterD. Turn on high pass filter increase receiver gain increasescale Turn off low pass filter
Q2: Which of the following statements is mostaccurate regarding Tissue Doppler Imaging(TDI) and Speckle Tracking Echocardiography(STE)A. Unlike pulsed wave TDI, 2D-color TDI measurements are notangle dependent and as such may yield higher velocitiesB. Both STE and TDI methods allow for evaluation oflongitudinal, circumferential, radial, and twist/torsional strainC. It is conventional to report Eulerian strain but LaGrangianStrain rateD. Both STE and TDI methods allow calculation of Strain, StrainRate, Velocity, and Displacement
Q3: Regarding strain measurements bySpeckle tracking echocardiography:A. Lagrangian and Eulerian strain calculations start to divergewhen values drop below 15%B. Strain is first calculated as the spatial derivative ofdisplacement, then strain rate is obtained as the temporalderivative of strainC. Strain rate is first calculated by as the spatial derivative ofvelocity, then strain is obtained by temporal integration ofstrain rateD. When making strain measurements, most processing softwareutilize the peak of the QRS complex as a marker of enddiastole and the midpoint of the T wave as a marker of endsystole
Learning Objectives1. Discuss the basic principles of strain and myocardial deformationimaging2. Describe tissue Doppler imaging (TDI) and speckle trackingechocardiography (STE) techniques and list some of the mainclinical applications for strain imaging3. Explain the relationship between strain, strain rate, velocity, anddisplacement4. Discuss the main technical challenges and barriers to widespreadclinical adoption of strain imaging and relate to the need forstandardization
Strain DeformationStrain Differential displacement of an objectexpressed as % (-ve shortening; ve elongation)
Strain rate rate by which thedeformation occursHigher Strain RateLower Strain RateSame Strain ValueStrain rate Differential velocities of an objectexpressed in s-1 (-ve shortening; ve elongation)
Motion vs. DeformationNo motion & No deformationMotion but No deformationMinimal motion butsignificant deformationMotion & deformationThere can be motion (velocity & displacement)without deformation, but no deformation withoutdifferential motion
LV chamber deformation is determinedby myofiber architectureFiber ArchitectureNormal 15-20% 3D LV myocardial deformation is the resultcomplex electrical and mechanicalinterconnection of all fibers throughout the wall Myocardial fiber arrangement and interaction isintegral to transform linear myocyte strain intoan adequate stroke volumeNormal 53-73%
Cardiac Muscle Fiber OrientationEpicardium [L]Endocardium [R]Journal of Cardiovascular Ultrasound 2011 19 1–6.Fibers in the sub-endocardium are arranged in right-handedhelix, then smoothly transition to a transverse circulararrangement in the midmyocardium and then finally a lefthanded helix in the epicardiumJ Am Soc Echocardiogr. 2007 May ; 20(5): 539–551.Mayo Clin Proc. January 2019;94(1):125-138
Principle myocardial deformationsJACC Cardiovasc Imaging. 2019 Sep;12(9):1849-1863
LV & RV Deformation Mechanics LV systole –ve Longitudinal, –ve Circumferential, & ve Radial strain Differential timing of subendocardial fibers prior to subepicardial fibersand larger radius of the subepicardial fibers contributes to LV Twist Deformation of the interventricular septum (largely controlled by LVfibers) is integral to RV contraction and stroke volume LV deformation causes traction of RV-free wall at its septal insertionpoints RV myocardium consists of deep longitudinal (subendocardial) fibers andsuperficial circumferential (subepicardial) fibers, however key overall RVdeformation involves shortening of the longitudinal fibers during systole RV free wall radial strain is smaller in magnitude compared to LV Currently no evidence of powerful RV twist mechanics Circumferential and radial RV deformation is currently not routinelymeasured due to technological limitations in tracking RV thin wallsand reduced influence on RV function
Spectral Doppler Echocardiography Blood (low density and fast) High Doppler velocity low signal intensity Tissue (high density and slow) Low Doppler velocity high signal intensity
Tissue Doppler – Signal ProcessingTurn off highpass filterHigh pass filter turnedOFF Gain ScaleApplyLow PassFilter**Preferable but notabsolutely necessary
Color (TDI) TissueDoppler Imaging Measures tissue Doppler velocityalong the ultrasound beams whilefiltering out blood/cavity signals Velocity data is acquired in “near-simultaneous” manner over theimaging sector using very low line density, and a higher MultiLine Acquisition (MLA) techniques Tissue velocities are then color coded and superimposed on fullB-mode 2D sector to generate parametric color image in whicheach pixel represents the velocity relative to the transducer Velocity data is utilized for anatomical-guided numerical analysissuch as: Velocity-time curves or Color Anatomical M-Mode
Pulsed-Wave TDI2D Color-coded TDI All measurements are angle dependent an angle of incidence 15degrees would result in 4% underestimation of velocityVS. Excellent temporal resolution ( 100fps) is required during imageacquisition to maintain accuracy High Temporal resolution (250puses/sec) Lower temporal resolution (50-150frames/sec) Measures peak instantaneouslongitudinal velocity from singlesegment Measures regional mean velocities Myocardial velocities higher by 20% compared to color TDI Online analysis of velocity curves Displays velocity curves of specificsegment under interrogation Lower myocardial velocitiescompared to PW TDI Off-line analysis of velocity curves Allows simultaneous comparisonof different segmentsHeart, Lung and Circulation (2015) 24, 224–233
The time to peak s’velocity can bemeasured, andsegmentalheterogeneity canbe ascertainedusing CTDIAdditionally,isovolumiccontraction andrelaxation periodscan be identifiedHeart, Lung and Circulation (2015) 24, 224–233
Septal TD velocities are normally lower than lateral TD velocities TDI-derived myocardial velocities are affected by normal aging There is a decrease in s’ and e’ velocities along with a correspondingincrease in a’ velocity with age
TDI shown to be useful for screening and detectionof subclinical myocardial dysfunction, and forevaluating the efficacy of therapeutic interventionsMarker of disease LV systolic dysfunction Diastolic dysfunction LV dyssynchrony Right ventricular function Atrial functionEvaluation and prognostication of coronary artery diseaseDetection of early myocardial alterations in primary &secondary myocardial disorders Hypertrophic cardiomyopathy Dilated Cardiomyopathy Ischemic cardiomyopathy Constrictive vs. restrictive cardiomyopathy
Color TDIColor Anatomical MMode (CAMM)data displayVelocity-Time CurvesCirculation. 2007;116:2597-2609 Tissue velocity decreases form the LV base to the apex Measuring tissue velocity at a single point relative to thetransducer does not fully capture true myocardial mechanics Tissue velocity may be influenced by cardiac translationalmotion and myocardial tethering
Assessment of myocardial motion& deformation parameters w TDIAll 3 parameters can be derived form 1 velocity dataset
Step 1A series of velocity curves (comprisingisovolumic contraction [IVC], systolic [S]and diastolic [E and A] components) showa velocity gradient along a length of thewallStep 2A regression calculation between adjacenttissue velocity data points along thislength generates the strain rate curveStep 3Integration of the strain rate data is thenused to calculate strainJ Am Coll Cardiol 2006;47:1313–27
Limitations to the derivation ofstrain rate from tissue velocityJ Am Coll Cardiol 2006;47:1313–27
Limitations to the derivation ofstrain rate from tissue velocityWidespread clinical adoption of TDI strain was alsolimited by analysis time and considerable intraobserverand interobserver variabilityJ Am Coll Cardiol 2006;47:1313–27
Acoustic Pattern (Speckle) TrackingVelocity is estimated as a shift of each speckle divided by timebetween successive frames (or multiplied by Frame Rate)2D vector:(Vx, Vy) (dX, dY) * FRImproved signal noise levels, less angle dependency, & freedomto assess strain using regular B-Mode datasets in 2D, ratherthan a single dimension locked along the scan lineAllows assessment of rotationalmechanicsJ Am Coll Cardiol 2006;47:1313–27
Standardized views for Speckle TrackingEchocardiography (STE)GLS (marker of longitudinalfiber shortening) assessed fromthe apical window usingstandard 4CH, 2CH, and 3CHviewsGCS (marker of circumferentialfiber shortening) and GRS(marker of fiber thickening)assessed from the PSAX imagesat basal, mid, and apical levelsRV GLS vs RV FWLS Free wall septal strain ROI septum and free wall,but report RV FWLSEcho Res Pract. 2019 Jun 13;6(3):R87-R98.
LV rotation, twist and torsionHeart 2010;96:716e722Echo Res Pract. 2019 Jun 13;6(3):R87-R98. Rotation of the myocardium around LV long axis is expressed indegrees When viewed from the apex during systole:- The base rotates in a clockwise direction (negative value)- The apex rotates in an anticlockwise direction (positivevalue) Twist ( ) is defined as the difference in apical and basal systolicrotation when viewed from the apex Torsion ( /cm) is calculated as the twist angle divided bydistance between base and apex
Normal 2D STE StrainMayo Clin Proc. January 2019;94(1):125-138
2D STE vs LVEF for assessmentof LV systolic function LV systolic function as measured by EF is result of combined longitudinaland circumferential myofiber shortening GLS reflects longitudinal myofiber shortening, which are most vulnerable tomyocardial disease because of their subendocardial location GCS reflects mid-wall (circumferential) myofiber shortening which aretypically affected in more clinically advanced myocardial disease GCS has greater ( 1.6-fold ) effect on LVEF compared to GLS and maycompensate for reduction in GLS to maintain LVEF Reduced LV cavity size or increased wall thickness reduces the amount oflongitudinal and circumferential shortening required to maintain the LVEF in diseases with concentric remodeling/hypertrophy phenotype, LVEFmay be preserved despite reductions in GLS and GCS In patients with impaired LVEF, GLS and LVEF have a linear relationship In patients with preserved LVEF 50%, GLS and LVEF may exhibit acurvilinear relationship GLS may be more sensitive to detect earlysubclinical myocardial dysfunction before LVEF declines
Potential clinical applicationsTwo-dimensional GLS remains the predominant tool forclinical application because of its ease of use, reproducibility,time efficiency, and simplicity. Currently, GCS and GRS havelimited clinical application and are predominantly researchtools.
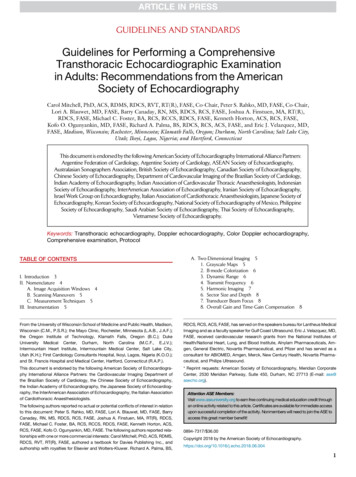
? 219 HFpEF patients fromHFpEF PARAMOUNT trial 50 normal controls 44 pts with HHD but no HFLower LS was modestly associated withhigher NT-proBNP, even afteradjustment for 10 baseline covariatesincluding LVEF, measures of diastolicfunction, and LV filling pressureCompared to both normal controls and hypertensive heart disease patients,the HFpEF patients demonstrated significantly lower longitudinal andcircumferential strainJ Am Coll Cardiol 2014;63:447–56
219 HFpEF patients fromHFpEF PARAMOUNT trial 50 normal controlsStrain imaging detects impaired systolic functiondespite 44 pts withHHD but no HFpreserved global LVEF in HFpEF and that may contribute tothe pathophysiology of the HFpEF syndrome?Lower LS was modestly associated withhigher NT-proBNP, even afteradjustment for 10 baseline covariatesincluding LVEF, measures of diastolicfunction, and LV filling pressureCompared to both normal controls and hypertensive heart disease patients,the HFpEF patients demonstrated significantly lower longitudinal andcircumferential strainJ Am Coll Cardiol 2014;63:447–56
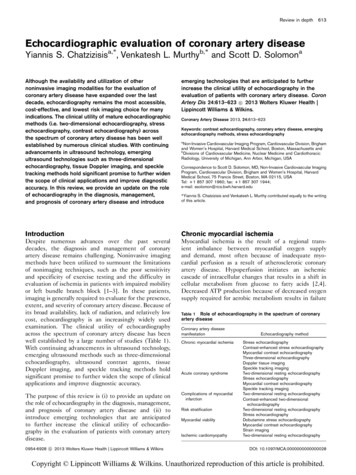
4,172 consecutive pts w acute HF HFrEF, HFmEF, HFpEF Mild, mod, severe GLS5-year all-cause mortalityThe proportion of patients with HFrEF increasedas GLS decreased. Patients with HFrEF had slightly higher mortality than those with HFmEF or HFpEF, whereaspatients with reduced strain had significantly higher mortality In multivariable analysis, each 1% increase in GLS was associated with a 5% decreased risk formortality Patients with moderate and severe GLS reductions had higher mortality, but LVEF wasnot associated with mortalityJ Am Coll Cardiol 2018;71:1947–57
4,172 consecutive pts w acute HF HFrEF, HFmEF, HFpEF Mild, mod, severe GLS5-year all-cause mortalityIn patients with acute HF, GLS has greater prognostic valuethan LVEF. Therefore, the authors suggest that GLS shouldbe considered as the standard measurement in all patientswith HF.The proportion of patients with HFrEF increasedas GLS decreased. Patients with HFrEF had slightly higher mortality than those with HFmEF or HFpEF, whereaspatients with reduced strain had significantly higher mortality In multivariable analysis, each 1% increase in GLS was associated with a 5% decreased risk formortality Patients with moderate and severe GLS reductions had higher mortality, but LVEF wasnot associated with mortalityJ Am Coll Cardiol 2018;71:1947–57
J Am Soc Echocardiogr 2014;27:911-39
Definition of Cancer Therapeutics–RelatedCardiac Dysfunction (CTRCD) 10% absolute reduction in LVEF, to a value 53% (2D Echonormal reference), confirmed by repeated cardiac imaging in2 to 3 weeks. May be symptomatic or asymptomatic.– Reversible: to within 5 percentage points of baseline– Partially reversible: improved by 10% from the nadir but remaining 5% below baseline– Irreversible: improved by 10% from the nadir and remaining 5%below baseline– Indeterminate: patient not available for re-evaluationJ Am Soc Echocardiogr 2014;27:911-39
Echo derived LVEF: Important Considerations 2D techniques have low sensitivity for detection of smallchanges in LV function or subclinical cardiotoxicity– Minimal detectable change is of the same order of magnitude used toadjudicate CTRCD Susceptibility of 2-Dimensional techniques to:– LV geometric assumptions– Inadequate visualization of the true LV apex (aka. foreshortening)– Suboptimal windows– Lack of consideration of subtle regional wall motion abnormalities– Inherent variability of the measurement Load dependent nature of LVEF [(EDV-ESV)/EDV]– Intravascular volume expansion due to IV infusions– Intravascular volume contraction due to vomiting or diarrhea
Pre Chemo6 M into Rx15.4%reductionin peakGLS12 M into RxJ Am Coll Cardiol 2014;63:2751–68
Pre Chemo6 M into RxPotential role of myocardialstrain imaging for:1. Detection of early15.4%myocardial changesreduction2. Prediction of subsequentin peakcardiotoxicityGLS3. Detection of lateconsequences of therapy( 1 year posttreatment)12 M into RxJ Am Coll Cardiol 2014;63:2751–68
Detection of early myocardial changes duringcancer chemotherapy All studies uniformly demonstrate changes in myocardialdeformation prior to the occurrence of a significant change inLVEF and at anthracycline doses lower than what was historicallythought to be cardiotoxic (e.g., 200 mg/m2 of epirubicin). In the absence of a reduction in LVEF, a 9-19% relative decline inpeak GLS from baseline by 2D STE seems to be common eitherduring or immediately after anthracycline therapy Reductions in peak GRS or peak systolic GCS may also indicateearly myocardial changes, however these changes, along with2D STE derived SR have all been less consistent and not wellreproducible. Other deformation parameters are currently neithersufficiently feasible or reliable for clinical application
Prognostic value of myocardial deformationparameters to detect cardiotoxicity An early 10-15% decline in GLS by STE predicts subsequentcardiotoxicity (both asymptomatic & symptomatic LV dysfunction) In two studies where the relative change in GLS was unavailable,absolute abnormal levels of GLS -19% and -20.5% early duringtherapy have been associated with cardiotoxicity GLS thresholds generally have better negative than positivepredictive value, probably reflecting the low prevalence ofcardiotoxicity in the patients studied. GRS was not predictive of cardiotoxicity in the 2 larger studies, andGCS was not predictive in any studies. A combined parameter of (GLS x LV twist) promising to be superioreven to GLS as a predictor of subsequent cardiotoxicity –further studies needed.
Expert consensus for screening & diagnosis of CTRCDJ Am Soc Echocardiogr 2014;27:911-39
Strain sUrveillanceduring Chemotherapy forimproving CardiovascularOutcomes (SUCCOUR)International, multicenter,prospective, ialReview.aspx?id 366020
Patients were followed for EF and development of CTRCD (symptomatic EF reductionof 5% or 10% asymptomatic to 55%) over 1 year
Patients were followed for EF and development of CTRCD (symptomatic EF reductionof 5% or 10% asymptomatic to 55%) over 1 yearLV surveillance with GLS is associated with a: 1) greater use of CPT; 2)higher final LVEF; and 3) lower incidence of CTRCD (with a number neededto treat of 13) although the primary outcome of change in LVEF in bothgroups was similar
Identification of the cause of LVH?Apical sparing?Apical involvement?Lat. wall involvementJAMA Cardiol. 2019;4(3):287-294
Relative apical sparing of GLS inDiagnosis of Cardiac AmyloidosisCardiac AmyloidosisSeptal HCMAortic stenosis with LVHHeart 2012;98:1442e1448.
HCM vs Hypertensive LVHIncreased endo-/epi-myocardial ratios of LSand CS may be useful in differentiating HCMfrom hypertensive LVHEchocardiography. 2019;36:257–265.
HCM vs Hypertensive LVHHypertrophic cardiomyopathy patients had marked reductions inLongitudinal Strain and Circumferential Strain, whereas patients withhypertensive LVH had less reduction in Longitudinal Strain and preservedCircumferential Strain.Increased endo-/epi-myocardial ratios of LSand CS may be useful in differentiating HCMfrom hypertensive LVHEchocardiography. 2019;36:257–265.
Conclusions: Regional variations in strain are easily recognizable, accurate,and reproducible means of differentiating causes of LVH. The detection ofLVH etiology may be a useful clinical application for strain.
LVEF 60%MWT 14.5 mmLVEF 60%MWT 14.5 mmLVEF 63%MWT 14.5 mmJ Am Soc Echocardiogr 2014;27:888-95
LVEF 60%MWT 14.5 mmLVEF 60%MWT 14.5 mmLVEF 63%MWT 14.5 mmJ Am Soc Echocardiogr 2014;27:888-95
Assessment of LV filling in decompensatedHFpEFDyspnea and LE edema in patientwith alcoholic cirrhosis & HTNThe process of pseudonormalization doesnot apply to GLS, strain may be used toaid in recognition and follow up of HFpEFJAMA Cardiol. 2019;4(3):287-294
Technical Challenges andBarriers to Adoption
Lagrangian vs. EulerianStrainJoseph-Louis LagrangeLagrangian strain is the cumulateddeformation, divided by the initiallength:Leonhard EulerEulerian strain is the cumulated ratiosbetween the instantaneous deformationand the instantaneous length:
Need to know and report which of thetwo methods is usedby theanalysisLagrangianvs.Euleriansoftware package for each of Strain &StrainStrainrateThe twoformulas willyield differentresults forStrain &Strain rateCustomary to use Eulerianstrain rate since first strain ratemeasurements by TDIcorrespond to Eulerian SRNote that integrating TDI strainrate to strain, gives Eulerianstrain which needs to bemathematically convertedinto Lagrangian strainCustomary to useLagrangian strain sinceit was original methodused to describemyocardial strain
Influence of temporal resolution onstrain measurementData extrapolated from a high temporal resolution STE image under-sampledat lower frame ratesEuropean Heart Journal - Cardiovascular Imaging (2019) 20, 605–619
Vendor 1Vendor 2VS.Using Out-Of-The Box Settings to derive GLSMean GLS -12.99 /- 2.38% (P .0001) Mean GLS -16.87 /- 2.84%J Am Soc Echocardiogr 2012;25:1189-94
Moderate, butstatistically significantdifferences notedbetween most vendors(P .001)A blue dot indicates significant variance between vendors (ANOVA P 0.05)J Am Soc Echocardiogr 2015;28:1171-81
Intra-observer mean error (%)No significantdifferences wereobserved(P .062)Inter-observer mean error (%)Significantdifferences notedbetween GLS & EFmeasurements aswell as betweensome of thevendors (P .001)A blue dot indicates significant variance between vendors (ANOVA P 0.05)J Am Soc Echocardiogr 2015;28:1171-81
Intra-observer mean error (%)No significantdifferences wereobserved(P .062)Inter-vendor variability in measurement of Peak Systolic GlobalInter-observermeanerror(%)be even less than variability involvedLongitudinalStrainmaynowin measurement of LVEFSignificantdifferences notedbetween GLS & EFmeasurements aswell as betweensome of thevendors (P .001)A blue dot indicates significant variance between vendors (ANOVA P 0.05)J Am Soc Echocardiogr 2015;28:1171-81
Most conventional echocardiographic parameters have a significantly highermeasurement variability than GLSAV (P .001).A blue dot indicates significant variance between vendors (ANOVA P 0.05)J Am Soc Echocardiogr 2015;28:1171-81
Vendor 1Vendor 2VS.Using Out-Of-The Box Settings to derive GLSMean GLS -12.99 /- 2.38% (P .0001) Mean GLS -16.87 /- 2.84%Using uniform variables to derive GLSMean GLS -16.17 /- 2.90%(P .02) Mean GLS -16.87 /- 2.84%J Am Soc Echocardiogr 2012;25:1189-94
Impact of commonly used strainmeasurements & timing definitionsPeak systolic strain (SS)always measured beforeaortic valve closure (AVC)End-systolic strain (ES) ismeasured on AVCPost-systolic strain (PSS)peaks after AVCCorrect def. of ED & ESES shifted by 4 framesED shifted by 4 framesF1000Research 2016, 5(F1000 Faculty Rev):787
J Am Soc Echocardiogr 2015;28:183-93
Task Force Recommendations The reported type of strain or strain rate (i.e. Lagrangian vs. natural)must be indicated by any software package Software should explicitly state what strain layer is being measured:endocardial, midline, epicardial, or full wall strain. Segment definitions refer to the anatomy at the end-diastolic frame withoption for manual correction. Analysis software commonly uses the peak of the QRS complex to defineend-diastole, however user must be informed about the time referencewhich is used with option for manual adjustment. User must be informed about the time reference, which is used to defineend-systole and be offered the opportunity to over-rule this definition ifdeemed necessary according to the pathophysiological situation End-systolic strain (ESS) should be reported as a default parameter forthe description of myocardial deformation
Task Force Recommendations The global strain or strain rate should be calculated by using the entiremyocardial line length & location (endocardium, midline, or averagedover the entire cardiac wall) must be explicitly reported by the software Analysis software should offer an automated measure of tracking qualitywith visual display for quality control Myocardial velocities should be reported perpendicular or tangential tothe defined border Twist and torsion parameters are poorly defined in 2D echocardiographyand caution is urged in their use. Since intensive drift correction may mask poor tracking, applied driftcompensation should be indicated to the user and options for turning itoff or on should be available Analysis software should inform the user about measures, whichare applied for regularization (normal modeling, smoothing, etc.) All references to strain changes should consider the absolute valueof the number (increased GLS more negative) always including the sign
Coefficient of Variation (CV)BeforeStandardizationAfterStandardizationJ Am Soc Echocardiogr 2015;28:642-8
Recommendations for LV Strain1. Optimize image quality, maximize frame rate, and minimizeforeshortening.2. Perform GLS measurements in the three standard apical views andaverage results3. Begin with the apical long-axis view to visualize aortic valve closure4. Avoid calculating GLS when regional tracking is suboptimal in morethan two myocardial segments in a single view5. Committee refrains from recommendations regarding basis for GLScalculation using endocardial, midwall, or average deformation andrefers to the ongoing joint standardization initiative of the ASE,EACVI, and the ultrasound imaging industry6. Serial assessment of GLS in individual patients should be performedusing the same vendor’s equipment and the same software7. Use strain data as compliment to EF
Quantification of RWM Using Dopplerand STE1. Speckle tracking is preferred over DTI due to its angle dependencyand susceptibility to underestimation2. Use of deformation parameters, such as strain and strain rate, isovervelocityand motiondue to theirinsensitivityto smentofthemagnitudepassive tethering or translational motionregional LV deformation cannot be recommended at this stage3. Mostcommonlyused deformationparameterreproducibility,is longitudinal ic strainconsiderable inter-vendor measurement variability4. No specific normal ranges are provided for regional strain5. The value of regional deformation parameters and temporalpatterns of strain such as post systolic shortening or thickening(aka tardokinesis) is the subject of ongoing research and remainsto be determined6. The 16-segment model is recommended for wall motionaseessment
Recommendations for RV Strain1. RV longitudinal strain is less confounded by overall heart motionbut depends on RV loading conditions as well as RV size & shape2. RVLS should be measured by STE in the A4CH RV-focused view3. RV STE strain is influenced by image quality, reverberation,attenuation, other artifacts, placement of basal reference points4. The width of the region of interest should be limited to themyocardium, excluding the pericardium, which may be difficultgiven the usually thin RV free wall5. Peak RV Free Wall GLS (excluding IVS) has been reported bylargely single center studies to have prognostic value in variousdisease states, such as heart failure, acute myocardial infarction,pulmonary hypertension, and amyloidosis, and to predict RVfailure after LV assist device implantation6. Pooled data suggest that global longitudinal RV free wallstrain -20% (i.e., 20% in absolute value) is likely abnormal
Journey from 2Dto 3D strain Speckles can be followed in any direction Allows calculation of all 3D strain parameters fromsingle volumetric data set (workflow time saving) Avoids errors caused by heart rate variability betweendifferent 2D acquisitionsCardiovasc Diagn Ther 2018;8(1):101-117
Journey from 2Dto 3D strain Speckles can be followed in any direction Allows calculation of all 3D strain parameters fromsingle volumetric data set (workflow time saving) Avoids errors caused by heart rate variability betweendifferent 2D acquisitionsReproducibility Intraobserver variability: 1% to 13%; Interobserver variability: 2% to 14% Temporal variability depends on acquisition, post processing, and hemodynamics Most important aspect is probably to achieve the optimal trade-off betweentemporal and spatial resolution The biggest concern regarding the reproducibility of 3DSTE is related to vendordependency should obtain the baseline and follow-up acquisitions and analysesfrom the same hardware and software equipmentFeasibility Much lower feasibility (63%-83%) vs. (80–97%) compared to 2DSTE after excludingpatients with irregular rhythm and unable to perform adequate breath-hold Further limited by stringent technical requirements to maintain accuracyCardiovasc Diagn Ther 2018;8(1):101-117
Feasibility of 3D-STE 71% ?Applicability to higher (real-world) BMI?
Step 1Step 2 Auto LV measurements werefeasible in 98% of studies Average analysis time was 8 /1 s/patient Automated and manual LSmeasurements obtained at thereference center showed goodagreement Automated EF and LS had novariability.Step 3J Am Coll Cardiol 2015;66:1456–66
Q1: What signal processing steps are requiredto transform a regular PW Doppler to a highfidelity tissue Doppler signal?A. Turn off high pass filter decrease receiver gain decreasescale Turn on low pass filterB. Turn on high pass filter decrease receiver gain decreasescale Turn off low pass filterC. Turn off high pass filter increase receiver gain increasescale Turn on low pass filterD. Turn on high pass filter increase receiver gain increasescale Turn off low pass filter
Q2: Which of the following statements is mostaccurate regarding Tissue Doppler Imaging(TDI) and Speckle Tracking Echocardiography(STE)A. Unlike pulsed wave TDI, 2D-color TDI measurements are notangle dependent and as such may yield higher velocitiesB. Both STE and TDI methods allow for evaluation oflongitudinal, circumferential, radial, and twist/torsional strainC. I
echocardiography (STE) techniques and list some of the main clinical applications for strain imaging 3. Explain the relationship between strain, strain rate, velocity, and displacement 4. Discuss the main technical challenges and barriers to widespread clinical adoption of