Transcription
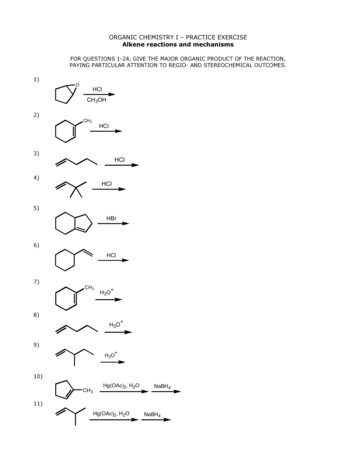
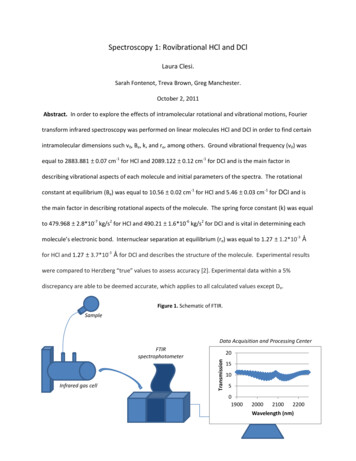
Spectroscopy 1: Rovibrational HCl and DClLaura Clesi.Sarah Fontenot, Treva Brown, Greg Manchester.October 2, 2011Abstract. In order to explore the effects of intramolecular rotational and vibrational motions, Fouriertransform infrared spectroscopy was performed on linear molecules HCl and DCl in order to find certainintramolecular dimensions such v0, Be, k, and re, among others. Ground vibrational frequency (v0) wasequal to 2883.881 0.07 cm-1 for HCl and 2089.122 0.12 cm-1 for DCl and is the main factor indescribing vibrational aspects of each molecule and initial parameters of the spectra. The rotationalconstant at equilibrium (Be) was equal to 10.56 0.02 cm-1 for HCl and 5.46 0.03 cm-1 for DCl and isthe main factor in describing rotational aspects of the molecule. The spring force constant (k) was equalto 479.968 2.8*10-7 kg/s2 for HCl and 490.21 1.6*10-6 kg/s2 for DCl and is vital in determining eachmolecule’s electronic bond. Internuclear separation at equilibrium (re) was equal to 1.27 1.2*10-3 Åfor HCl and 1.27 3.7*10-3 Å for DCl and describes the structure of the molecule. Experimental resultswere compared to Herzberg “true” values to assess accuracy [2]. Experimental data within a 5%discrepancy are able to be deemed accurate, which applies to all calculated values except De.Figure 1. Schematic of FTIR.SampleData Acquisition and Processing CenterInfrared gas 00021002200Wavelength (nm)
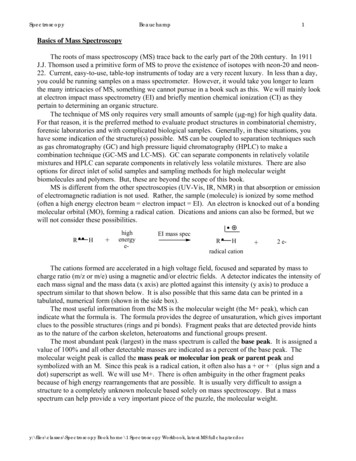
INTRODUCTIONFTIR schematic. The function of the IR gas cell shown in Fig. 1 is to encase the sample duringthe moment of phase transition while the liquid vaporizes at room temperature within the cell. Thespectrophotometer is able to measure the gas peaks, which are sharper than liquid peaks due todecreased intermolecular interaction. FTIR was used because HCl and DCl are able to reach excitedvibrational and rotational energy states when exposed to infrared radiation due to the permanentdipole moment on both molecules. Also, the reduced masses of 35Cl and 37Cl are so similar that a highresolution instrument is required to identify where splitting occurs. Therefore, FTIR is used because it isa high-resolution instrument and works quickly to find the absorption of each molecule while having anappropriate spectral range for mid-range infrared measurements as required for HCl and DCl. Also, DClis used in order to induce a more pronounced difference in the chlorine isotopic effect.Rotational, Vibrational aspects. The rotational energy levels for active infrared states of aFigure 2. [1] Rotational energy levels for vibrationaltransition from ground to excited states.
molecule can be expressed in Fig. 2. Numbers within the parentheses indicate the lower ground state.The arrows indicate transitions from the ground (v” 0) to first excited (v’ 1) vibrational states.Figure 3. Vibrational-Rotational Spectra trend. [1]Fig. 3 represents the trend of a diatomic molecule’s vibrational-rotational spectra. Peaks are identifiedby branch, though the forbidden Q branch is not shown as a peak. Rather, it manifests in the absence ofa peak between the P and R branches. The absorbance band of a molecule is identified by the zero peakof the R branch.RESULTS AND DISCUSSIONPreparations. To begin, HCl (l) was pipetted into an infrared gas cell as shown in Figure 1 above.In accordance with the projected range of experimental wavelength values, KBr windows which coincidewith the infrared spectral range were used in the cell. This was then placed into the Fourier transforminfrared (FTIR) spectrophotometer to measure absorbance, which was converted into transmittance,then processed into graphs of wavelength vs. transmittance, which are gathered in the data processing
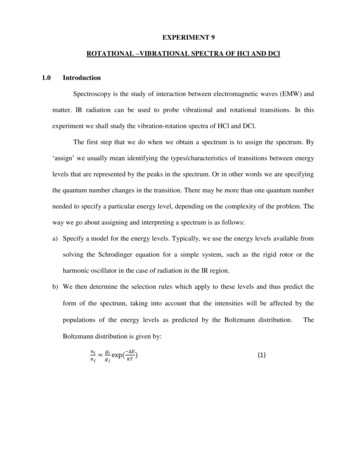
181614P branch-9-8-7Transmission (%)12-6R 5029002950300030503100Wavelength (cm-1)-1Figure 4. HCl absorption approx. 2900 cm with labeled M peaks181614P branch10R branch98Transmission, %127654321012 3475 681086420190019502000205021002150Wavelength (cm-1)-1Figure 5. DCl absorption approx. 2100 cm with labeled M peaks22002250
center as seen in Fig.4 and Fig. 5. The Deuterium chloride gas was not prepared commercially, butrather set up by more experienced supervisors, whom synthesized DCl through the reaction betweenbenzoyl chloride and heavy water. [1]Experimental Data. Unfortunately, the FTIR spectrophotometer was simply not reading an HClband. Since the spectrophotometer was able to read CO2 bands from the supervisor simply breathinginto the instrument, we can conclude some factor—probably a cracked gas cell—compromised theresults, which were unusable. The above graphs are previous experimental data gathered by anothergroup, which is the experimental data used to find the parameters as described in Table 1 below. In Fig.4, HCl shows an absorption band approximately 2900 cm-1 while Fig. 5 shows an absorption band ofabout 2100 cm-1 for DCl. The isotopic change in mass affects the rotation and vibration of the molecule.Table 1. Spectral Peaks of HCl and DClHCl Spectral PeaksDCl Spectral PeaksPeakPeakBranch M valuevalueM 9.282157.962167.612175.32
Defining the molecules. Calculations were done in accordance with the subsequent equationsin order to find Be, re, v0, k, vexe, De, αe, and I to define each molecule. We applied a non-linear fit toeach set of experimental data in Mathematica and Eq. 1 to find v0, Be, De, and αe.Eq. 1v(m) v0 (2Be – 2αe)m – 2αem2 – 4Dem3By using a combination of Eq. 2 and Eq. 3 we were able to solve for the isotope equation, Eq. 4.Eq. 2ve*/ ve (μ / μ*)½The asterick represents the isotopic molecule DCl.Eq. 3vexe*/ vexe (μ / μ*)½Eq. 4v0 ve – 2ve*xe* ve(μ / μ*)½ — 2vexe(μ / μ*)We then solved Eq. 4 and Eq. 5 as a system in Mathematica to get the values of ve and vexe.Eq. 5v0 ve – 2vexeWe found the value of k through the restoring force constant equation Eq. 6, the value of I through theinertia equation Eq. 7, and the value of re for Eq. 8.Eq. 6k [ve(2πc)]2 μEq. 7I h / [Be(8π2c)]Eq. 8re (I/ μ)Eq. 9 below is an expression of a diatomic molecule’s energy levels where T is the term value with unitsof cm-1 rather than joules and c is the speed of light in cm/s and ve is the frequency in cm-1. Eq. 10 canbe used to solve for Cvvib [1].Eq. 9T(v,J) E(v,J)/hc ve(v ½) – vexe(v ½)2 BeJ(J 1) – DeJ2(J 1)2 – αe (v ½) J (J 1)Eq. 10 Cvvib R [(u2 – e-u)/(1 – e-u)-2 ]
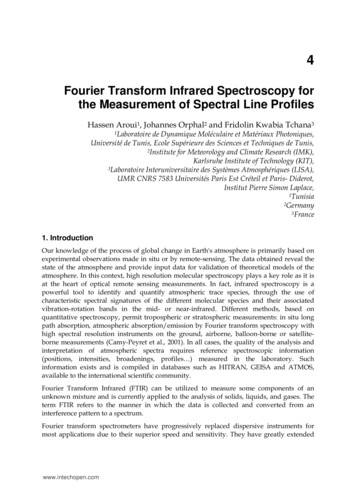
Table 2. HCl internuclear valuesHCl valueerrorHerzbergDiscrepancy(%)Be (cm-1)10.56re1.27(angstrom) 0 (cm-1) 2883.881K (kg/s2)479.968-154.03 exe (cm ) De (cm-1)0.00035αe (cm-1)0.3032I (J*s e 3. DCl internuclear valuesPropertyDCl valueerrorHerzbergDiscrepancy(%)Be (cm-1)re(angstrom) 0 (cm-1) K (kg/s2) exe (cm-1) De (cm-1)αe (cm-1)I .0800.452.1443.61.240.29We were able to check the quality of our results using Mathematica to carry out a multiple linear leastsquares fit of the peaks’ m value and corresponding frequencies. Below are the plots for both HCl andDCl. Since an individual point does not seem out of place, we can conjecture that our data is solid at thispoint and proceed with further calculations. The only hiccup is with the discrepancies of our De values.Discrepancy should be less than 5%, much less 43.6% and 34.2%. There is obviously some problem, andthis value must be deemed inaccurate. We also found Cvvib to be 20.7876 J/(mol*K) at 298K with a0.06% discrepancy. At 1000 K, Cvvib was 23.1173 J/(mol*K) with a 0.36% discrepancy.
frequency in cm 130503000295029002850280027502700m55Figure 6. Δv(m) vs. m plot for HClfrequency in cm 12150210020502000m1055Figure 7. Δv(m) vs. m plot for DCl
The value we found for re is equal for HCl and DCl, as it should theoretically be. However, we shouldkeep in mind that this is an average value, since the internuclear separation will oscillate as eachmolecule undergoes vibrational motion. [3] Also, the k values we calculated were approximately equal inrelation to each other.Factor-1Table 4. HCl vs. DClHClDClBe (cm )10.565re1.27angstrom)(-1 0 (cm ) 2883.881K (kg/s2)479.968-154.03 exe (cm ) -1De (cm )0.00035-1αe (cm )0.303I (J*s2)2.65E-47Trend5.46HCl DCl1.27HCl DClHCl DClHCl DClHCl DClHCl DClHCl DClHCl IONHerzberg values, named after the scientist who ascertained the data, are deemed “true” by the sciencecommunity and compared against our own measurements in order to judge accuracy. In accordancewith these values, our own calculated values can be considered accurate and our experiment a success.As previously stated, internuclear bond distance at equilibrium (re) remained the same for both cellsalong with spring force constant (k). However, the measurements show that a change in reduced massdue to an isotopic effect will result in a change in rotational and vibrational aspects of a molecule,thereby changing other characterstics commonly used in defining a molecule, such as inertia (I). In thefuture, we should be able to apply similar methods of this experiment to catalogue internuclear distanceand the distribution of nuclear size, which are important criteria for grading astrocytomas, a type ofneoplasm in the brain. [4]
References1. Garland, Carl W. Experiments in Physical Chemistry. 8th ed. Pages 416-424. New York, NY. TheMcGraw-Hill Companies, Inc. 2009.2. G. Herzberg. Molecular Spectra and Molecular Structure I: Spectra of Diatomic Molecules. 2nd ed.Chap. III reprint ed. Krieger, Melbourne, FL (1989); K. P. Huber and G. Herzberg. Molecular Spectra andMolecular Structure IV: Constants of Diatomic Molecules. Van Nostrand Reinhold, New York (1979).Although the latter book is now out of print, the content is available at the NIST Chemistry WebBook at http://webbook.nist.gov. 3. Encyclopaedia Britannica. “internuclear separation.” Online edition. nternuclear-separation 4. Nafe R, Van de Nes J, Yan B, Schlote W. Department of Neuroradiology, Clinics of Johann WolfgangGoethe University, Frankfurt am Main, Germany. r.nafe@em.uni-frankfurt.de. Online article. http://www.ncbi.nlm.nih.gov/pubmed/16465775 Many thanks to the fastidious teaching assistant Troy and Dr. Rupnik for hosting us in their lab and forproviding us with the experimental data of previous labs when things went awry.
4, HCl shows an absorption band approximately 2900 cm-1 while Fig. 5 shows an absorption band of about 2100 cm-1 for DCl. The isotopic change in mass affects the rotation and vibration of the molecule. Table 1. Spectral Peaks of HCl and DCl HCl Spectral Peaks DCl Spectral Peaks Branch M value Peak value (cm-1)-M value Peak value (cm 1)