Transcription
4Fourier Transform Infrared Spectroscopy forthe Measurement of Spectral Line ProfilesHassen Aroui1, Johannes Orphal2 and Fridolin Kwabia Tchana31Laboratoirede Dynamique Moléculaire et Matériaux Photoniques,Université de Tunis, Ecole Supérieure des Sciences et Techniques de Tunis,2Institute for Meteorology and Climate Research (IMK),Karlsruhe Institute of Technology (KIT),3Laboratoire Interuniversitaire des Systèmes Atmosphériques (LISA),UMR CNRS 7583 Universités Paris Est Créteil et Paris- Diderot,Institut Pierre Simon Laplace,1Tunisia2Germany3France1. IntroductionOur knowledge of the process of global change in Earth's atmosphere is primarily based onexperimental observations made in situ or by remote-sensing. The data obtained reveal thestate of the atmosphere and provide input data for validation of theoretical models of theatmosphere. In this context, high resolution molecular spectroscopy plays a key role as it isat the heart of optical remote sensing measurements. In fact, infrared spectroscopy is apowerful tool to identify and quantify atmospheric trace species, through the use ofcharacteristic spectral signatures of the different molecular species and their associatedvibration-rotation bands in the mid- or near-infrared. Different methods, based onquantitative spectroscopy, permit tropospheric or stratospheric measurements: in situ longpath absorption, atmospheric absorption/emission by Fourier transform spectroscopy withhigh spectral resolution instruments on the ground, airborne, balloon-borne or satelliteborne measurements (Camy-Peyret et al., 2001). In all cases, the quality of the analysis andinterpretation of atmospheric spectra requires reference spectroscopic information(positions, intensities, broadenings, profiles ) measured in the laboratory. Suchinformation exists and is compiled in databases such as HITRAN, GEISA and ATMOS,available to the international scientific community.Fourier Transform Infrared (FTIR) can be utilized to measure some components of anunknown mixture and is currently applied to the analysis of solids, liquids, and gases. Theterm FTIR refers to the manner in which the data is collected and converted from aninterference pattern to a spectrum.Fourier transform spectrometers have progressively replaced dispersive instruments formost applications due to their superior speed and sensitivity. They have greatly extendedwww.intechopen.com
70Fourier Transform – Materials Analysisthe capabilities of infrared spectroscopy and have been applied to many fields that are verydifficult or nearly impossible to study by dispersive instruments. Instead of analyzing eachspectral component sequentially, as in a dispersive IR spectrometer, all frequencies areexamined simultaneously in FTIR spectroscopy.By interpreting the infrared absorption spectrum, information about the structure and thenature of the chemical bonds in a molecule can be determined. For most common materials,the spectrum of an unknown mixture can be identified by comparison to a library of knowncompounds.The FTIR technique is a powerful tool for identification of chemical species and theirstructures, for interpretation of the atmospheric spectra by producing an infrared absorptionspectrum that is like a molecular fingerprint. This technique can be used to identifychemicals from spills, paints, polymers, coatings, drugs, and contaminants. It can measuremore than 120 gaseous pollutants in the ambient air (U.S. Environmental Protection Agency,2011), such as carbon monoxide, sulfur dioxide, ozone, and many others. This technique canalso quantify toxic organic pollutants, such as toluene, benzene, methanol etc. Thisquantification is based on the fact that every gas has its own specific spectrum. The FTIRsensor monitors the entire infrared spectrum and reads the different fingerprints of thegases present in the atmosphere.FTIR spectroscopy is also extensively used in the study of absorption line profiles todetermine spectroscopic parameters related to line broadening.This chapter describes laboratory measurements of line parameters for atmospheric tracespecies, using Fourier transform spectroscopy in the infrared spectral range. An illustrationis given with the example of atmospheric molecules such as NH3, OCS and CH3Br, forwhich we have determined line intensities, self- and foreign-gas broadening coefficients,pressure-induced line shifts, as well as line-mixing coefficients for these molecules for morethan 300 rovibrational lines located in the spectral range 1000-3000 cm-1, at room and lowtemperatures.A non-linear least-squares multi-spectrum fitting procedure, including Doppler, and linemixing effects, has been used to retrieve line parameters from more than twentyexperimental spectra, recorded at different pressures of the molecules. The accuracies of theresults are also estimated and discussed as a function of the measured parameter.The results, obtained for several branches of the molecules considered here, will bepresented and analyzed as a function of gas pressure, temperature, rotational quantumnumbers and vibrational bands.From the intensity measurements, we have determined effective transition dipole moments,vibrational band strengths as well as Herman–Wallis parameters for some bands taking intoaccount Coriolis and l-type interactions.For the NH3 molecule, the results concerning line-mixing demonstrate a large amount ofcoupling between the symmetric and asymmetric components of inversion doublets. Thepressure shift coefficients and line-mixing parameters are both positive and negative. Somegroups of lines illustrate a correlation between line-mixing and line shift phenomena,demonstrated by a nonlinear pressure dependence of the line position.www.intechopen.com
Fourier Transform Infrared Spectroscopy for the Measurement of Spectral Line Profiles71Excluding the Introduction and the Conclusion, this chapter is divided into three sections.The FTIR spectroscopy technique is described in detail in section 2. In particular, the modelused to describe the instrument line shape function of the Fourier transform spectrometer ispresented. Measurement of line profiles using Fourier transform spectroscopy is presentedin section 3. In this section, the measured broadening and shift coefficients, as well as lineintensities and line-mixing parameters are presented and discussed. The rotationaldependence of the pressure broadening coefficients is fitted using empirical polynomialequations to provide empirical interpolation and extrapolation models.2. Fourier transform spectroscopy2.1 Quantitative absorption spectroscopyInfrared spectroscopy is the absorption measurement of different IR frequencies by a samplelocated in the path of an IR beam. Using various sampling accessories, the spectrometers canaccept a wide range of sample types such as gases, liquids, and solids.The basic principle for the evaluation in IR spectroscopy is the Beer-Lambert law which wasdefined in 1852. This law relates the absorption of light to the properties of the materialthrough which the light is traveling. Absorption spectroscopy consists of the application ofthis law which illustrates that when traversing a measurement cell, the light intensitydecreases exponentially:I I0 ( )exp{-α( )̀} ,(1)where α(σ) (in cm-1) is the absorption coefficient of the material, σ is the wavenumber (incm-1), ̀ is the absorption path length (in cm). I0(σ) and I(σ) are the intensity of a collimatedlight beam (in Wm-2) respectively before and after absorption by the sample.The transmission spectrum T(σ) is the ratio of I(σ) by I0(σ):T( ) I( ).I0 ( )(2)Eq. (1) can be expressed as a function of the absorption cross section σe(σ) (in cm-2molecule-1).I I0 ( )exp{- e ( )Ǹ} .(3)N is the particle density (in molecule cm-3). At standard conditions of pressure (P 1 atm)and the temperature (T 273.15 K), N is equal to the Loschmidt number1 (Auwera, 2004):nL 2.6867661 (47) x 1019 molecule cm-3 atm-1.1Computed from the value of the molar gas constant R available in February 2003 on the website of thePhysics Laboratory of the National Institute of Science and n.com
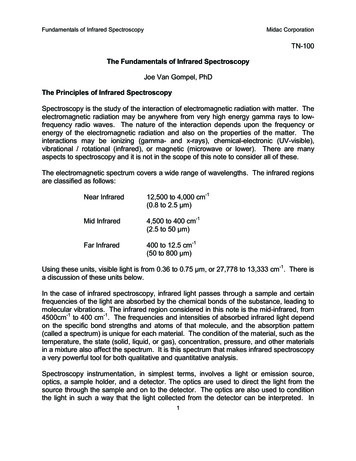
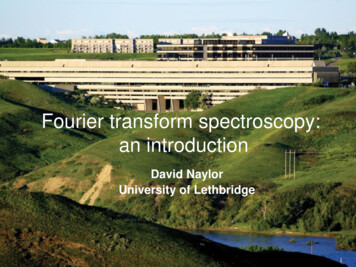
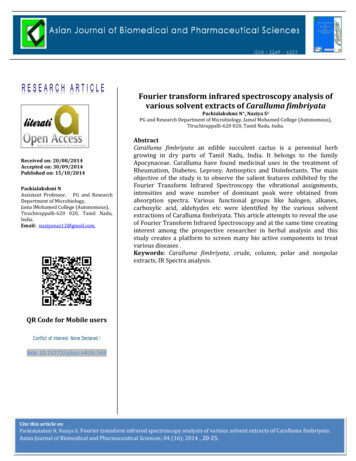
72Fourier Transform – Materials Analysis2.2 Fourier transform spectroscopy2.2.1 IntroductionSince the invention of the first spectrophotometers in the beginning of 20th century, a rapidtechnological progress has occurred. The first-generation spectrometers were all dispersivewith a prism or grating as dispersive elements. In the mid 1960s infrared spectroscopy hasseen the advent of the Fourier transform spectrometer. These second-generation infraredspectrometers have significant advantages compared to dispersive spectrometers.2.2.2 General descriptionThe basic experimental set up of the Fourier transform spectrometer is constituted by theMichelson interferometer. As shown in Fig. 1, light from a source (S) is collimated and thendivided at a beam splitter (L) into two beams of equal amplitude. These beams are reflectedback on themselves by two separate mirrors, one fixed (M2) and the other movable (M1).Each single beam strikes the beam splitter again, where they are recombined and directed tothe detector (D). The two components in the recombined beam interfere with each other andform a spot whose intensity depends upon the different paths traversed by the two beamsbefore recombination. As one mirror moves, the path length of one beam changes and thespot on the detector becomes brighter and dimmer successively, in synchronization with themirror position.It should be noted that the same types of radiation sources can be used for both dispersiveand Fourier transform spectrometers.M1eLSM2llDFig. 1. Michelson interferometer showing three compartments: the radiation source (S), thedetector (D), and the interferometer with its two mirrors M1 and M2 and its beam splitter L2.3 Mathematic formulation2.3.1 The interferogram expressionFourier transform spectroscopy principles are extensively described in the literature (Bell,1972; Davis et al., 2001; Griffiths & Haseth, 1986). Basically, a Fourier transformwww.intechopen.com
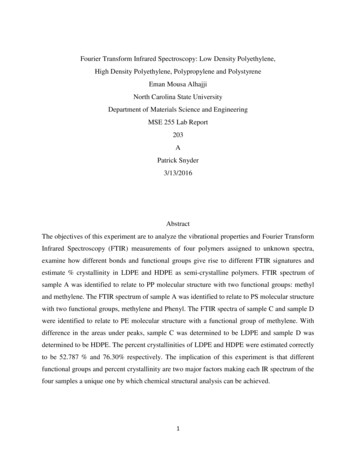
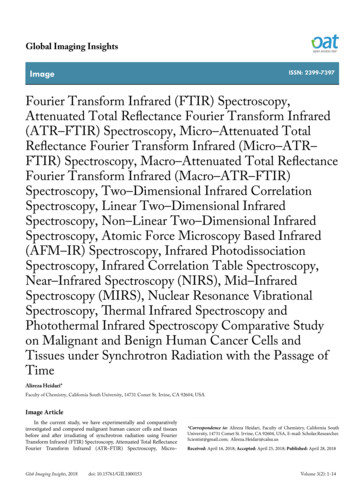
Fourier Transform Infrared Spectroscopy for the Measurement of Spectral Line Profiles73spectrometer generates the quantity I’(δ) which is the cosine Fourier transform of theincident light beam of spectral irradiance B(σ) over a range of optical path differences δdefined by the positions of the moving mirror with respect to the fixed mirror (Bell, 1972): I'( ) B( ) 1 cos(2π0) d .(4)In FTIR spectroscopy, only the modulated part is retained: I( ) B( )cos(2π)d .(5)0The real quantity I(δ) is called the interferogram. An example of such interferogram isshown in Fig. 2 for an infrared source, recorded from –δmax to δmax, where δmax is themaximum optical path difference achieved.The spectral distribution (spectrum) can be recorded by computation of the Fouriertransform of I(δ):# ) I( )exp{-i2πB( - }d.(6)This equation requires that the interferogram is known from δmax - up to δmax . SinceI(δ) can be split into the sum of even and odd functions (Brassewell, 1965):11I( ) I( ) I(- ) I( ) - I(- ) E( ) O( ) .22(7)Eq. (6) can be written as: # ) 2 E( )cos(2πB(0 )d - 2i O( )sin(2π)d .(8)0This equation shows that the observed spectrum B(σ) is real and even, if the interferogram isan even function. Only the side of the interferogram corresponding to δ 0 is recorded; thespectrum is then computed using the cosine Fourier transformation only.2.3.2 Instrumental line shape functionWhen the spectral analysis takes into account experimental parameters such as thetruncation of the interferogram, the finite size of the source, phase errors, opticalmisalignments, etc., an instrumental line shape function, FApp(σ), is introduced, and therecorded spectrum can be written as:# ) B( ) F ( )B(App(9)The symbol means the convolution of B(σ) with FApp(σ). In the following, we discuss theeffect of FApp(σ) on the recorded spectra.www.intechopen.com
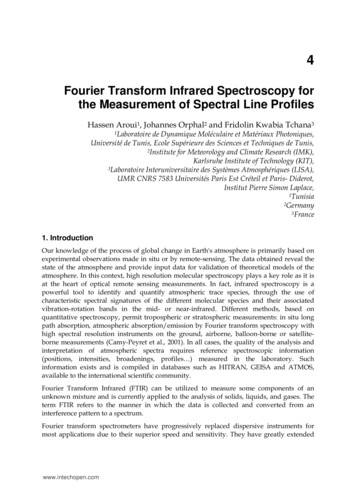
74Fourier Transform – Materials Analysis2.3.3 Truncation of the interferogramMathematically, the truncation of the interferogram recorded up to a finite maximumoptical path difference δmax yields:FApp ( ) 2max sinc(2πmax ) ,(10)0.60.60.40.4I( tical path difference δ25002500FT0.30.32 O -1cm-1Wavenumberσ σin cmFig. 2. Example of an interferogram and its spectrum calculated using a Fourier Transformalgorithmwww.intechopen.com
Fourier Transform Infrared Spectroscopy for the Measurement of Spectral Line Profiles75where sinc(x) sin(x)/x. The full width at half maximum (FWHM) of this function definesthe theoretical maximum spectral resolution Rth that can be achieved with a Fouriertransform spectrometer (Bell, 1972):R th 1.2067 .2 max(11)The sinc(x) function exhibits large oscillations: the amplitude of the first lobe is equal to 22%of the maximum amplitude of the function. These oscillations can be rather annoying for thespectral analysis since they lead to distortion of spectral lines. They can be reduced oreliminated through multiplication of the interferogram I(δ) with a so-called apodizationfunction which decrease with increasing optical path difference, thus reducing thetruncation effect of the interferogram at δmax.A typical apodization function is a triangle function whose Fourier transform is thesinc2(2πδmaxσ) function. However, because Rth is inversely proportional to δmax, apodizationhas the disadvantage of decreasing the spectral resolution. Then the apodized maximumspectral resolution achievable by a Fourier transform spectrometer is equal to the full widthat half maximum of the sinc2(x) function.R th 1.792 max(12)This definition of the resolution is used for Bruker FTIR spectrometers. For the Bomeminstruments, R 0.5/δmax is used.2.3.4 Detector non-linearityFor line intensity measurements, the major distortion of spectra may be due to thenonlinearities of the detector (MCT detectors are nonlinear). To remove these nonlinearities,some studies have been performed (Abrams et al., 1994; Auwera, 2004; Guelachvili, 1986).Abram et al. showed that the recorded interferogram can be described as power series of thetrue interferogram (Abrams et al., 1994). Later Auwera developed an algorithm based onAbram’s work to avoid nonlinearities (Auwera, 2004).This phenomenon is manifested when the detector is illuminated by a relatively intensesource with large spectral coverage. This nonlinearity affects the interferograms near thezero optical path difference where the signal is the largest. Such behaviour affectsconsequently the entire spectrum.Note that, using the sensitivity curve of the detector, one should be sure to remainpermanently in the interval of linearity of detection by reducing the most possible theexplored spectral region and by limiting the intensity of the source to avoid the effects ofsaturation of the detector. Since the true physical measured quantity is the interferogram,for broad band measurement in absorption spectroscopy, these effects will affect morestrongly the center burst of the interferogramm, reducing artificially its amplitude where thesignal is largest. Thus, one of the experimental signs signaling the presence of gross nonlinearity effects is the appearance, after Fourier Transform, of an artefactual signal below thedetector or beam-splitter cut-off (see for instance the curve below of Figure 2, where nosignal should be present below 500 cm-1).www.intechopen.com
76Fourier Transform – Materials Analysis2.3.5 Extended size of the sourceThe collimated beam inside the Michelson interferometer is produced using an extendedsource at the focus of a lens. This beam passes through an iris occulting part of the image ofthe source. Because of the finite size of this iris, the collimated beam is slightly divergent inthe interferometer. When this effect is taken into account, the interferogramI( ) B cos(2π 0 ) of a monochromatic source at wavenumber σ0 becomesI( ) B πd 2 0πd 2sinc 224F 8F cos 2π 0 d2 . 1 2 16F (13)In this expression, d is the diameter of the iris and F the focal length of the collimating optic.This equation shows that the beam divergence has two effects:-- ' 1 -d2 . The first effect is easy to16F 2 account for by using δ’ in all calculations.a multiplication of the interferogram by a sinc(x) function at the wavenumber σ0 of thesource. This leads to a convolution of the spectrum with a box of width σ0d2/(8F2).a change on the optical path difference2.3.6 Sampled interferogram and spectrumFirst the interferogram is sampled at regular intervals as the moving mirror traverses theoptical path difference δ. To avoid the loss of the signal information, for a spectrum with aΔσ extend, the sampling step Δσ must satisfy the Nyquist condition:Δ 1.2Δ(14)Thus the continuous interferogram is multiplied by a sampling comb, modelledtheoretically by a comb of delta functions. Sampling the interferogram has obvious effectssuch as replacing the integrals of Eqs. (6) and (8) by sums over the samples. The number ofsample points in the spectrum is equal to 2 max Δ 1 .Practically in the spectrum the wavenumber interval between two points is equal to 12. Thus the spectral resolution is chosen such that there are at least two samplemaxpoints per line width.2.3.7 Zero fillingZero filling is a data processing technique where zero points are added to the end of theinterferogram before the digital Fourier transformation. It is the process of interpolatingextra data points into a spectrum so that the spectral lines have a smoother shape with abetter digital resolution, using the same Fourier coefficients. FTIR software automaticallyprovides zero-filling by extending the length of an interferogram with a zero straight line.However there is no new information added to the spectrum.www.intechopen.com
Fourier Transform Infrared Spectroscopy for the Measurement of Spectral Line Profiles77Generally, the original interferogram size should always be at least doubled by zero filling,i.e. zero filling factor (ZFF) of two is chosen. Zero-filling is an interpolation that does notaffect the instrument line-shape, and in most cases, is therefore superior to polynomial orspline interpolation methods that are applied in the spectral domain.2.3.8 Phase errorsIn Fourier transform spectroscopy interferograms are apodized prior to the transformationand the calculated spectrum is phase corrected. If the zero point for the Fouriertransformation is displaced, a phase error occurs because the apodization remains fixedwhile the interferogram is shifted by the phase correction. To avoid distortions of thespectrum resulting from phase errors, double-sided interferograms are needed. In practice,single-sided interferograms are recorded double-sided on a small range of optical pathdifference, allowing determination of the phase error. In such a case, the phase error isdetermined at low resolution, typically about 1 cm-1 or less. This is not a problem because itvaries only slowly with wavenumber.2.4 FTIR advantagesCompared with the dispersive spectrometer, the FTIR instrument has several advantages: Better speed and sensitivity: A complete spectrum is obtained during a single scan ofthe moving mirror, while the detector observes all frequencies simultaneously. This iscalled the “Felgett advantage”.The so-called “Jaquinot advantage” consists of an increase of the optical throughput. Acircular optical aperture is used in FTIR systems. The beam area of a Fourier transforminstrument is usually about 100 times larger than the small slit width of a dispersivespectrometer. Thus, more radiation energy is made available. This constitutes a majoradvantage for many samples that are energy-limited.The so-called “Connes advantage” consists of the use of a helium neon laser as theinternal reference. This source radiation provides an automatic and stable calibrationfor all wavelengths. This eliminates, to some extent, the need for external calibrationsources.FTIR spectrometers are usually equipped with a powerful, computerized data system. Itcan perform a wide variety of data processing tasks such as Fourier transformation,interactive spectral subtraction, baseline correction, smoothing, integration, spectral linefits and library searching. Development of the fast Fourier transform algorithm (Cooleyand Tukey, 1965) has facilitated these tasks and reduced the computation time.3. Measurement of line profiles using Fourier transform infrared spectroscopy3.1 IntroductionAnalysis of line profiles are useful for atmosphere monitoring and studying the evolution ofits composition including chemical trace species related to the reduction in stratosphericozone, starting from the analysis of observations obtained by infrared spectroscopy. Theretrieved spectroscopic parameters are indispensable for the interpretation of high-resolutioninfrared spectra of gaseous species, and are of increasing importance for qualitative andwww.intechopen.com
78Fourier Transform – Materials Analysisquantitative applications of spectroscopy. Also the pressure effects of gases on spectral linesare of significant interest in modeling and interpretation of radiative transfer calculations inclimate models. In this context, inversion of atmospheric spectra to determine columndensities of trace atmospheric species requires accurate knowledge of spectroscopicparameters. The needed parameters are, among others, line positions, line intensities, lowerstate transition energies and line widths as a function of temperature and quantumnumbers.However, spectroscopic information contained in the databases such as HITRAN09(Rothman et al., 2009), GEISA (Jacquinet-Husson et al., 2005), JPL (Pickett et al., 1998) andthe more specialized MASTER (Perrin et al., 2005), are often still partly incomplete, e.g. forsome species or transitions, experimental or theoretical line pressure shift and line-mixingparameters are missing. For this reason, Fourier transform spectroscopy is extensively usedto generate these parameters. Compared to diode laser spectrometers, FT spectrometershave the advantage of recording spectra over a large frequency range.In this context, we present in the following Fourier transform measurements of NH3, CH3Brand OCS line profile parameters (line intensity, line width, line-mixing and line shift).When the gas pressure increases, inelastic collisions transfer populations from one radiativestate to another. At low pressure, the lines are isolated; this effect gives a line broadeningand shift proportional to the pressure. At high pressure the lines are overlapped,interference effects occur between adjacent lines. The resulting profile can no longer bedescribed by the superposition of Lorentzian profiles. In this case, in addition to theprevious parameters, one must determine the line-mixing coefficients.A large amount of laboratory data using various spectroscopic techniques of increasingprecision has been assembled over the last two decades. Among the various molecularspecies, ammonia (NH3) is probably one of the most investigated species. This molecule hasalways played an important spectroscopic role because of its inversion spectrum and itslarge molecular dipole, which are important properties for theoretical models. Moreover,ammonia is present in many planetary atmospheres (Ho & Townes, 1983; Kunde et al.,1982). It is also commonly used as an interstellar thermometer and is considered as anindustrial and biological pollutant (Brassington, 1988).The methyl halides (i.e. CH3Cl, CH3Br, and CH3I) have been the subject of very detailedstudies of the Earth's atmosphere. They are atmospheric components which take part inatmospheric photochemical reactions. Methyl bromide (CH3Br) is a halogen chemicalcompound used in agriculture as a plant fungicide, and automobile using leaded petrol(Thomas et al., 1977).This molecule significantly contributes to ozone depletion since CH3Br is dissociated by UVradiation, producing Br radicals that catalyze the destruction of ozone (McElroy et al., 1986).These bromide atoms are far more destructive of ozone than the chlorine atoms comingfrom the chlorofluorocarbons compounds (CFC) (Kurylo & Rodriguez, 1998). For thisreason, since 2005 the use of CH3Br has been prevented under the Montreal protocol.Despite the important role of CH3Br in the atmosphere, no spectroscopic data on CH3Br isavailable in the main databases (Jacquinet-Husson et al., 2005; Perrin et al., 2005; Pickett etal., 1998; Rothman et al., 2009).www.intechopen.com
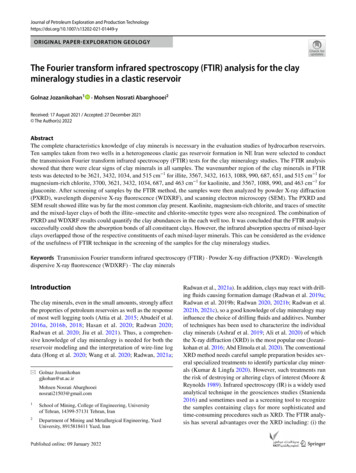
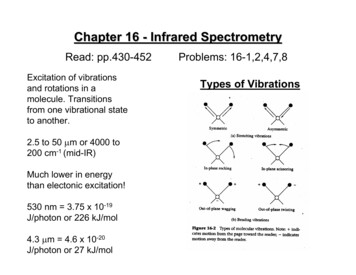
Fourier Transform Infrared Spectroscopy for the Measurement of Spectral Line Profiles79Carbonyl sulfide (OCS) is one of the principal and most long-lived reservoirs of sulfur in theEarth’s troposphere (Watts, 2000) and has been detected in different astrophysical objects(the atmosphere of Venus (Bezard et al., 1990), the Orion molecular clouds (Evans et al.,1991), the comets Hyakutake and Hale-Bopp (Dello Russo et al., 1998; Woodney et al., 1997),and the starburst galaxies (Martin et al., 2005; Mauersberger et al., 1995)).3.2 Experimental set-upThe results presented and discussed in the following are obtained using spectra recordedwith the high resolution Bruker IFS125HR Fourier transform spectrometer (an upgradedversion of the previous version, IFS120HR) located at the LISA facility, in Créteil. A generalview of the laboratory is presented in Fig. 3. It shows the Fourier transform spectrometerBruker IFS125HR, two multiple-reflections (white-type) Pyrex absorption cells and a gashandling system. The Fourier transform spectrometer is characterized by a maximumoptical path difference (MOPD) of up to 473.68 cm (maximum resolution 0.0019 cm-1).The instrument has all the equipment and accessories required to operate from the farinfrared (20 cm-1, 500 microns) to the ultraviolet region (45000 cm-1).Fig. 3. View of the laboratory showing the Fourier transform spectrometer Bruker IFS125HR,two multiple-reflections Pyrex absorption cells and a gas handling system including aturbomolecular pump. In the back is an optical table with a difference frequency generation(DFG) laser system developed at LPPM in Orsay and LISA in Creteilwww.intechopen.com
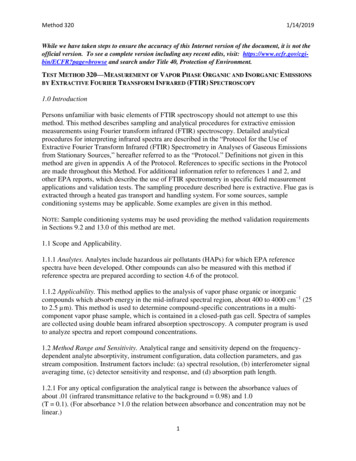
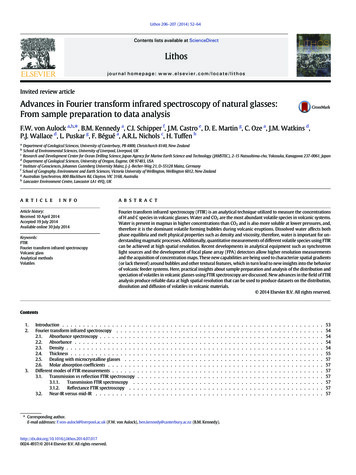
80Fourier Transform – Materials AnalysisThe two multiple reflections cells are of the so-called White-type. They consist of a Pyrextube containing the mirrors separated by 20 and 80 cm, respectively, thus providing baselengths of 0.849 and 3.249 m (this value takes into account the distance between the surfaceof the field mirror and the windows of the cell (2 2.45 cm)). The largest path length thatone can achieve is 7.249 m with the short cell and 32.049 m with the long one. Thetemperature of the sample in these cells is well defined by an air-conditioning systemregulating the temperature of the room, with an uncertainty of 1 K.The gas handling system is made of stainless steel tubing and can be evacuated to less than10-6 mbar by a Pfeiffer Turbomolecular Pumps. Commercial gas lecture bottles with puresamples or buffer gases like N2, He, Ne, Ar etc. can be connected to the system to allowtransfer of the gases to be studied into the absorption cells.Fig. 4 presents the optical design of the Fourier transform spectrometer Bruker IFS 125HR.This instrument is a fast-scanning, asymmetrical Michelson interferometer, characterized bya resolving power better than one million. Four different parts can be distinguished: thesource compartment (bottom right), the interferometer itself (above the sources), the sampleposition (where short path absorption cells are placed) and detector compartment. Thewhole optical path is maintained under vacuum (pressure below 0.06 mbar). Thisinstrument provides three different sources, a high-pressure Hg lamp for the far-infrared, aglobar (Silicon Carbide, SiC) heated to about 1100 K for the mid-infrared, and a tungstenlamp for the near-infrared and visible regions. An external light beam can also enter theinstrument through the input port. The light is focused onto an iris, whose size ranges from0.5 to 12 mm (aperture changer).Fig. 4. Optical scheme of the Bruker IFS125HR Fourier transform spectrometerwww.intechopen.com
Fourier Transform Infrared Spectroscopy for the Measurement of Spectral Line Profiles81The light is then collimated into a 7 cm diameter beam, sent into the Michelson interferometer.Various beam splitters, made of Mylar, KBr/Ge, CaF2/Si and Quartz/TiO2 are available,and used for different spectral regions. Exiting from the interferometer, the light is focusedthrough an optical filter and then through the secondary iris. The beam then goes throughthe sample. Finally, the beam reaches the detectors compartment. We use four detectors, a Sibolometer operating at 4.2 K, a HgCdTe (MCT) detector, and an InSb detector, both cooledto 77 K, and a Si photodiode at room temperature.For the studies of the OCS molecule, this spectrometer was equipped with a KBr/Gebeamsplitter, Globar source (Silicon Carbide, SiC), an InSb detector cooled at 77 K, andoptical and electronic filters covering the spectral region 1850 - 2150 cm-1.For NH3 and CH3Br spectra in the region 1000-1800 cm-1, we used also a liquid nitrogencooled HgCdTe detector. These spectra were recorded with an aperture diameter of 1.15mm, 40 kHz scanner frequency, and a maximum optical path difference MOPD 225 cm forOCS and NH3, and 450 cm for CH3Br. According to the Bruker definition this corresponds toa resolution of 0.004 cm-1 for OCS and NH3 spectra and 0.002 cm-1 for CH3Br.A White-type multipass absorption cell, made of Pyrex glass and equipped with CsBrwindows, was used to record OCS spectra broadened by O2 and N2. The c
2. Fourier transform spectroscopy 2.1 Quantitative absorption spectroscopy Infrared spectroscopy is the absorption measur ement of different IR frequencies by a sample located in the path of an IR beam. Using vari ous sampling accessories, the spectrometers can accept a wide