Transcription
SpectroscopyBeauchamp1Basics of Mass SpectroscopyThe roots of mass spectroscopy (MS) trace back to the early part of the 20th century. In 1911J.J. Thomson used a primitive form of MS to prove the existence of isotopes with neon-20 and neon22. Current, easy-to-use, table-top instruments of today are a very recent luxury. In less than a day,you could be running samples on a mass spectrometer. However, it would take you longer to learnthe many intricacies of MS, something we cannot pursue in a book such as this. We will mainly lookat electron impact mass spectrometry (EI) and briefly mention chemical ionization (CI) as theypertain to determining an organic structure.The technique of MS only requires very small amounts of sample ( g-ng) for high quality data.For that reason, it is the preferred method to evaluate product structures in combinatorial chemistry,forensic laboratories and with complicated biological samples. Generally, in these situations, youhave some indication of the structure(s) possible. MS can be coupled to separation techniques suchas gas chromatography (GC) and high pressure liquid chromatography (HPLC) to make acombination technique (GC-MS and LC-MS). GC can separate components in relatively volatilemixtures and HPLC can separate components in relatively less volatile mixtures. There are alsooptions for direct inlet of solid samples and sampling methods for high molecular weightbiomolecules and polymers. But, these are beyond the scope of this book.MS is different from the other spectroscopies (UV-Vis, IR, NMR) in that absorption or emissionof electromagnetic radiation is not used. Rather, the sample (molecule) is ionized by some method(often a high energy electron beam electron impact EI). An electron is knocked out of a bondingmolecular orbital (MO), forming a radical cation. Dications and anions can also be formed, but wewill not consider these possibilities.RH highenergye-EI mass specRH 2 e-radical cationThe cations formed are accelerated in a high voltage field, focused and separated by mass tocharge ratio (m/z or m/e) using a magnetic and/or electric fields. A detector indicates the intensity ofeach mass signal and the mass data (x axis) are plotted against this intensity (y axis) to produce aspectrum similar to that shown below. It is also possible that this same data can be printed in atabulated, numerical form (shown in the side box).The most useful information from the MS is the molecular weight (the M peak), which canindicate what the formula is. The formula provides the degree of unsaturation, which gives importantclues to the possible structures (rings and pi bonds). Fragment peaks that are detected provide hintsas to the nature of the carbon skeleton, heteroatoms and functional groups present.The most abundant peak (largest) in the mass spectrum is called the base peak. It is assigned avalue of 100% and all other detectable masses are indicated as a percent of the base peak. Themolecular weight peak is called the mass peak or molecular ion peak or parent peak andsymbolized with an M. Since this peak is a radical cation, it often also has a or . (plus sign and adot) superscript as well. We will use M . There is often ambiguity in the other fragment peaksbecause of high energy rearrangements that are possible. It is usually very difficult to assign astructure to a completely unknown molecule based solely on mass spectroscopy. But a massspectrum can help provide a very important piece of the puzzle, the molecular weight.y:\files\classes\Spectroscopy Book home\1 Spectroscopy Workbook, latest MS full chapter.doc
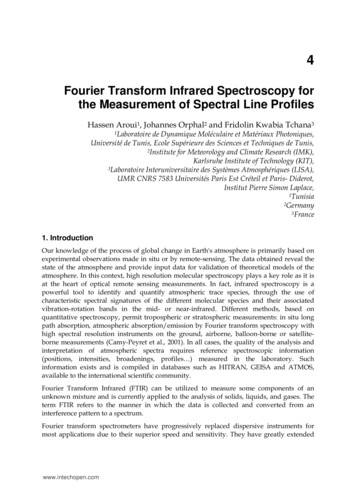
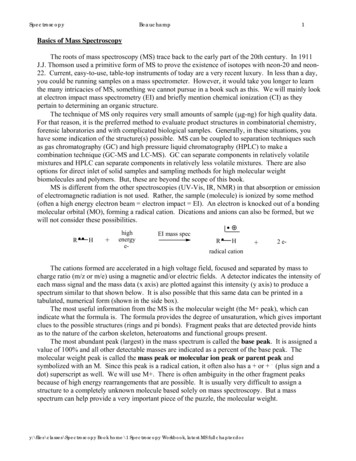
SpectroscopyBeauchamp2base peak largest peak in MS spectrum 100% peak, other peaks are reported as apercent of this peakmolecular ion M M M parent peakOnly specific isotopic masses are found in the molecular formula. We donot see “average” masses that are listed in the periodic table. Also presentwill be M 1, M 2, etc. peaks due to other isotopes. On low resolution MSthese peaks can help decide what the molecular formula is.In the MS example below, some of the peaks are very ‘logical’ (57, 85 and 91 are logical) andsome are less so (39, 41, 42, 51 and 55). It is also true that peaks that are ‘logical’ are sometimessmall or completely missing (119). Many of the other peaks will be explainable with certainassumptions about fragmentations discussed later in this chapter. .91Tabulated 92176177percent62247261113399513112100 (base)6223667 M 185 119571-phenyl-2-hexanoneC12H16O , MW 176O5710085 base peakMany smallerpeaks are notshown, but listedin data table tothe left.75percentrelative 50intensity9129 412527655839M peak17686 9200255075100mmasscharge e125150175200
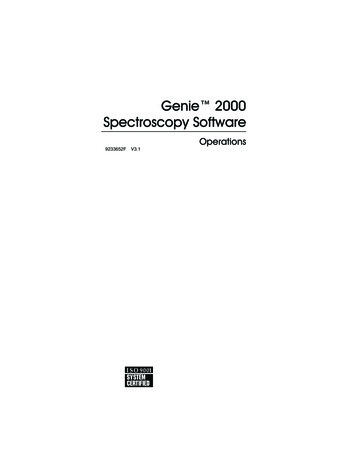
SpectroscopyBeauchamp3Typical MS Instrument Features.The moving charged cations (R-H ) can be made to curve in their direction of flight in amagnetic or electric field. The amount of curvature is determined by the mass (m) of the ions asshown in the following equations (assuming the charge, e, is constant 1). The magnetic field (B)and/or accelerator plate voltage (V) can be altered to cause each possible mass to impact the detector.The charged masses must survive about 10-6 to 10-5 seconds to make this journey to the detector.Often there is some rational feature to explain each peak’s special stability that allows it to last longenough to reach the detector, where it becomes part of the data we examine. We will look at some ofthese features later in this discussion. We will not discuss other possibilities, such as metastable ionsor 2 and negatively charged ions. Our main goal in this book is interpretation.mer B2r22V mVe1Bm masse charge (usually 1)B size of magnetic fieldr radius of curvatureV voltage on accelerator plateBesides just seeing a positively charged mass at the detector, we must resolve it from nearbymass values. MS instruments can be either low resolution (LRMS) or high resolution (HRMS). Lowresolution MS instruments can generally resolve single amu values as high as about 2000 amu’s (e.g.they can distinguish 300 amu from 301 amu). An atomic mass unit is defined as 1/12 the mass of aneutral carbon-12 atom (12C 12.0000, by definition). High resolution MS instruments can resolvemasses as close as the fourth decimal place (XXX.XXXX). With such accuracy, an exact molecularformula can be determined by a computer. A molecular formula can also be obtained from LRMS,y:\files\classes\Spectroscopy Book home\1 Spectroscopy Workbook, latest MS full chapter.doc
SpectroscopyBeauchamp4through a slightly more involved procedure. HRMS instruments tend to be more expensive and lesscommon.Exact MassesWe need to be precise in our calculation of possible masses for each collection of atoms becausethe atoms in any cation hitting the detector are specific isotopes. The atomic weights listed in theperiodic table are average weights based on the abundance and mass of all of the naturally occurringisotopes of each element. For example, the atomic weight of bromine in the periodic table is 79.9,even though there is no bromine isotope with a mass of 80. The 79.9 atomic weight is a result of anapproximate 50/50 mixture of two stable isotopes of mass 78.9 and 80.9. Because of thiscomplication, we will require data on the exact masses and the relative abundance of the commonisotopes that we expect to encounter. Those most useful to us in organic chemistry and biochemistryare listed below.ElementhydrogenAverageAtomic Weight1.00797Nuclides1H2H 6fluorineExact Mass1.007832.01410Relative 45100.0*The most abundant nuclide is assigned 100% and the others assigned a fractional percent of that value.Coincidently, in the examples listed in the table above with more than one isotope, the lowest mass isotope isthe 100% isotope.
SpectroscopyBeauchamp5Obtaining a molecular formula from a HRMS is relatively straight forward Each possiblemolecular mass is unique when calculated to 3-4 decimal places and computers can do thecalculations for us. Try the problems below. Unfortunately, here you have to do the calculationsyourself.Problem 1 - A low-resolution mass spectrum of 1,10-phenanthroline showed the molecular weight tobe 180. This molecular weight is correct for the molecular formulas C14H12, C13H8O and C12H8N2. Ahigh-resolution mass spectrum provided a molecular weight of 180.0688. Which of the possiblemolecular formulas is the correct one? What is the degree of unsaturation in 1,10-phenanthroline?Problem 2 – Isopalhinine A, a natural product was found by low-resolution mass spectrometry tohave a molecular weight of 291. Possible molecular formulas include C15H17NO5, C16H21NNO4, andC17H25NO3. High-resolution mass spectrometry indicated that the precise molecular weight was291.1472. What is the correct molecular formula of isopalhinine? What is the degree ofunsaturation?To obtain a molecular formula from a LRMS requires more sophistication. Various possibleformulas can be generated using the molecular ion peak and the rule of 13. The first possible formulaassumes that only carbon and hydrogen are present. The molecular mass (M ) is divided by 13generating an integer (n) and a remainder (r). The number 13 represents the mass of one carbon atomand one hydrogen atom. The CH formula becomes CnHn r. All molecular hydrocarbons have evenmass molecular weights.HHHHHHHCCCCCCHHHHHHM 13n rHEach of these masses 13 amu C H(We assume there are "n" of them ifthe unknown was a hydrocarbon.This is our starting point formula.)These are left over hydrogen atoms rM molecular weightn number of CH units quotientr left over hydrogens remainderPossible hydrocarbon molecular formula CnHn r (as a hydrocarbon always an even mass)The degree of unsaturation can be calculated for this formula and possible rings and/or pi bondscan be considered (discussed in the introduction, p 10). If oxygen and/or nitrogen (and otherelements) are present, the C/H numbers in the molecular formula must be changed by an amountequal to the new element’s isotopic mass. It is assumed, when substituting atoms, that the majorisotope is used in all cases (always the lowest mass isotope, for us), H 1, C 12, N 14, O 16, S 32,Cl 35, Br 79. Since oxygen weighs 16, we can subtract CH4 ( 16) from the formula and substitutein the oxygen atom. If two oxygen atoms were present, we would subtract 2x(CH4) C2H8 and soforth. Nitrogen-14 would substitute for CH2 and n nitrogen atoms would substitute for (CH2)x(n). Ifwe did not have enough hydrogen atoms for some reason (it happens), we could take away onecarbon atom and add in 12 hydrogen atoms, or if there were too many hydrogens, you could do it theother way around and add one carbon and take away 12 hydrogen atoms.Information concerning the possible number of nitrogen atoms in the molecular formula is alsoavailable in the molecular mass. If the molecular mass is an even number, then the number ofy:\files\classes\Spectroscopy Book home\1 Spectroscopy Workbook, latest MS full chapter.doc
SpectroscopyBeauchamp6nitrogen atoms has to be zero or an even number ( 0, 2, 4.). If the molecular mass is an oddnumber, then the number of nitrogen atoms has to be odd ( 1, 3, 5.). Remember, each nitrogenatom in the formula adds an extra bonding position.CCCCCnH2n 2OxC even massH even massO even massMW even massOCCCCCnH2n 3N1(N is odd)C even massH odd massO even massMW odd massNNCCCCNCnH2n 4N2(N is even)C even massH even massO even massMW even massProblem 3 - An unknown compound produces a molecular weight of 108. What are all possibleformulas having only carbon and hydrogen or having carbon, hydrogen and an oxygen atom ( twooxygen atoms) or having carbon hydrogen and nitrogen (what is the minimum of nitrogen atoms thatwould have to be present)? What is the degree of unsaturation for each of these possibilities? Is itpossible that the formula has only a single nitrogen? If so what would the formula be? If not, whynot? What if the molecular weight was 107? (Same questions.)To choose among the various formulas generated from the rule of 13, we can consider the otherpossible isotopes present and their relative abundances to calculate the size of the peaks just one massunit (M 1) and two mass units (M 2) larger than the molecular ion peak (M ). For each possibleformula, percents of the M 1 and M 2 peaks versus the M peak are calculated. In this calculationthe M peak is assumed to be 100% for comparisons with M 1 and M 2, regardless of the basepeak. These calculated values are compared to the experimental values to determine the most likelyformula. The reason for this is that the relative sizes of the M 1 and M 2 peaks are determined bythe number and isotopic abundance of the elements present. The presence of either chlorine, bromineor sulfur significantly changes the M 2 peak. If there are multiple halogens (Cl and Br), the M 2,M 4, M 6 and beyond can be calculated and compared to the experimental mass spectrum. Thisapproach only works if the M peak is large enough so that M 1 and M 2 are significant. If the M peak is too small, we can’t tell what the relative fractions of M 1 and M 2 are. Let’s take a look athow one could calculate the relative size of these peaks (M 1 and M 2).Sample calculation using M , M 1, M 2 peaks to identify the molecular formula by LRMSWe will assume an actual formula that is C4H10O. However, we will pretend we don’t knowthis. How could the M 1 and M 2 lead us to the correct formula? The molecular mass of C4H10O is74 and that would produce our molecular ion peak, M . We would have an extra amu in the mass ifwe had a different isotope one amu higher. We could do this 4 ways with carbon (because there arefour 13C atoms) 10 ways with hydrogen (2H D) and 1 way with oxygen (17O). The probabilities forthese possibilities are shown below for the M 1 peak. If we add all of these together we can see thetotal probability for getting an M 1 peak relative to 1.0000 for getting the M peak. Using a similarstrategy we can estimate the probability for getting an M 2 peak, which will be considerably lowersince we have to get two 13C or two 2H or one 13C and one 2H. The main contribution to the M 2peak is the 18O isotope. Taken together, these three peaks would predict the indicated distribution forM , M 1 and M 2 for this collection of atoms (C4H10O).
SpectroscopyBeauchamp7molecular ion peak M 4x(12C) 10x(1H) 1x(16O) 74 amuas a fraction 1.000as a percent 100%Whatever the size of this peak,it is assumed to be 100% forcomparison with the M 1 andM 2 peaks.M 1 peak - arises from different possibilities of one additional amu 75 amuone 13C 1.11101.11(4 ways) 0.0439one 2H 0.015100.015(10 ways) 0.00150.04101.24(1 ways) 0.0004one16O 1312CC 13C21DH 2D1716OO 17O 18Osum of possibilities (0.0439) (0.0015) (0.0004) 0.0458M 1 peak as a percent of M peak (0.0458)x(100%) 4.58%M 2 peak - arises from different possibilities of two additional amu 76 amutwo 13C 1.11101.112two 2H 0.015100.01524x32x1"mini" probability theoryThere are 4 ways of pickingthe first carbon and 3 ways ofpicking the second carbon( 4x3) and since all carbonis the same, we can't tell whatcarbon was picked first andsecond, so we divide by twofacorial (2x1). (0.0439)2(6 ways) 0.000710 x 92 x 1 (2.25x10⁻⁸)(45 ways) 1 x 10⁻⁶ 0.000001 too small to considerone 18O 0.20101.24132oneC and one H (1 ways) 0.00201.11101.11100%0.015(4 ways) x 100.015(10 ways) 1 x 10⁻⁶ 0.000065 0.00014.58%sum of possibilities (0.0007) (0.0020) (0.0001) 0.0028M 2 peak as a percent of M peak (0.0028)x(100%) 0.28%M M 10.28%M 2To find a possible molecular formula using the M 1 and M 2 peaks, we first find the correct molecular weightfor our molecule (in this case mass 74). Then we look through the M 1 and M 2 values for two values thatmatch our mass spec data. In this case we see that C4H10O is a very close match and it becomes our best guess.M molecular ion 6NOC3H6O2C3H10N2C4H10OExact Mass (M 2(M 2)0.410.220.030.620.420.230.440.070.28M molecular ion peak(formulas)75CH2H2O2CH4N3OCH6N4C2H2O3etc.Exact Mass (M 1)74.995675.032075.079875.06841.602.703.453.81(M 2)0.610.430.050.25Data tables exist with many valuesalready calculated for comparisons.Here is our compound.Since the molecular weight is even, the number of nitrogens atoms must be even (0,2,4.).Any formulas with an odd number of nitrogen atoms must be part of a fragment.y:\files\classes\Spectroscopy Book home\1 Spectroscopy Workbook, latest MS full chapter.doc
SpectroscopyBeauchamp8Problem 4 –a. Calculate the relative intensities (as a percent) of M , M 1 and M 2 for propene(CH3-CH CH2) and diazomethane (CH2 N N). Can these two formulas (C3H6 vs CH2N2) bedistinguished on the basis of their M 1 and M 2 peaks? Calculate the exact mass (four decimalplaces) for both of these formulas. Can they be distinguished on the basis of exact mass? Helpfuldata are on page 4.b. Both CHO and C2H5 have fragment masses of approximately 29, yet CHO has a M 1 peak of1.13% and M 2 peak of 0.20%, whereas C2H5 has a M 1 peak of 2.24% and M 2 peak of0.01%. High resolution mass spec shows CHO to have a different fragment mass than C2H5 .Explain these observations and show all of your work. Helpful data are on page 4.Chlorine, bromine and sulfur, when present, have very characteristic M 2 peaks (32.6% for Cl,96.9% for Br and 4.4% for S). If multiple Cl’s and/or Br’s are present M 2, M 4 and beyond areindicative of the number and type of halogen(s) present. The various patterns are available in manyreferences. However, you can calculate these values yourself, as was done above for the M 1 andM 2 peaks above.one Cl – comparison of M peak (35Cl) to M 2 peak (37Cl)M peak relative sizeprobability of100%100Cl (1 way) 0.758100 3235(assigned a referenced value of 100%)32%M 2 peak relative sizeprobability of37Cl 32(1 way) 0.242100 320.2420.758percent of M peak (100%) 32%M M 1M 2one Br – comparison of M peak (79Br) to M 2 peak (81Br)M peak relative sizeprobability of100%97%100Br (1 way) 0.508100 9779(assigned a referenced value of 100%)M 2 peak relative sizeprobability of81Br percent of M peak 97(1 way) 0.492100 970.4920.508(100%) 97%M M 1M 2
SpectroscopyBeauchamp9one S – comparison of M peak to M 1 to M 2 peakM peak relative sizeprobability of100100 0.79 4.43 (1 way) 0.95032S 100%(assigned a referenced value of 100%)M 1 peak relative sizeprobability of33S percent of M peak 0.79100 0.79 4.43 (1 way) 0.0080.0080.950(100%) 0.8%M 2 peak relative sizeprobability of34S percent of M peak 4.4%0.8%M M 2M 14.43100 0.79 4.43 (1 way) 0.0420.0420.950(100%) 4.4%one Br and one Cl – comparison of M peak to M 2 and M 4 peaksM peak relative sizeprobability of 79Br 0.508 (from above) probability of 35Cl 0.758 (from above)(probability of 79Br)(probability of 35Cl) (0.508) (0.758)(1 way) 0.385(assigned a referenced value of 100%)M 2 peak relative sizeprobability of 81Br 0.492 (from above) probability of 37Cl 0.242 (from above)(probability of 79Br)(probability of 37Cl)(1 way) (0.508) (0.242)(1) 0.123(probability of 81Br)(probability of 35Cl)(1 way) (0.492) (0.758)(1) 0.373total 0.496percent of M peak (0.496/0.373)x100% 129%M 4 peak relative size(probability of 81Br)(probability of 37Cl)(1 way) (0.492) (0.242)(1) 0.119percent of M peak (0.119/0.373)x100% 31%129%100%31%M M 2M 4two Cl – comparison of M peak to M 2 peak to M 4 peaksM peak relative sizeprobability of two 35Cl (0.758)2 (1 way) 0.602(assigned a referenced value of 100%)100%61%M 2 peak relative sizeprobability of 37Cl 0.242 (from above)(probability of 35Cl)(probability of 37Cl)(2 ways) (0.758) (0.242)(2) 0.367percent of M peak (0.367/0.602)x100% 61%M 4 peak relative size(probability of 37Cl)(probability of 37Cl)(1 way) (0.242)2(1) 0.059percent of M peak (0.059/0.602)x100% 10%y:\files\classes\Spectroscopy Book home\1 Spectroscopy Workbook, latest MS full chapter.doc10%M M 2M 4
SpectroscopyBeauchamp10Problem 5 - Calculate the relative intensities (as a percent) of M , M 2 and M 4 for Br2. Use theprobabilities from above.Problem 6 - Calculate the relative intensities (as a percent) of M , M 2, M 4 and M 6 for BrCl2 andBr2Cl. Hint: All of the data you need to perform these calculations are in the examples above. Usethe probabilities from above.Energetics of Fragmentation of simple hydrocarbon patternsBonds are broken in fragmentations, forming radicals and/or cations. The energy costs forradicals and cations of common hydrocarbon patterns are worked out in the tables that follow. Wefirst assume a C-H bond is homolytically broken (each atom gets one electron, no charge is formed).Next, we take away the cost of making the hydrogen atom (the same for every C-H bond) to find outwhat the cost is for forming only the carbon free radical. Lower energy possibilities are favored overhigher energy possibilities. A few problems are provided just below the following tables to illustratethese points.A similar diagram is constructed to estimate the energy costs of forming carbocations. We start out thesame, but in this diagram we include the ionization potential of the carbon free radical, a value that can bemeasured experimentally. We again take away the energy to make the hydrogen free radical and also takeaway the energy change when the hydrogen atom attracts the extra electron (electron affinity) to become ahydride. What remains is an estimate of the energy to make only the carbocation. This is a considerably largeramount of energy than to make the carbon free radical (because we are stealing away an electron).
SpectroscopyBeauchamp11General Energy Cycle for Carbocations - relative energy to form carbocations (all energy values in kcal/mole)e-RCHheterolyticbond energyCHHf o(H ) -52 heat of formatio of hydrogenatom, common to all cyclesHionizationpotential of H2 CHCH2-HC6H5CH2-HRadicalH (hydrogen carbocation)(methyl carbocation)H3CCH3CH2 (primary carbocationl)(CH3)2CH (secondary carbocation)(tertiary carbocation)(CH3)3C(allylcarbocation)CH2 CHCH2(benzyl carbocation)C6H5CH2Hf o(H electron af finity) -17Hf o(R ) value(see table)HhomolyticbondenergyEnergy to f ormcarbocationHfo(HHf o(R ) [BE IP-EA- Hf o(H )]) energy to make R(104) (313) - (17) - (52) 348(105) (227) - (17) - (52) 263(BE)I.P. 7-52-52-52-52-17-17-52-52(98) (193) - (17) - (52) 222(95) (169) - (17) - (52) 195(92) (154) - (17) - (52) 177(86) (186) - (17) - (52) 20388165-17-52(88) (165) - (17) - (52) 184Common arguments for relative stabilities of free radicals and carbocations are inductiveeffects/hyperconjugation and resonance. Inductive effects and hyperconjugation argue that switchingout a hydrogen for a carbon group allows greater electron donation to the electron deficient carbonatom (free radical or carbocation) because of increased pairs of electrons polarized towards theelectron deficient centers. Carbocations are much more electron deficient than free radicals andbenefit much more from this effect. The resonance argument states that an adjacent pi bond or lonepair can spread electron density through parallel p orbitals, thus reducing the energy to form a cationor free radical.y:\files\classes\Spectroscopy Book home\1 Spectroscopy Workbook, latest MS full chapter.doc
SpectroscopyBeauchamp12The differences in relative carbocation stabilities parallel the trend seen in free radicals, but are greatlyenhanced versus the free radical stabilities.One could also make a steric argument for tertiary being the most stable free radical orcarbocation. The geometry changes from 109o (sp3) bond angles to 120o bond angles (sp2). Theground state of a tertiary C-H bond would start at higher potential energy from crowding, whichwould be relieved somewhat when the fourth group is removed, providing, perhaps, part of theadvantage in the tertiary reaction over secondary over primary over methyl when forming tertiary freeradicals and carbocations.RCRRRmore crowded as sp3 center higherpotential energy starting pointwith 3-4 larger groups aroundtetrahedral carbonBreaking a bond is a largeuphill energy transformation,but less so with a stericallycrowded starting point, so Eais a little smaller than expected.RCRRless crowded as sp2with 3 groupsaround trigonal planar carbonis slightly more stable than itwould be if groups were smallerR
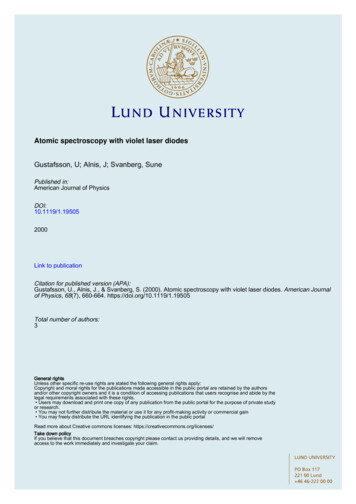
SpectroscopyBeauchamp13Problem 7 – Consider the possible fragmentation of 2-methylbutane (isopentane). There are 3 typesof C-C bonds that could break (b,d,f) and 4 types of C-H bonds that could break (a,c,e,g). Onlyconsider breaking the C-C bonds (b,d,f) and the tertiary C-H bond (c). Each bond could break in twoways: either atom could be a cation and either atom could be a free radical. Calculate the energy costfor each possibility (each bonded atom as a radical and each atom as a cation). For each possibilitywhat are the masses that would be observed at the detector (we only see cations)? This problem willrequire eight calculations for the four bonds considered.CH3H2CaHd H fCH2CcegHHHbCH3high energyelectron beamH2CaH2-methylbutane(isopentane)d H fCH2CcegHHHbPossiblefragmentations?Energy to rupture bonds(eight calculations).radical cationbcbcdfdfActual Mass Spectrum – tabulated and graphical.mass percent15226427 4328629 6030137138339 3040541 8842 9543 100 base44750251353455 1056 4057 9558671572 16 M Peaks 15, 29, 43, 57 and 72 are logical. In our discussions offragmentation we will see how many of the other peaks are explainable.75 eV43 base peak41,4257100isopentaneC5H1275CH34315CH 29 CH3H3CCH2MW 725729percentrelative 50intensity3925Many smallerpeaks not shown.M peak72002550massm chargeey:\files\classes\Spectroscopy Book home\1 Spectroscopy Workbook, latest MS full chapter.doc75100
SpectroscopyBeauchamp14Problem 8 – Consider the possible fragmentation of 2,2,4-trimethylpentane. There are four types ofC-C bonds that could break (a, b, d, f) and 4 types of C-H bonds that could break (a, c, e, g). Onlyconsider breaking the C-C bonds (a, b, c, d). Each bond could break in two ways: either atom couldbe a cation and either atom could be a free radical. Calculate the energy cost for each possibility(each bonded atom as a radical and each atom as a cation). For each possibility what are the massesthat would be observed at the detector? This problem will require eight calculations for the fourbonds considered (we only see cations).CH3H3C a CbH2CCH3cHCdCH3CH3high energyelectron beamH2 HCH3H3C a CCCcbdCH3CH32,2,4-trimethylpentanea27529839540141 2142143 1853155356 3357 100 base5849961140 M (missing)CH3Energy to rupture bonds(eight calculations).radical cationabActual Mass Spectrum tabulated and graphical.mass percentPossiblefragmentations?bccdd
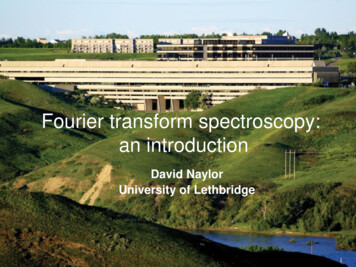
SpectroscopyBeauchamp15Problem 9 - Predict reasonable fragmentation patterns for n-octane and where the major ion peaksshould appear. Rationalize your predictions on the basis of energetics. The mass spectrum isprovided for comparison. Some of the less logical peaks will become explainable after ourdiscussions on fragmentation. Is there a ‘logical’ peak that is missing?Actual Mass Spectrum tabulated and graphical.mass percent27 2028429 2739 1240241 4442 1543 100 base44353255 1156 1857 3469270 1271 2084785 268621146 M percentrelativeintensity 75 eVbasepeak43100octaneC8H18Many smallerpeaks not shown.75H2CH3CH2CCH2H2CCH2CH3CH25041292557M peak1148571002550massm chargeZ75y:\files\classes\Spectroscopy Book home\1 Spectroscopy Workbook, latest MS full chapter.doc100120
SpectroscopyBeauchamp16Special patterns of fragmentation from organic functional groupsAlkanes - Key Points (see examples above)1. Lower mass alkyl branch fragments (2-6 C’s, masses 29, 43, 57, 71, 85) are more intense thanhigher mass fragments ( 6). The loss of the smaller branch as the cation more commonly reachesthe detector.2. The major carbocations that form follow carbocation stabilities (R 3o 2o 1o Me). It isalso quite possible that less stable carbocations rearrange to more stable carbocations before theyreach the detector. We can’t tell by only observing the mass since they have the same number.less stableprimary carbocationRproposedfragmentationmore stabletertiary carbocationprobablerearrangementRC4H9mass 57can't tell whichC4H9mass 573. Linear alkanes more often have observable molecular ion peaks, while increased branchingweakens the molecular ion peak. Fragmentation is more common at branch points. Loss of amethyl from a straight chain is considerably weaker than loss of a methyl at a branch point.M 114 (6%)base peak 43(M - 15) 99 peak (0%)M 114 (3%)base peak 43(M - 15) 99 peak (1%)M 114 (0%)base peak 57(M - 15) 99 peak99 peak (6%)4. Linear fragments often differ by 14 amu (different size branches split off between carbons in differentmolecules, CH2 14). Take another look at problem 9, just above.5. There are often clusters of peaks around main peaks. Very large fragment peaks will have atrailing M 1 peak due to 13C isotop
y:\files\classes\Spectroscopy Book home\1 Spectroscopy Workbook, latest MS full chapter.doc Basics of Mass Spectroscopy The roots of mass spectroscopy (MS) trace back to the early part of the 20th century. In 1911 J.J. Thomson used a primitive form of MS to prove the existence of isotopes with neon-20 and neon-22.