Transcription
EXPERIMENT 9ROTATIONAL –VIBRATIONAL SPECTRA OF HCl AND DCl1.0IntroductionSpectroscopy is the study of interaction between electromagnetic waves (EMW) andmatter. IR radiation can be used to probe vibrational and rotational transitions. In thisexperiment we shall study the vibration-rotation spectra of HCl and DCl.The first step that we do when we obtain a spectrum is to assign the spectrum. By‘assign’ we usually mean identifying the types/characteristics of transitions between energylevels that are represented by the peaks in the spectrum. Or in other words we are specifyingthe quantum number changes in the transition. There may be more than one quantum numberneeded to specify a particular energy level, depending on the complexity of the problem. Theway we go about assigning and interpreting a spectrum is as follows:a) Specify a model for the energy levels. Typically, we use the energy levels available fromsolving the Schrodinger equation for a simple system, such as the rigid rotor or theharmonic oscillator in the case of radiation in the IR region.b) We then determine the selection rules which apply to these levels and thus predict theform of the spectrum, taking into account that the intensities will be affected by thepopulations of the energy levels as predicted by the Boltzmann distribution.Boltzmann distribution is given by:𝑛𝑖𝑛𝑗𝑔 𝐸 𝑔 𝑖 exp ( 𝑘𝑇 )𝑗(1)The
c) We then compare the predicted spectrum with the real spectrum, and see if they can bemade to match up. Typically there will be parameters to adjust, such as rotationalconstants and vibrational frequencies. The process of matching up the experimental andpredicted spectra is often aided by looking for patterns, such as repeated spacing of lines.d) If there is reasonable agreement between the two spectra, then the assignment process iscomplete.e) It should be noted that the match between the experimental and predicted spectra is rarelyperfect. Usually we need to refine our model for the energy levels in order to obtain abetter fit – for example in this experiment, by introducing the effects of anharmonicity orcentrifugal distortion.The process of assigning and understanding a spectrum is thus one of refining themodel in order to obtain the best agreement. The whole process of assigning andunderstanding the spectrum allows one to obtain several spectroscopic constants which canthen be used to calculate properties of the molecule such as the bond length. Please refer toreferences for further reading.2.0Rotational StatesThe simplest model that considers rotational states is the rigid rotor (RR). This modelconsiders two atoms at a fixed distance that rotate as a unit.The quantized energy levels of the rigid rotor are given in Eq. 2;𝐸𝐽 ℏ22𝐼𝐽(𝐽 1)(2)
where I is the moment of inertia shown in Eq. 3;𝐼 𝜇𝑟 2(3)where µ is the reduced mass, given by:𝑚 𝑚𝜇 𝑚 𝐴 𝑚𝐵𝐴(4)𝐵and r is the distance between the two atoms in the rigid rotor.J is the rotational quantum number and spans integers from 0 to .The degeneracy of the Jth quantum level is 2J 1.3.0Vibrational StatesThe simplest model for vibrations is the simple harmonic oscillator (SHO). Thevibrational levels for the harmonic oscillator are given by Eq. 5, where υ spans integers from0 to ;1𝐸𝑣 (𝑣 2) ℎ𝜈(5)and ν is the frequency of vibration. This frequency is in turn given by;1𝑘1𝑉 " (𝑥)𝜈 2𝜋 𝜇 2𝜋 𝜇(6)where the harmonic oscillator potential is V(x) ½kx2, hence, the spring constant is directlyrelated to the curvature, or the second derivative, of the harmonic oscillator potential, V”(x).4.0Interaction between Rotational and Vibrational States (rotational-vibrationalspectra)
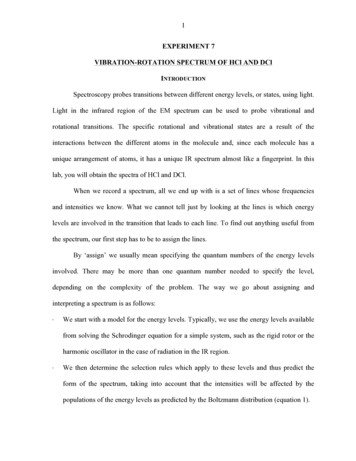
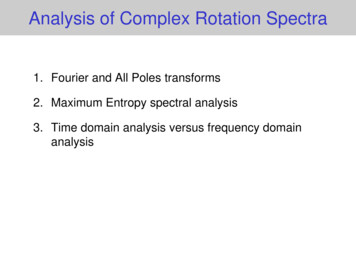
When a gas-phase molecule undergoes a vibrational transition, the energy of theabsorbed photon may be slightly lower than or slightly higher than the exact energy neededto change the state of the molecule from υ 0 to υ 1. This excess (or slight deficiency) ofenergy can lead to a simultaneous rotational transition provided ΔJ (J’ – J”) 0, 1. Theseselection rules were derived using the rigid rotor and harmonic oscillator assumptions. Theresulting rotational-vibrational (ro-vib) spectra can be divided into three branches.Transitions where Δυ 1 and ΔJ 1 are called the “R branch”, those where Δυ 1 andΔJ 1 are called the “P branch”, and those where Δυ 1 and ΔJ 0 are the “Q branch”.For diatomic molecules the Q branch is a forbidden transition (rotation about the bond axishas no effect on the dipole moment) and is not be observed in a diatomic molecule ro-vibspectrum.Figure 1 illustrates the energy levels for the two lowest vibrational states of adiatomic molecule and shows some of the transitions that are allowed between the sublevels.Also shown is an IR spectrum of HCl. Notice that the spectrum is separated into twobranches, with a gap between them. The gap is where the infrared transitions would be if nochange in the J value occurred, i.e, ΔJ 0. This region is known as the Q branch and onlyinvolves a change in the vibrational quantum number. The low frequency branch (P branch)consists of ΔJ 1 transitions and the high frequency branch (R branch) consists of ΔJ 1transitions. Note that the quantum numbers for the lower state in the transition aretraditionally labelled as υ” and J” while those for the upper state are labelled υ’ and J’.Notice that as you count away from the center of thespectrum the intensity of individual lines increases, goes througha maximum and then falls off in the wings. How do you accountfor this behaviour?
Figure 1: Spectral lines and allowed transitions of a ro-vib spectrum. The splitting arises fromthe H35Cl and H37Cl (isotope effect) with H35Cl peaks being the dominant.
To begin the assignment work, we have to decide on consistent units for theparameters in this experiment. The following Table provides values that may be helpful.Table 1: Useful constants and conversion factors.h6.626 10-27 erg s6.6261 10-34 Jsk1.381 10-16 erg/K1.38066 10-23 J/K1 cm-1 1.986 10-16 erg1.98630 10-34 Jm1H1.007825 amu1.672623 10-27 kgm2D2.0140 amu3.3425 10-27 kgm35Cl34.968852 amu5.803558 10-26 kgm37Cl36.965903 amu6.135000 10-26 kgIf we assume that the vibrational and rotational energies can be treated independently,the total energy of a diatomic molecule is simply the sum of its rotational (rigid rotator) andvibrational energies (SHO), as shown in Eq. 7, which combines Eq. 1 and Eq. 4.𝐸𝑣,𝐽 ℏ22𝐼1𝐽(𝐽 1) (𝑣 2) ℎ𝜈(7)Although for low energy vibrational transitions (and low energy rotationaltransitions), this assumption may work, it is still a very simplified view of the problem. Inactuality, diatomic molecules are not perfectly rigid rotors. Two corrections need to beconsidered. Firstly, the rotations distort the molecule and change r. The higher the rotationalquantum number, J, the longer the molecule becomes. This centrifugal distortion effect isusually very small and important only for very large J values. Secondly, the harmonicoscillator model also has limitations. The fact that diatomic molecules dissociate makes itclear that they are not perfect harmonic oscillators. A potential that takes into account the factthat diatomic molecules can dissociate is the Morse oscillator potential, Eq. 8, where De isthe dissociation energy and β is a number that determines the width of the potential.
𝑉(𝑥) 𝐷𝑒 (1 𝑒 𝛽𝑥 )2(8)The energy levels for a Morse oscillator are similar to the harmonic oscillator energylevels but include an anharmonic term. As the vibrational quantum number υ increases, thelevels get closer together.Combining these two corrections, the energies of the rotational-vibrational levels aregiven, in units of cm 1, by Eq. 9;11 2𝐸𝑣 , 𝐽 𝜈𝑒 (𝑣 2) 𝜈𝑒 𝑥𝑒 (𝑣 2) 𝐵𝑣 𝐽(𝐽 1) 𝐷𝑣 𝐽2 (𝐽 1)2(9)The first and second terms account for the vibrational energy, and the third and fourth termsaccount for the rotational energy. The fundamental vibrational frequency of the molecule is νe.The first anharmonic correction to the vibrational frequency is νexe. Bυ is the rotational constantfor a given vibrational level, and Dυ is the centrifugal distortion constant. Bυ may be obtainedfrom the equilibrium geometry of the molecule using the following relationships (Eq. 10 & 11),where Be is the equilibrium rotation constant, α is the anharmonicity correction factor to therotational energy and Ie is the equilibrium moment of inertia.1𝐵𝑣 𝐵𝑒 𝛼(𝑣 2)ℎ𝐵𝑒 (𝑐𝑚 1 ) 8𝜋2 𝑐𝐼𝑒(10)(11)
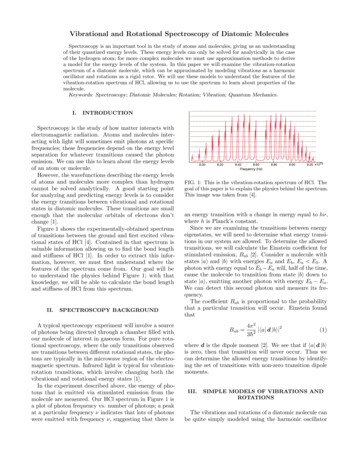
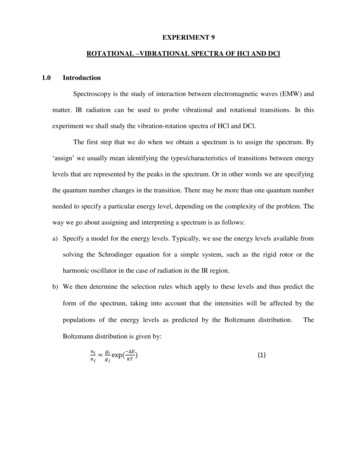
5.0Experimental ProcedureThis part of the experiment will be carried out by the PPS in charge of the lab. You will beexplained how this is carried out. Students will then proceed to the IR lab in the 1st floor andrun the spectrum using the prepared IR cell.CAUTION! Thionyl chloride is a lachrymator. HCl gas is corrosive and care must be taken tocontain it within the optical cell and bubble the excess through water.Figure 2: The apparatus used to produce and transfer HCl/DCl gas to an IR gas cell.A reaction that involves thionyl chloride and a mixture of water and deuteriumoxide to produce HCl/DCl gas and SO2 gas proceeds according to the following reaction:SOCl2 l H2O l 2HCl g SO2 g The microscale apparatus is constructed in a fume hood similar to the block diagramshown in Figure 2. The PPS is charge will carry out the procedure. Please inform the PPSwhen you are going to the IR room. The IR cell is already prepared and ready to be used inthe IR room.The PPS in the IR spectrum will assist you in taking the spectrum.
6.0Data AnalysisAssigning the SpectrumThe first step in obtaining spectroscopic constants is to assign the spectrum. Severalmethods may be used but the most obvious way for a diatomic molecule is to count outwardfrom the gap between the R and P branches. Remember that there the Q branch line (J” 0 J’ 0), which forms the middle of this gap, is a forbidden transition, so you will not see apeak for it. Next you need to tabulate the transition frequencies of each isotope (H35Cl,H37Cl, D35Cl, and D37Cl) for later manipulation. If you did not obtain the peaks of H37Cland D37Cl isotopes, just continue with the H35Cl and D35Cl peaks.Finding Rotational Constants, BυNote that the rotational constant B is different for each vibrational level. In order toobtain B for each vibrational level, first, consider the υ 1 level.Note that if you subtract the frequency of the P(J”) line from the that of the R(J”) line, thedifference is given by Eq. 12, where (J”) is written as (J) for simplicity.DERIVE EQUATION 12R(J) – P(J) B1 [(J 2)(J 1) – J(J-1)] – D1[(J 2)2(J 1)2 - J2(J-1)2](12)This equation can be simplified to Eq. 13 and then rearranged into a more useful slope-interceptform (Eq. 14) so that a plot of [R(J) – P(J)]/(2J 1) versus (J2 J 1) can be used to obtain B1and D1.R(J) – P(J) 2B1(2J 1) – 4D1(2J 1)(J2 J 1)𝑅(𝐽) 𝑃(𝐽)2𝐽 1 2𝐵1 4𝐷1 (𝐽2 𝐽 1)(13)(14)
To obtain the rotational constants for the υ 0 level, perform the same type of manipulationfor R(J 1) – P(J 1), whose difference is given by Eq. 15, which simplifies to Eq. 16. Theseequations apply to both the HCl and DCl species.R(J-1) – P(J 1) B0[(J 1)(J 2) – J(J-1)] – D0[(J 1)2(J 2)2 –J2(J-1)2]R(J-1) – P(J 1) 2B0(2J 1) – 4D0(2J 1)(J2 J 1)(15)(16)Finding Molecular ParametersUsing the Bυ values and Eq. 10, you can obtain Be for each isotope. Subsequently,you can calculate the equilibrium bond length (combining Eqs. 11 and 3) and the averagebond length for each isotope and vibrational level. If the assumptions we have made are allcorrect, re and α should be independent of the isotope. Is this true within the precision of thedata?7.0DiscussionInclude a table of B0, B1, D0, D1, Be α, and re for each isotopomer (H35Cl, H37Cl, D35Cland D37Cl) and all graphs used for obtaining these values.Compare your values with those given in the literature (based on the given references).You should include percent error calculations assuming the literature value to be correct.1. Do the values of the spectroscopic constants Be, Bυ and Dυ vary with isotope and/or withvibrational level in a way that you would expect?2. Does re change for each isotope? Explain your answers.3. In general, what accounts for the uneven spacing on the lines in the P and R branches of avibration-rotation spectrum?4. Using the appropriate Boltzmann distribution equation, model the intensities of theabsorption peaks of your experimental data. Does your data match this theory? Howwould the distribution change at higher temperatures?5. What additional spectroscopic information could be obtained from your data?Include the data that you obtained experimentally and the spectra with the line positions labeled.Be sure to also include all your calculations.
REFERENCES1. P.W. Atkins and J. de Paula, Physical Chemistry, Oxford University Press.2. Cooksy, A, Physical Chemistry: Quantum Chemistry and Molecular Interactions,Pearson Higher Education, 2014.3. S.G. Mayer, R.R. Bard, and K. Cantrell, J. Chem. Educ. 2008, 85, 847.4. F.C De Lucia, P. Helminger, and W.Gordy, Phys. Rev. A 1971, 3, 1849–1857.5. D.H. Rank, D.P. Eastman, S. Rao, and T.A.Wiggins, J. Opt. Soc. Am. 1962, 52, 1-7.6. ic/Html/Tables/HCl.html
ROTATIONAL -VIBRATIONAL SPECTRA OF HCl AND DCl 1.0 Introduction Spectroscopy is the study of interaction between electromagnetic waves (EMW) and matter. IR radiation can be used to probe vibrational and rotational transitions. In this experiment we shall study the vibration-rotation spectra of HCl and DCl.