Transcription
How-To GuideSAP Business One, version for SAP HANADocument Version: 3.0 – 2020-10-14How to Work with Pervasive AnalyticsSAP Business One 10.0 PL00 and later, version for SAP HANAPUBLIC
Typographic ConventionsType StyleDescriptionExampleWords or characters quoted from the screen. These include field names, screen titles,pushbuttons labels, menu names, menu paths, and menu options.Textual cross-references to other documents.ExampleEmphasized words or expressions.EXAMPLETechnical names of system objects. These include report names, program names,transaction codes, table names, and key concepts of a programming language when theyare surrounded by body text, for example, SELECT and INCLUDE.ExampleOutput on the screen. This includes file and directory names and their paths, messages,names of variables and parameters, source text, and names of installation, upgrade anddatabase tools.ExampleExact user entry. These are words or characters that you enter in the system exactly asthey appear in the documentation. Example Variable user entry. Angle brackets indicate that you replace these words and characterswith appropriate entries to make entries in the system.EXAMPLEKeys on the keyboard, for example, F 2 or E N T E R .PUBLIC2 2020 SAP SE. All rights reserved.How to Work with Pervasive AnalyticsTypographic Conventions
Document HistoryVersionDateChange3.02020-10-14Guide cover updated for SAP Business One 10.0, version for SAP HANA.How to Work with Pervasive AnalyticsDocument HistoryPUBLIC 2020 SAP SE. All rights reserved.3
Table of Contents1Introduction. 522.1Working with Key Performance Indicators (KPIs) . 6Designing KPIs Using the Pervasive Analytics Designer. 72.1.1Value Settings Tab . 132.1.2Filter and Parameter Tab. 212.1.3Composite KPI Tab . 302.1.4Status Displaying Section . 312.1.5Adding Actions to KPIs . 32Viewing KPIs in the Cockpit . 34Viewing KPIs in the Fiori-Style Cockpit. 36Managing KPIs in the Pervasive Analytics Designer. 36Predefined KPIs . 372.22.32.42.533.13.23.33.43.53.63.744.1Working with Pervasive Dashboards.52Designing Pervasive Dashboards Using the Pervasive Analytics Designer . 533.1.1Basic Settings Tab . 583.1.2Filter and Parameter Tab. 653.1.3Dashboard Result Area . 68Viewing Pervasive Dashboards in the Cockpit. 92Viewing Pervasive Dashboards in the Fiori-Style Cockpit . 92Viewing Linked Pervasive Dashboards in Sidebars . 92Viewing Recommendations in Sidebars . 93Managing Pervasive Dashboards in the Pervasive Analytics Designer . 94Predefined Pervasive Dashboards . 974.24.34.4Working with Advanced Dashboards . 101Designing Advanced Dashboards Using the Pervasive Analytics Designer . 1014.1.1Edit Mode . 1044.1.2View Mode. 1064.1.3Setting Up Filters. 1094.1.4Using Filters .111Viewing and Managing Advanced Dashboards in the Pervasive Analytics Designer . 113Viewing Advanced Dashboard. 115Predefined Advanced Dashboards . 1155Working with Customer 360 .121PUBLIC4 2020 SAP SE. All rights reserved.How to Work with Pervasive AnalyticsTable of Contents
1IntroductionPervasive analytics for SAP Business One, version for SAP HANA enables you to access and visualize your data ina customized way.The application provides three analytic tools that can accelerate your decision making process, offeringimmediate and fact-based answers to business questions. Key Performance Indicators (KPIs): With queries and views, you can easily design KPIs and related actionsthat are customized to your specific needs. You can view the KPI and use its actions in the advanceddashboard or the cockpit. Pervasive dashboard: With queries and views, you can easily design pervasive dashboards and related actionsthat are customized to your specific needs. You can view the pervasive dashboard and use its actions in theadvanced dashboard or the cockpit. Advanced dashboard: You can design advanced dashboards to contain various widgets. You can view theadvanced dashboard in pages and retrieve specific data using filters.How to Work with Pervasive AnalyticsIntroductionPUBLIC 2020 SAP SE. All rights reserved.5
2Working with Key Performance Indicators(KPIs)A KPI helps you evaluate the status of business in an easy-to-view way. The pervasive analytics designer enablesyou to design KPIs of your own based on the following: Queries in SAP Business One, version for SAP HANA Calculation views in the SAP HANA databaseNoteo For a newly created company in SAP Business One 9.2, version for SAP HANA, the compatibility mode isOff, and thus only calculation views are available.o SAP Business One 9.2, version for SAP HANA companies upgraded from versions that have thecompatibility mode feature, will have the same settings for the compatibility mode as the previousversions.o The compatibility mode is On for SAP Business One 9.2, version for SAP HANA companies upgraded fromversions that:o Do not have the compatibility mode featureo Are initializedThus, they will have the previously provided analytic and attribute views.o The compatibility mode is Off for SAP Business One 9.2, version for SAP HANA companies upgradedfrom versions that:o Do not have the compatibility mode featureo Are not initializedThus, only calculation views are available.For more information about the compatibility mode, look for the SAP Business One Administrator's Guide,version for SAP HANA on SAP Help Portal.In the pervasive analytics designer, you can also set up a link between your KPI and an advanced dashboard. Thusthe linked advanced dashboard will appear when you click the KPI in the Fiori-style cockpit or in an advanceddashboard.NoteFor more information about the semantic layer data sources, look for the How to Work with SemanticLayers guide on SAP Help Portal.PUBLIC6 2020 SAP SE. All rights reserved.How to Work with Pervasive AnalyticsWorking with Key Performance Indicators (KPIs)
2.1Designing KPIs Using the Pervasive Analytics DesignerPrerequisites You have installed the app framework for SAP Business One, version for SAP HANA. For more informationabout installing the app framework, look for the Working with App Framework for SAP Business One, versionfor SAP HANA guide on SAP Help Portal. You have authorizations for the pervasive analytics designer. To grant authorizations for the pervasiveanalytics designer to users, from the SAP Business One, version for SAP HANA Main Menu, chooseAdministration System Initialization Authorizations General Authorizations. In the Authorizationswindow, select the user for whom you want to set authorizations, and under Analytics, in Pervasive AnalyticsDesigner select Full Authorization.Procedure1.In the SAP Business One, version for SAP HANA toolbar, choose(Pervasive Analytics).Alternatively, in the SAP Business One, version for SAP HANA menu bar, choose Tools Pervasive Analytics.The Pervasive Analytics window appears.NoteOnly users with authorizations for the pervasive analytics designer can access this window.How to Work with Pervasive AnalyticsWorking with Key Performance Indicators (KPIs)PUBLIC 2020 SAP SE. All rights reserved.7
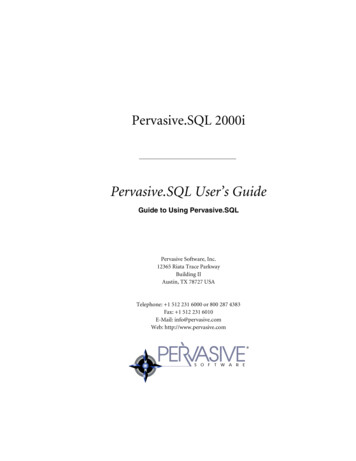
2.On the left side of the Pervasive Analytics window, choose New KPI.The KPI designer appears. The data source section on the left displays the following:o All the system and customized SELECT queries.o All the deployed calculation views in the SAP HANA database.Noteo For a newly created company in SAP Business One 9.2, version for SAP HANA, the compatibility mode isOff, and thus only calculation views are available.o SAP Business One 9.2, version for SAP HANA companies upgraded from versions that have thecompatibility mode feature, will have the same settings for the compatibility mode as the previousversions.o The compatibility mode is On for SAP Business One 9.2, version for SAP HANA companies upgraded fromversions that:o Do not have the compatibility mode featureo Are initializedThus, they will have the previously provided analytic and attribute views.o The compatibility mode is Off for SAP Business One 9.2, version for SAP HANA companies upgradedfrom versions that:o Do not have the compatibility mode featureo Are not initializedPUBLIC8 2020 SAP SE. All rights reserved.How to Work with Pervasive AnalyticsWorking with Key Performance Indicators (KPIs)
Thus, only calculation views are available.For more information about the compatibility mode, look for the SAP Business One Administrator's Guide,version for SAP HANA on SAP Help Portal.3.On the left side of the KPI designer, in the data source section, select the query or view based on which youwant to design a KPI.Its measures, dimensions, and parameters appear.o Measures appear with thelabel.o String type dimensions appear with theo Date type dimensions appear with theo Parameters appear with thelabel.label.label.4.On the Value Settings tab, specify various settings. For more information, see Value Settings Tab.5.[Optional] On the Filter and Parameter tab, specify filters and parameters. For more information, see Filterand Parameter Tab.NoteIf you selected a measure from the KPI Balance Sheet Query, KPI Cash Flow Statement Query, or KPIProfit And Loss Query view, you must add P TemplateInternalKey as a parameter, and add the dimensionKPI Factor Internal Key or KPI Factor Name as a filter. For more information, see Filter and Parameter Taband Using Financial KPI Factors.How to Work with Pervasive AnalyticsWorking with Key Performance Indicators (KPIs)PUBLIC 2020 SAP SE. All rights reserved.9
6.[Optional] If you are designing a KPI that consists of other KPIs, then on the Composite KPI tab, specify thevariables. For more information, see Composite KPI Tab.NoteA KPI value is taken either from the KPI value box on the Value Settings tab or from the expression resulton the Composite KPI tab. Therefore, you cannot both specify a measure in the KPI value box on the ValueSettings tab and design a composite KPI on the Composite KPI tab.PUBLIC10 2020 SAP SE. All rights reserved.How to Work with Pervasive AnalyticsWorking with Key Performance Indicators (KPIs)
7.[Optional] In the preview area, choose Status Displaying and define the display settings. For moreinformation, see Status Displaying Section.How to Work with Pervasive AnalyticsWorking with Key Performance Indicators (KPIs)PUBLIC 2020 SAP SE. All rights reserved.11
8.[Optional] In the preview area, choose Action and add actions to the KPI. For more information, see AddingActions to KPIs.9.To save the KPI, in the upper left corner, choose(Save); to save the KPI as a new one, if you opened anexisting KPI, in the upper left corner, choose(Save As).PUBLIC12 2020 SAP SE. All rights reserved.How to Work with Pervasive AnalyticsWorking with Key Performance Indicators (KPIs)
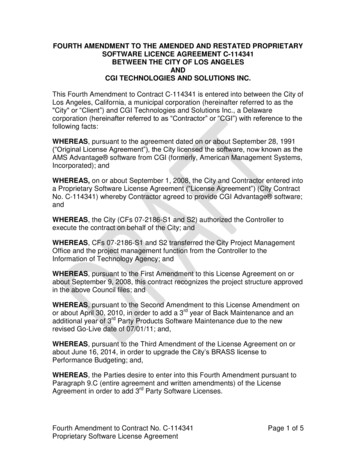
2.1.1Value Settings TabProcedureOn the Value Settings tab, perform the following:1.Specify the KPI name and description.The KPI name appears in the upper left corner of the preview area. The KPI description appears as a tooltipwhen your mouse cursor hovers over the KPI name.2.In the data source section, in a query or view, select a measure and drag it to the value box of the Set KPIValue section.The preview area is refreshed and the sum or average of the KPI value appears.The name of the selected query or view appears in the From Data Source field at the bottom of the Set KPIValue section.3.[Optional] In the data source section, in the same query or view, select a date dimension, and drag it to thedate dimension box of the Set KPI Value section.The preview area is refreshed and the KPI value is calculated according to the date range you specified.How to Work with Pervasive AnalyticsWorking with Key Performance Indicators (KPIs)PUBLIC 2020 SAP SE. All rights reserved.13
4.[Optional] In the Unit dropdown list of the Set KPI Value section, select the unit that you want to display underthe KPI value.The preview area is refreshed and the selected unit appears beside the KPI value. If you customized the unit,you must enter no more than five characters.5.In the Set KPI Goal section, perform the following to define a basic goal or an advanced goal.o To define a basic goal, specify the name or description of the goal, and specify a number as the goal value.o To define an advanced goal, specify the name or description of the goal. If you selected a measure from aview as your KPI value, select a measure from any query as your goal value; if you selected a measurefrom a query as your KPI value, select a measure from any query in the same query category as your goalvalue.The first value of the measure will be the goal value.NoteFor the advanced goal value, you cannot select a measure from queries with parameters.An arrow may appear before the KPI value in the preview area, based on the KPI value and goal value:o If the KPI value is greater than the goal value, an up arrow appears.PUBLIC14 2020 SAP SE. All rights reserved.How to Work with Pervasive AnalyticsWorking with Key Performance Indicators (KPIs)
o If the KPI value is equal to the goal value, nothing appears.o If the KPI value is smaller than the goal value, a down arrow appears.The preview area is refreshed as follows:o The goal name and goal value appear in a tooltip when your mouse cursor hovers over the KPI value.o The appropriate arrow appears before the KPI value.o The color of the arrow and KPI value is updated. The color of the arrow and the KPI value are determinedby the settings in the Status Displaying section and the status of the Smaller Value Is Better checkbox.How to Work with Pervasive AnalyticsWorking with Key Performance Indicators (KPIs)PUBLIC 2020 SAP SE. All rights reserved.15
You can see the color change in the following screenshots when the settings in the Status Displayingsection are the same and the status of the Smaller Value Is Better checkbox is different.PUBLIC16 2020 SAP SE. All rights reserved.How to Work with Pervasive AnalyticsWorking with Key Performance Indicators (KPIs)
NoteIf you have changed any default settings in the Status Displaying section since starting work on the KPI,the status change of the Smaller Value Is Better checkbox will NOT determine the color of the arrow andthe KPI value. If you want to change the color of the KPI arrow and the KPI value, change the settings inthe Status Displaying section.6.[Optional] In the Set KPI Trend section, perform the following to define a basic trend or an advanced trend.o To define a basic trend, select the trend type.ExampleFor the month-over-month basis, the trend value will be the compared percentage between the KPI valueof this month and that of last month. For the month-over-same-month basis, the trend value will be thecompared percentage between the KPI value of this month and that of the same month last year.o For an advanced trend, if you selected a measure from a view as your KPI value, select a measure fromany query as your trend value; if you selected a measure from a query as your KPI value, select a measurefrom any query in the same query category as your trend value.The first value of the measure will be the trend value.NoteFor the advanced trend value, you cannot select a measure from queries with parameters.An arrow may appear before the trend value in the preview area based on the trend value:NoteWhen the denominator in the trend calculation is not a positive number, the following appears in the trendarea.How to Work with Pervasive AnalyticsWorking with Key Performance Indicators (KPIs)PUBLIC 2020 SAP SE. All rights reserved.17
o If the trend value is greater than zero, an up arrow appears.o If the trend value is equal to zero, nothing appears.PUBLIC18 2020 SAP SE. All rights reserved.How to Work with Pervasive AnalyticsWorking with Key Performance Indicators (KPIs)
o If the trend value is less than zero, a down arrow appears.The preview area is refreshed as follows:o The trend name and trend value appear in a tooltip when your mouse cursor hovers over the KPI value.o The trend value appears in the lower right corner of the preview area.o The arrow appears before the trend value.o The color of the arrow is updated. The color of the arrow is determined by the status of the Smaller ValueIs Better checkbox.How to Work with Pervasive AnalyticsWorking with Key Performance Indicators (KPIs)PUBLIC 2020 SAP SE. All rights reserved.19
You can see the color change in the following screenshots when the status of the Smaller Value Is Bettercheckbox is different.PUBLIC20 2020 SAP SE. All rights reserved.How to Work with Pervasive AnalyticsWorking with Key Performance Indicators (KPIs)
NoteIf you have changed any default settings in the Status Displaying section since starting work on the KPI,the status change of the Smaller Value Is Better checkbox will not immediately refresh the preview area.The color of the trend arrow will be refreshed the next time you open this KPI.7.[Optional] To make this KPI unavailable for display in the cockpit, select the Interim checkbox. This meansthat the KPI will only be the component of other KPIs, and will not be available for display in the cockpit.8.[Optional] Select the Smaller Value Is Better checkbox to indicate that the smaller the value than the goalvalue, the better the result, or that if the trend value is less than zero, the result is good. This checkboxdetermines the color settings in the Status Displaying section, thus affecting the following:o Color of the arrow before the trend value.o Color of the following:o Arrow before the KPI value (if the KPI value is not equal to the goal value)o KPI valueNoteIf you have changed any default settings in the Status Displaying section since starting work on the KPI,the following will happen:o The status change of the Smaller Value Is Better checkbox will not immediately refresh the color ofthe trend arrow. The color of the trend arrow will be refreshed the next time you open this KPI.o The status change of the Smaller Value Is Better checkbox will NOT determine the color of the KPIarrow and the KPI value. If you want to change the color of the KPI arrow and the KPI value, changethe settings in the Status Displaying section.9.[Optional] Select the Minus Sign checkbox to add a minus sign in front of the KPI value. The status of thischeckbox, together with the settings in the Status Displaying section, determines the color of the following:o Arrow before the KPI value (if the KPI value is not equal to the goal value)o KPI value2.1.2Filter and Parameter TabPrerequisiteOn the Value Settings tab, you have dragged a measure from a query or view to the value box of the Set KPI Valuesection.Procedure For filters, perform the following:NoteFilters do not apply to the advanced goal or advanced trend.How to Work with Pervasive AnalyticsWorking with Key Performance Indicators (KPIs)PUBLIC 2020 SAP SE. All rights reserved.21
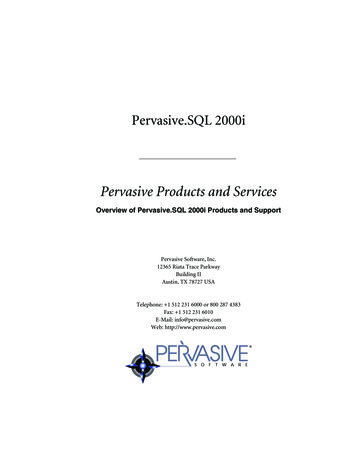
1.In the data source section, in the same query or view from which you dragged the KPI value, select adimension and drag it to the filter box.The Filter Editor window appears.2.In the Filter Editor window, perform the following based on the type of the dimension:o For a string type dimension, select a filtering value, or enter a filtering value and choose the Add Valuebutton.The filtering value is added to the Active Filters section.For string type dimensions, -Current User- appears as a filtering value. If you choose this value, thecode of the logged-on user will be used as the filtering value.NoteWhen the KPI value filtered by certain filtering values has records in the database, then such and onlysuch filtering values appear in the list. If you want to use other filtering values, you need to enter them andchoose the Add Value button.PUBLIC22 2020 SAP SE. All rights reserved.How to Work with Pervasive AnalyticsWorking with Key Performance Indicators (KPIs)
o For a date type dimension, define a time range.3.To save the filter settings, in the Filter Editor window, choose the Add button.The preview area is refreshed according to the added filters.NoteIf you selected a measure from views KPI Balance Sheet Query, KPI Cash Flow Statement Query, or KPIProfit And Loss Query view, you must add P TemplateInternalKey as a parameter, and add the dimensionKPI Factor Internal Key or KPI Factor Name as a filter. For more information, see Using Financial KPIFactors. For parameters, perform the following:1.In the data source section, in the same query or view from which you dragged the KPI value, select aparameter and drag it to the parameter box.The Parameter Editor window appears.2.In the Parameter Editor window, perform the following based on the type of the parameter:o For a date type parameter, specify a default date.How to Work with Pervasive AnalyticsWorking with Key Performance Indicators (KPIs)PUBLIC 2020 SAP SE. All rights reserved.23
o For a number type parameter, specify a default number.o For a string type parameter, specify a default value.3.To save the parameter settings, choose the Add button.The preview area is refreshed according to the added parameters.NoteSome parameters are labeled with a red rectangle. To get a meaningful KPI value, you must drag thoseparameters to the parameter box.PUBLIC24 2020 SAP SE. All rights reserved.How to Work with Pervasive AnalyticsWorking with Key Performance Indicators (KPIs)
2.1.2.1Using Financial KPI FactorsA financial KPI factor links a KPI and an item in the financial report templates. You define financial KPI factors inthe Financial KPI Factor - Setup window. To open this window, from the SAP Business One, version for SAP HANAMain Menu, choose Administration Setup Financials Financial KPI Factors.SAP Business One, version for SAP HANA provides 28 predefined financial KPI factors.In the KPI Balance Sheet Query, KPI Cash Flow Statement Query, and KPI Profit And Loss Query views, themeasures that are defined as the KPI values do not retrieve data directly from the database. Only after youidentify the financial report template in the KPI designer and set the dimension KPI Factor Internal Key or KPIFactor Name as a filter, does the KPI value retrieve data from the financial report template item that is linked tothe financial KPI factor.Using the financial KPI factors in KPIs consists of the following procedures:1.Link a financial KPI factor to an item in the financial report template.2.Identify the financial report template in the KPI designer.3.Set the dimension KPI Factor Internal Key or KPI Factor Name as a filter.PrerequisiteLinked items of the financial report template contain values, and the values belong to the current year.How to Work with Pervasive AnalyticsWorking with Key Performance Indicators (KPIs)PUBLIC 2020 SAP SE. All rights reserved.25
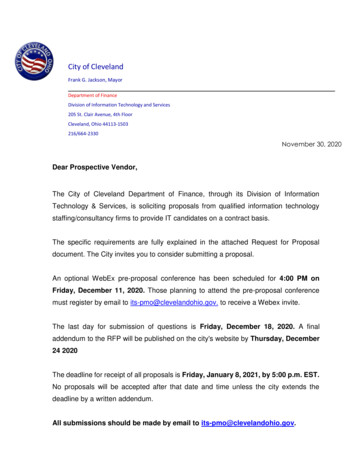
ProcedureTo link a financial KPI factor to an item in the financial report template, follow the procedure below:1.From the SAP Business One, version for SAP HANA Main Menu, choose Financials Financial ReportTemplates.The Financial Report Templates window appears.2.In the Financial Report Templates window, select a template from the Balance Sheet, Profit and Loss, orStatement of Cash Flows report.The template appears on the right.3.In the template, select an item whose data you want to use in the KPI.PUBLIC26 2020 SAP SE. All rights reserved.How to Work with Pervasive AnalyticsWorking with Key Performance Indicators (KPIs)
4.In the Financial KPI Factors section, in the Factor field, enter the factor code, or press T a b to select a factor.5.To save the link, in the Financial Report Templates window, choose the Update button.ProcedureTo identify the financial report template in the KPI designer, follow the procedure below:1.In the SAP Business One, version for SAP HANA menu bar, choose View System Information.When you hover your mouse over fields in windows, you can view system information in the left-hand cornerof the status bar.2.From the SAP Business One, version for SAP HANA Main Menu, choose Financials Financial ReportTemplates. From the Report dropdown list, select the required financial report.3.From the Template dropdown list, select the template.How to Work with Pervasive AnalyticsWorking with Key Performance Indicators (KPIs)PUBLIC 2020 SAP SE. All rights reserved.27
4.Hover your mouse over the template name.The system information appears in the status bar, and the first number is the template code.5.In the data source section of the KPI designer, in the same query or view from which you dragged the KPIvalue, select P TemplateInternalKey, and drag it to the parameter box.6.In the Parameter Editor window, enter the template code that you got from the system information of thetemplate.7.To identify the financial report template in the KPI designer, choose the Add button.PUBLIC28 2020 SAP SE. All rights reserved.How to Work with Pervasive AnalyticsWorking with Key Performance Indicators (KPIs)
ProcedureTo set the dimension KPI Factor Internal Key or KPI Factor Name as a filter, follow the procedure below:1.In the data source section, in the same query or view from which you dragged the KPI value, select KPI FactorInternal Key or KPI Factor Name, and drag it to the filter box.The Filter Editor window appears, displaying all the financial KPI factors that contain values.2.In the Filter Editor window, select the available financial KPI factor, or enter a financial KPI factor code (if youdragged the KPI Factor Internal Key dimension) or financial KPI factor name (if you dragged the KPI FactorName dimension), and choose the Add Value button.The financial KPI factor is added to the Active Filters section.3.To save the filter settings, choose the Add button.The preview area is refreshed and the KPI value is retrieved from the financial report template item.How to Work with Pervasive AnalyticsWorking with Key Performance Indicators (KPIs)PUBLIC 2020 SAP SE. All rights reserved.29
2.1.3Composite KPI TabThe data source section of the Composite KPI tab displays all the KPIs in the database, including interim KPIs.NoteNested composite KPI is not supported. Example of a nested composite KPI is as follows:Expression K01 K02, K02 K03 04. You can use the following instead: Expression K01 K03 K04.The following expressions are supported: " " (plus sign), "-" (minus sign), "*" (multiply sign), "/" (divide sign), "()"(bracket).ProcedureOn the Composite KPI tab, perform the following:1.From the KPI list section, drag a KPI to the variable box.The dragged KPI is labeled as a variable.2.In the Expression field, specify the expression using the variables.The preview area is refreshed and the result of the calculated expression appears as the KPI value.PUBLIC30 2020 SAP SE. All rights reserved.How to Work with Pervasive AnalyticsWorking with Key Performance Indicators (KPIs)
2.1.4Status Displaying SectionProcedureIn the Status Displaying section, perform the following:1.Select the separator type.2.In the two value boxes, perform the following based on the separator type you selec
Pervasive dashboard: With queries and views, you can easily design pervasive dashboards and related actions that are customized to your specific needs. You can view the pervasive dashboard and use its actions in the advanced dashboard or the cockpit. Advanced dashboard: You can design advanced dashboards to contain various widgets.