Transcription
Trends in Community College Enrollment andCompletion Data, Issue 5Jolanta JuszkiewiczMay 2019American Association of Community Colleges Washington, DC
American Association of Community CollegesPREFERRED CITATIONJuszkiewicz, J. (2019, May). Trends in Community College Enrollment and Completion Data, Issue 5.Washington, DC: American Association of Community Colleges.For more information, contact:Jolanta Juszkiewicz, Ph.D.Director of Policy AnalysisAmerican Association of Community CollegesOne Dupont Circle, NW, Suite 700Washington, DC 20036Phone: 202-416-4502E-mail: jjuszkiewicz@aacc.nche.eduCOPYRIGHT2019 American Association of Community Colleges2Trends in Community College Enrollment and Completion Data, Issue 5
American Association of Community CollegesThis is the fifth in a series of American Association of Community Colleges analyses of trends in community college enrollments and exploration of completion rates. The latter feature graduation rates andoutcome measures published by the U.S. Department of Education and the National Student Clearinghouse’s completion rates.Overview and HighlightsThe U.S. Department of Education (ED) and theNational Student Clearinghouse (NSC) releaseannual reports on higher education fall enrollment and student outcomes. ED data are institution-based, whereas the NSC data are basedon student-level information. Both use the samepostsecondary institutional classificationsi categorizing community colleges as public 2-year institutions, which facilitates comparisons. As such,they exclude those colleges that confer somefour-year degrees, but primarily award associatedegrees and certificates—i.e., what most peoplethink of as a community college. For purposesof this report, however, the terms “public 2-yearinstitutions” and “community college” are usedinterchangeably.Following the peak enrollment in fall 2010, overallhigher education enrollment continued to declinethrough fall 2017, in some sectors more thanothers. Four-year public and private non-profitinstitutions have experienced very small growthover that time. Projections through 2027 showa modest growth in postsecondary enrollment,including at community colleges, but not to thelevels experienced in the aftermath of the economic downturn.1Major findings of this report include: Between fall 2016 and 2017, the decline inenrollment continued nationwide in communitycolleges, although the decrease was less pro-nounced than in previous years for both menand women, all age categories, and regardless ofenrollment intensity. Community college enrollment is projected tostart increasing over the next decade, but notreaching the peak of fall 2011. The official IPEDS graduation rate for community colleges, which measures completion of thefirst-time, full-time cohort for 150% of “normaltime,” grew by more than 20% in the past decade, from 21.9% to 26.6%. The NSC community college completion ratefor full-time-only students, which is the mostcomparable to ED’s official graduation rate, is61%, or more than two times higher than ED’s.The NSC tracks students for 6 years rather thanED’s 3 years. The new ED 8-year completion rate, referredto as an outcome measure, is 30% at the sameinstitution for the cohort of full- time, first-timecommunity college students. Full-time, non-firsttime students had the highest completion rateat the same institution, 38%.Trends in Community College EnrollmentED collects and reports institutional-level datafrom postsecondary Title-IV eligible institutionsfor fall enrollment.ii In fall 2017, and for the fourthstraight year, overall enrollment in postsecondaryinstitutions declined by about 89,000. This wasmodest compared to a drop of more than 165,000The Integrated Postsecondary Education Data System (IPEDS) classifies postsecondary institutions into nine categories based on controland level. spx. Control categories are public, private not-for-profit, and private for-profit. Thelevel categories, based on the highest degree awarded, are 4-year and higher (4 year), 2-but-less-than 4-year (2 year), and less than 2-year.iFor the 2017 fall enrollment, the data collection occurred in spring 2018. Another survey collects 12-month unduplicated enrollment for thesame institutions.ii3Trends in Community College Enrollment and Completion Data, Issue 5
American Association of Community Collegesleges, has generally eased (Table 1). Some of thisbetween 2015 and 2016. Decreases in overall enis attributable to the more than halving in therollment were primarily driven by declining enrollenrollment losses at for-profit institutions, fromments at for-profit and public 2-year institutions.a 14.5% decrease between the fall of 2015 andPublic 2-year college enrollments declined less2016, to a 7.1% decrease the following fall. Thethan 3% for the third consecutive year. Betweenchange in community college enrollment has beenfall 2016 and fall 2017, enrollment fell by about112,000. This was three and a half times less than considerably less drastic during the same period.However,the mostrecentFull-time,NSC data,which mayt h e c o hbetweeno r t o f fullcollegestudents.non-first-timethe 389,000fordecreasefall time,2015 first-timeand 2016.communitybeata theprecursorto the IPEDS38%.fall 2018 enrollmentstudentshadinstitutionsthe highestexperiencedcompletionaratesame institution,Private, for-profit4-yearfigures, show another dip in overall enrollmentsmuch sharper decline from the previous fall.2and a substantial decline of 3.2%, the largest dropTheNSC enrollmentdata areCollegemore currentthanTrendsin CommunityEnrollmentsince fall 2015, in community college enrollment.that of ED. At about the same time that ED presIt would be premature, however, to say that this isentsfall 2017enrollmentdata, NSC publishesED collectsandreports institutional-leveldata from postsecondaryTitle-IVfall inthe beginningof aeligibletrend institutionsor simply afor1-year2anenrollment.estimate ofInfallThe NSCfall year,fall 20182017,enrollment.and for the fourthstraightoverall enrollment in postsecondary ttleabatedeclined by about 89,000. This was modest compared to a drop of more than 165,000 between 2015As Tabledriven2 shows,NCS fall enrollmentofatselectmentin decliningoverallinenrollmentsor commuDecreasesoverall enrollmentwere primarilyby decliningenrollmentsfor-profitand 2016.groups rollments.Less Publicenrollmentandcollegepublic 2-yearinstitutions.2-year volatilitycollege enrollmentsdeclined lessfor the onalagestuwasevident,in fall4-yearinstitutions,year.Betweenhowever,fall 2016 and2017,publicenrollmentfell by about 112,000. This was three and a half times less than the 389,000dentinstitutionsenrollmentexperiencedmoved into ate,a much territorysharper declinedecrease between fall 2015 and 2016. Private, for-profit 4-yeariian uptick, however small, of 0.3%, only to declinefor-profitsince the previfrom the institutions—15.1%previous fall.3again by a factor of 10 (3.0%) in the past year. Notous fall. ED and NSC data are comparable in theis the6% risein thatenrollmentof studentsgeneralof datachangesin enrollmentThe NSCdirectionenrollmentis morecurrent thanacrossthat of ED.shownAt aboutthe sametimeED presentsfall ;however,theydiffersomewhatintermsenrollment data, NSC publishes an estimate of fall 2018 enrollment. The NSC fall 2018 enrollment numbersof dualenrollmentprogramsofindicatethe intensityof the increasesand decreases.little abatementin decliningo v e r a l l e n r o l l mthee nimportancet s o r communitycollegeenrollments.Less tocommunitycollegeLittleseparated(Table1). volatility was evident, however, in 4-year publicand aenrollments.continued rollmentpatternsofmenandwomenasin private, for-profit institutions—15.1% since the previous fall. ED and NSC data are comparable in theWhile enrollment trends have not been linear inwellas thoseattendingpart-timefull-timehowever,theydiffer somewhatin versusterms ofthegeneral direction of changes in enrollment across sectors;recent years, according to IPEDS the decrease inbetween fall 2016 and 2017. This changed beintensity of the increases and decreases. (Table 1)total enrollment, including at community colTable 1: Percent Changes in Fall Enrollment by Select Institutions, 2015-2018Percent Change from Previous YearTotal Fall EnrollmentFall 2015Fall 2016Fall 2017Fall Year Public -Year Public -3.2%While enrollment trends have not been linear in recent years, according to IPEDS the decrease in totalenrollment, including at community colleges, has generally eased. (Table 1) Some of this is attributable tothe more than halving in the enrollment losses Trendsat for-profitinstitutions,from a 14.5%decreasein CommunityCollege Enrollmentand CompletionData, Issue 5between the fall of 2015 and 2016, to a 7.1% decrease the following fall. The change in community
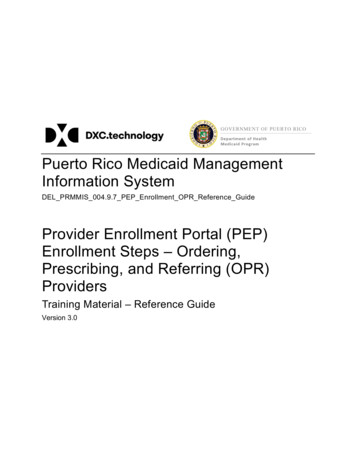
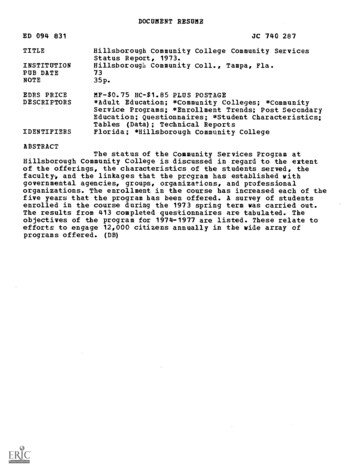
American Association of Community increase.beginning of a trend or simply a one-year .5%-1.5%-1.5%-4.7%-4.7%AsAsTable2 tintensity)hasfluctuatedtweenfall2017In fall 2018,the declineFTE was4,382,957.In 2027,the FTEatfluctuatedthese ollmentwas morethandoublethat of movedtutionsprojectedto be3,801,000.small,0.3%,onlybybya Does e menasaswellwellThe importance of completing a program of and earning a postsecondary credential in andsimilarly,similarly,full-timefull-timeED projects that starting in fall 2017, the full-timeand tomorrow’s economy is virtually dents.attendees declined at twice the rate part-time students.equivalent enrollment at public 2-year institutions dispute. However, there is no universal measurewill cease to decline and inch up steadily for theof program completion. The U.S. Department ofProjectionsProjectionsnext decade through 2027. At least for fall 2018Education is statutorily compelled by the Studentthat prediction does not appear accurate, basedRight to Know and Campus Security Act lceaseceaseon NSC data. According to ED, the rate of increase 542)of 19905 attorequireTitle-IVeligible predictiondoesdoesnotnotisprojectedtoinchbe upanemic,atforlessthanadecadefractionof or abasedcumulativeincreaseof 2.8%in statute,the ars.(Figure1)Afterrisingof one1).percentor a cumulativeof 2.8percent overtenTheyyears.include(Figure a1)cohortAfter rising10a fractionyears (FigureAfterannually,rising tentlysinceFTE),1995the(2,994,592FTE), atthepublicenrollment atpublic 2-yearinstitutionspeakedin degree-seekingfall 2010, timecertificateandiv year institutions peaked in fall 2010, when thestudents who complete their programs within5,000,0005,000,000FIGUREFIGURE1:1: NSIN PUBLIC 2-YEAR 0,0001,000,000--33519671967 19721972 19771977 19821982 19871987 19921992 19971997 20022002 20072007 20122012 20172017 20222022 20272027Trends in Community College Enrollment and Completion Data, Issue 5
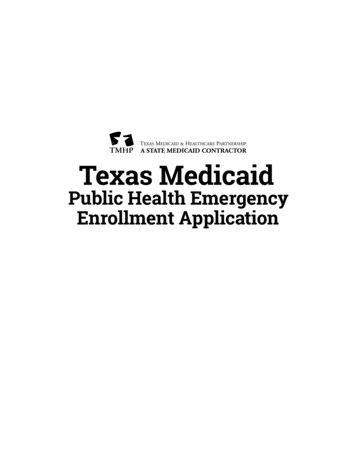
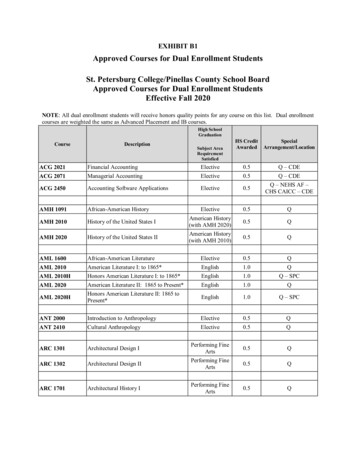
American Association of Community Colleges150% of the “normal” time to completion. For2-year associate degree programs, therefore, thegraduation rate counts students who completewithin 3 years. The graduation rate does notinclude either students who transfer in or, moreimportantly, those who transfer out—a critical exclusion from the community college perspective.Given the realities facing community collegestudents, the 3-year window for them to complete2-year programs is clearly inadequate. AACC strongly supports statutory creation of a communitycollege graduation rate of 300% of the normal timeto completion, and the inclusion of transfers-out.This would more accurately measure communitycollege student success and align with the AACC-ledVoluntary Framework of Accountability (VFA).6To address the flaws in this narrowly definedgraduation rate, ED added several new cohortsfor which completion is measured under newOutcome Measures. In late 2018, ED releaseddata from both the Outcome Measures (OM)7and Graduation Rate surveys that are part of theIntegrated Postsecondary Education Data System(IPEDS). The long-awaited OM help paint a moreaccurate picture of student success at communitycolleges than the graduation rate.Outcome Measures (OM) consist of four studentcohorts, including the historic one used for thegraduation rate, namely, full-time, first-time students. The other three cohorts include part-time,first-time; full-time, non-first-time; and part-time,non-first-time students. Unlike the graduationrate, which tracks completion at 150% of normaltime, OM tracks completion at two points: 6 yearsand 8 years after students matriculated.Graduation and 6-Year Completion RatesBetween 2010 and 2014, the official ED public2-year graduation rate, which follows first time,full time students until 150% of normal time tocompletion, increased substantially, from 21.1%to 26.6% (Figure 2). Although causality cannot be6determined, this increase is almost certainly duein part to community colleges’ increased emphasison student completion.ED also is now reporting graduation rates for students with different types of student financial aid.For cohort years 2011 and 2014, depending onthe level of institution, completion rates are calculated for Pell Grant recipients, subsidized loanborrowers who are not Pell Grant recipients, andstudents who are neither Pell Grant recipients norsubsidized loan borrowers. Pell Grant recipientsat 2-year public institutions graduated at a lowerrate than those who borrowed direct subsidizedloans and those who neither received Pell Grantsnor took out subsidized loans, 23% compared to27.4% and 31.5%, respectively (Figure 3). This isnot surprising; Pell Grant students are low-incomestudents, who consistently complete college atlower rates than more affluent individuals.Completion rates calculated by NSC differ fromED’s graduation rates. Regardless of programlength, NSC tracks 6-year outcomes. Anothermajor difference between the two rates is theinstitution(s) used in the completion/graduationmeasure. ED’s graduation rate uses only one institution, the institution at which a student startedcollege. In comparison, NSC tracks students acrossall institutions attended during the 6-year period.According to the NSC’s completion report8 (Figure4), 28% of all community college students—fulltime and less than full-time--who started in thefall of 2012 completed their program at the sameinstitution within 6 years. An additional 3.3% completed at a different 2-year institution and 8.1%completed at a 4-year institution. All told, within6 years, about four out of 10 community collegestudents, regardless of attendance intensity, completed a program either at the starting institutionor a different institution. An additional 16% ofthese students were still enrolled in a communitycollege or 4-year institution after 6 years.Trends in Community College Enrollment and Completion Data, Issue 5
21.9%22.0%22.1%22.5%21.9%21.8%21.1% American21.2%23.5%25.4%26.6%Association of Community CollegesFigure 2: IPEDS Graduation Rate at Public 2-Year InstitutionsCohort Years 6.6%2014ED also is now reporting graduation rates for students with different types of student financial aid. For cohortyears 2011 and 2014, depending on the level of institution, completion rates are calculated for Pell Grantrecipients, subsidized loan borrowers who are not Pell Grant recipients, and students who are neither Pell Grantrecipients nor subsidized loan borrowers. Pell Grant recipients at 2-year public institutions graduated at a lowerrate than those who borrowed direct subsidized loans and those who neither received Pell Grants nor took outsubsidized loans, 23.0% compared to 27.4% and 31.5%, respectively. (Figure 2) This is not surprising – Pell Grant2004low-income2005 students,2006 who20072008 complete2009 college2010 at lower2011rates 20122013students areconsistentlythan moreaffluent2014individuals.ED also is now reporting graduation rates for students with different types of student financial aid. For cohort3: IPEDS onGraduationof 2014Cohortratesat are calculated for Pell Grantyears 2011 andFigure2014, dependingthe level of byTypeofAidReceivedrecipients, subsidized loan borrowers who are not Pell Grant recipients, and students who are neither Pell Grantrecipients nor subsidized loan borrowers. Pell Grant recipients at 2-year public institutions graduated at a lowerrate than those who borrowed direct subsidized loans and those who neither received Pell Grants nor took out31.5% – Pell Grantsubsidized loans, 23.0% compared to 27.4% and 31.5%, respectively. (Figure 2) This is not surprising27.4%students are low-incomestudents, who consistently complete collegeat lower rates than more affluent26.6%23.0%individuals.According to theFigureNSC’s completionreportviii (Figure3), 28%of allCohortcommunity3: IPEDS GraduationRateof 2014at college students – full-time andless than full-timePublic– who 2-Yearstarted inthefallof2012completedtheirprogramInstitutions by Type of Aid Received at the same institution within 6years. An additional 3.3% completed at a different 2-year institution and 8.1% completed at a 4-year institution.All told, within 6 years about four out of 10 community college students, regardless of attendance intensity,All StudentsPell GrantDirect Subsidized Loan,Neither Pell norcompleted a program either at the starting institution or a differentAn additional16%Loansof nts were still enrolled in a community college or 4-year institutionafter627.4%26.6%Completion rates calculated by NSC differ f23.0%r o m E D ’ s g r a d u a t i o n r a t e s . Regardless of programFigure4: NSCAnother6 YearmajorOutcomesforbetweenStudentsStarted2012 used inlength, NSC tracks 6-yearoutcomes.differencethe whotwo ratesis the lmentIntensitythe completion/graduation measure. ED’s graduation rate uses only one institution, the institution at which a100%student started college. In comparison, the NSC tracks students across all institutions attended during the 6-yeartimeframe.90%580%All Students46.2%37.3%Pell GrantDirect Subsidized Loan,Not Pell45.4%Not EnrolledNeither Pell norSubsidized LoansStill Enrolled70%Completion rates calculated by NSC1.9%differ f r o m E D ’71.1%s g r a d u a t i o n r a t e s . Regardless of program60%3.1%length, NSC tracks 6-year outcomes. Another major difference between the two rates is the institution(s) used inCompleted at11.4%theED’s graduation rate uses only one institution, the institutionat2-Yearwhich aDifferent50%completion/graduation measure.14.6%Institutionstudent startedcollege. In comparison, the NSC tracks students across all institutionsattendedduring the 6-year20.4%40%timeframe.Completed at3.3%30%50%746.3%20%10%3.7%8.0%8.1%27.9%All Students9.7%1.2%0.5%17.4%Exclusively Full-Time Exclusively Part-TimeDifferent 4-YearInstitutionCompleted atStarting Institution22.4%Mixed EnrollmentTrendsstudentsin CommunityCollegeexclusivelyEnrollmentand CompletionData, Issue 5The completion rate was much higher for community collegewho attendedfull-time–46.3% at the same institution. Using a 6-year window instead of the “official” 3-year window (150% of normal
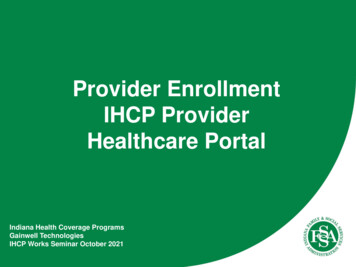
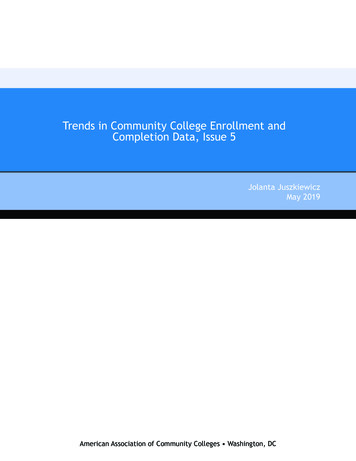
American Association of Community CollegesFigure 5: Graduation Rates of First-Time, Full-Time Students Who Startat Public 2-Year Time,Full-TimeStudentsWhoStart2012 (NSC - 300%) and 2013(IPEDS- 100%,150% and200%)at Public 2-Year Institutions2012 (NSC - 300%) and 2013 Cohorts (IPEDS - 100%, 150% and 5.3%13.6%100%150%200%300% Transfers100%150%200%300% TransfersFigure 6: NSC Six-Year Outcomes for Students Who Started Fall 2012 atPublic 2-Year Institutions by Sex, Age, and RaceFigure 6: NSC Six-Year Outcomes for Students Who Started Fall 2012 atPublic 2-Year Institutions by Sex, Age, and RaceCompleted %5.3% 17.6%3.2%5.3% 19.0%19.0%StartingInstitutionCompleted atStartingCompleted atInstitutionDifferent 4YearCompleted atInstitutionDifferent 4CompletedatYearDifferent2InstitutionYearCompleted atInstitutionDifferent 2StillYearEnrolledInstitutionStill Enrolled0%TheThecompletionrate was much higher for comversus NCS’s 46.3% completion rate). The comple6-year completion rate differed by student sex, age, and race as follows (Figure 4): (1) women had a highermunitycollegestudentswho attendedexclusivelytionat anyinstitutionstudents,than men—42.4%and 37.5%,respectively;andrate(2) adultlearners(thoseforoverfull-timeage 24) wer completion rate than those 20 or younger, (but higher than students between ages 20 and 24 – 28.6%),6-yearinsteadof s onlyfaintlythanmen—42.4%and n34.5%windowcomparedto etalonethepublic.American students, 48.1% versus 27.5%. Attending part-time lowered the completion rate across all theseand (3)inwhite34.5%comparedto 42.3%,inrespectively,surecompletionresulteda 20% increasethe students had a 20% higher completion rate than sus27.5%.Attendingcompletion rate (i.e., ED’s 26.6% graduation ratepart-time lowered the completion rate across all thesestudent categories.787Trends in Community College Enrollment and Completion Data, Issue 5
American Association of Community CollegesThe 6-year completion rate differed by studentsex, age, and race as follows (Figure 6): (1) womenhad a higher completion rate than men—42.4%and 37.5%, respectively; (2) adult learners (thoseover age 24) had a lower completion rate thanthose 20 or younger (but higher than students between ages 20 and 24 —28.6%), 34.5% comparedto 42.3%, respectively; and (3) white students hada 20% higher completion rate than African American students, 48.1% versus 27.5%. Attending parttime lowered the completion rate across all thesestudent categories.State DifferencesThere is much state variation within the nationalcompletion rate. According to the NSC, for thefall 2012 cohort,9 of the 41 states whose public2-year institutions were included in the reportedcompletion rates (N 41), 24 were greater thanthe overall rate of 39.3% and 17 had lower rates.In four states the completion rate exceeded 50%:South Dakota, North Dakota, Minnesota and Iowa.In Minnesota, 82.3% of full-time community college students completed within 6 years, comparedto the national 60.8% completion rate. In ninestates, more than seven out of 10 students attending full-time completed their programs (Minnesota, South Dakota, North Dakota, Illinois, Florida,Wisconsin, California, Virginia, and Iowa).Georgia had the highest completion rate for thosewho attended exclusively part-time, 39.9%, whichwas higher than the national completion rate forall students, regardless of attendance intensity(39.3%). Nationally, 19.2% of exclusively part-timestudents complete, but in four states more than athird of those students completed their programswithin 6 years (Georgia, Wisconsin, Minnesota,and Kentucky).States also varied with respect to the percentageof students who completed their program at theentering institution or transferred and complet-ed at another 2- or 4-year institution, as well asby age and sex. South Dakota was the only statewhere more than half of community college students completed at the starting institution. At theother extreme, only 18.4% of students attendingArizona public-2-year institutions completed attheir original institution.South Dakota was the only state with completionrates above 50% for all age groups, younger than20, between 20 and 24, and older than 24 (70.6%,57.0%, and 53.5%, respectively). The traditionalage students, those entering college right afterhigh school, had the highest completion rate. Inaddition to South Dakota, eight other states hadcompletion rates above 50% for those youngerthan 20: North Dakota, Minnesota, Iowa, Florida,Montana, Wisconsin, Wyoming, and Illinois. Mississippi was not far behind at 49.6%.For the 20- to 24-year-old group, only two states—South Dakota and North Dakota—had completionrates above 50% (57.0% and 50.2%, respectively). Students older than 24 had completion ratesgreater than 50% in three states: South Dakota(53.5%), Georgia (51.7%), and Minnesota (51.4%),with Wisconsin being nosed out by a fraction ofone percent (49.7%).Women had a higher overall completion rate thanmen, 42.3% compared to 37.5%. Women alsoout-performed men in all but two of the statesfor which there were data. Men in Arkansas andGeorgia completed at a higher rate than women,both by about 2%. In 10 states, more than half ofwomen completed their programs in 6 years ateither their entering institution or one into whichthey transferred: South Dakota, North Dakota,Minnesota, Iowa, Montana, Wisconsin, Wyoming,Florida, Kansas, and Illinois.iii Men had completionrates of 50% or higher in only three states: SouthDakota, North Dakota, and Minnesota (64.6%,59.0%, and 52,6%, respectively). Close behindwere Wisconsin (49.5%) and Iowa (49.3%).Kansas and Montana were designated by NSC as states with only medium (80-89%) historical coverage; the others were states with highhistorical coverage of 90% or higher. SCSignatureReport16 StateSupp.pdfiii9Trends in Community College Enrollment and Completion Data, Issue 5
American Association of Communit
Trends in Community College Enrollment ED collects and reports institutional-level data from postsecondary Title-IV eligible institutions for fall enrollment.2 In fall 2017, and for the fourth straight year, overall enrollment in postsecondary institutions declined by about 89,000. This was modest compared to a drop of more than 165,000 between .