Transcription
ACKNOWLEDGEMENTSThis document is submitted to the state GO Virginia Board by the Region 2 Council. Prepared inaccordance with state Growth and Diversification plan guidelines, this plan was developed throughsubstantive research and thoughtful deliberation on economic conditions and opportunities in the region.Work on the plan began last spring with the inception of the Council. Data on the economy and labormarkets, benchmarking of peer regions, and a complete analysis of existing regional economic andworkforce development plans were presented to the Council at its first meeting. This provided a baselinefor follow up meetings in each of the three areas that make up Region 2. In those fact-finding sessionsregional leaders briefed the Council on their area’s conditions and contributions to the Region 2economy.At the same time, issue-based work groups were formed. These consisted of Council members and civicleaders with specific expertise and interests, who met to discuss approaches to economic growth anddiversification. On-line surveys were also distributed to expand sources of input into the conversation.These steps were instrumental in developing a rigorous understanding of strategic approaches and howthe region might measure success in this program. This deliberative process informed goals andobjectives found in this plan, as well as regionally-specific criteria for allocating GO Virginia funding.This plan represents an extensive body of work completed over a short span of time. None of this wouldhave occurred without the committed service of leaders from business, education, government and nonprofits who have participated in the council and its work groups. These individuals are listed in theappendices of this report and have our appreciation for their contributions. Further thanks go to theleaders of our nine regional economic development, planning, and workforce organizations. Theirprevious research provided a strong starting point for this plan, and their fresh insights offered during thefact-finding process were appreciated. Lastly, we wish to thank Council staff for the energy and insightsthey brought to the process.Dr. Raymond SmootAb BoxleyChairVice-ChairAcknowledgementsi
TABLE OF CONTENTSAcknowledgements . iTable of Contents . iiList of Figures and Tables . iiiExecutive Summary . ivSection 1: Regional Demographics and Growth Data . 1Demographics . 1Economic Growth . 3Firm Growth, Employment and Primary Industries . 5Section 2: Regional Economic Drivers and Clusters. 9Manufacturing Cluster. 13Life Sciences and Health Care Cluster . 15Food and Beverage Processing Cluster. 16Emerging Technology and IT Cluster . 18Section 3: Regional Priorities . 21Talent Development and Retention . 23Sites and Buildings . 28Entrepreneurship and Business Development . 33Technology Development . 37Section 4: Assessment Criteria . 42First stage screening assessment . 42Second stage screening . 43Section 5: Implementation and Sustainability . 45Implementing the Plan and Advancing GO Virginia Goals . 45Proposed GO Virginia Region 2 Peer Regions . 48Closing . 50Appendix A: Industry Cluster Definitions . 51Appendix B: Additional Workforce Demand Data . 56Appendix C: Region 2 Membership: Council Members and Working Groups . 65Table of Contentsii
LIST OF FIGURES AND TABLESFigure 1: Region 2 1996, 2006, and 2015 Annual Graduates by Degree and Percent Change in Graduates. 2Figure 2: Employee Commuting Patterns . 3Table 1: Population and Population Growth . 3Table 2: Real GRP and Percent Change, from 2001 - 2007, 2008 - 2015, and 2001 -2015 . 4Figure 3: Annual Change in Average Personal Income . 5Figure 4: Total Annual Jobs Created, and Percent from Old and Young Firms . 5Figure 5: Unemployment Rate . 6Figure 6: Total Employment and Share by Industries in Region 2 . 6Table 3: Employment by Industry, and 2001, 2016 Average Hourly Wage . 7Table 4: Total Jobs Supported by Exports in Region 2 . 8Figure 7: Top Contributors to Gross Regional Product (GRP) . 9Figure 8. Region 2 Target Industry Clusters--GRP, LQ and Shift-Share . 10Table 5. Region 2 Industry Cluster Performance Trends . 11Table 6. Comparative Industry Cluster Trends . 11Table 7. Industry Cluster Sales and Demand, Region 2 . 12Table 8: Key Manufacturing Cluster Occupations. 14Table 9: Key Life Science and Health Care Cluster Occupations . 15Table 10: Key Food and Beverage Processing Cluster Occupations . 17Table 11: Key Emerging Technology and IT Cluster Occupations . 20Table 12. Region 2 Strengths, Opportunities, Challenges. 21Figure 9: GO Virginia Region 2 Institutes of Higher Learning, Universities, Colleges, Community Colleges,and Training Centers . 24Table 13: Region 2 Assets, Strengths, and Challenges. 26Table 14: Region 2 Strategies, Potential Activities, and Example Metrics . 26Figure 10: Select examples of sites and special assets . 31Table 15. Sites and Buildings Development Strategies . 32Figure 11: Region 2 Startup Presence and Employment . 34Figure 12: Sampling of Accessible Capital for Region 2 Companies . 35Table 16: Mentorship and Training Assets in Region 2. 35Table 17: Entrepreneurship and Business Development Strategies . 36Table 18. Target Cluster Assets . 38Table 19. Technology Development Strategies . 40Table 20. Possible GOVA Region 2 Peer Regions . 49List of Figures and Tablesiii
EXECUTIVE SUMMARYGO Virginia’s objectives, as set by the state, are simple and provide a clear path for action. The programseeks to grow jobs that pay higher than the regional median wage, primarily through investment that isnew to Virginia. This requires a focus on industries with high growth potential, featuring in-demandoccupations with higher wages.This Growth and Diversification plan, written for GO Virginia Region 2, provides a roadmap for utilizing GOVirginia funding for projects across this region, which includes the Lynchburg, New River Valley, andRoanoke-Alleghany sub-regions. Each of these areas has a strong history of local cooperation, and someexperience with interregional collaboration, primarily between the New River and Roanoke Valleys.Together however, they all share many economic similarities: traditional industry strengths inmanufacturing, transportation, and agriculture; emerging technology sectors; mixed urban and ruralcharacteristics; and higher education and health care as economic and employment drivers.This plan documents the concentration of different industries across this footprint, their job growth ratescompared to the nation, their contributions to gross regional product, the number of higher than medianwage jobs available in these industries, and assets unique to the region that drive opportunity.The analysis of that data identifies four priority “clusters”—or geographic concentrations of businesseswith common markets, suppliers, technologies, and workforce needs. These four interrelated industriesoffer the greatest potential for sustainable, scalable, future growth in the region: ManufacturingLife sciences and health careFood and beverage processingEmerging technology and ITTogether these clusters provide more than 100,000 jobs, almost one-third the total in the region. In thenext five years that number is expected to grow at a rate higher than the rest of the economy. Themedian hourly wage across the four clusters is 22, also exceeding the rest of the economy. Theseclusters also generate close to 10 billion in economic activity, or slightly more than one-third of grossregional product.To grow economic opportunity in these clusters, the plan identifies core strategies in four focus areas.1. Talent or workforce development, attraction, and retention, which includes strengthening thepipeline from all levels of education to careers in the region, increasing the completion of relevantdegrees, increasing the knowledge and access to complementary workforce and training services, andincreasing employer engagement across the system.2. Collaborative development of sites and buildings, which includes improving information about oursupply of real estate and market demand, incentivizing collaboration among localities at all stages ofdevelopment, and building partnerships to leverage the development potential of special assets likeresearch facilities.Executive Summaryiv
3. Entrepreneurship and business development, which includes growing the presence of and access tocapital investors, expanding and better coordinating programs for mentorship and business training,and improving awareness of existing capital, mentorship & training resources.4. Technology development, which includes increasing investments for innovative technologies,expanding rates of research commercialized in the private sector, supporting talent attraction effortsfocused on individuals with technological skills, and growing the number of individuals enteringtraining and education programs that develop technological skills.The plan includes specific success metrics for projects that may be proposed in each of these focus areas.Such projects must connect to these strategies, promote higher paying jobs in the priority clusters,include substantive matching funds, and most importantly demonstrate an innovative and forwardlooking approach that doesn’t simply represent business as usual.Executive Summaryv
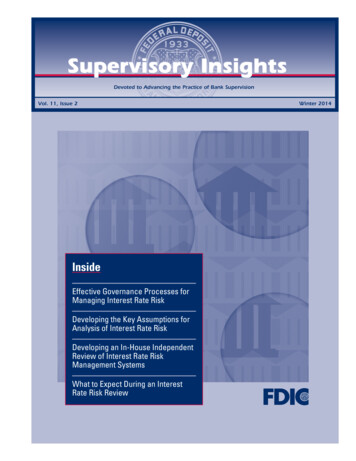
SECTION 1: REGIONAL DEMOGRAPHICS AND GROWTH DATARegion 2 of GO Virginia is located in western Virginia and spans across three metropolitan statistical areas(MSAs) and regional commissions: the Lynchburg, New River Valley, and Roanoke-Alleghany regions. Intotal, Region 2 is comprised of 18 jurisdictions including thirteen counties and five independent cities. 1The region’s population of 777,919 is about 9% of Virginia’s 2016 total population. 2The region’s industries provided roughly 6% 3 of the state’s gross domestic product (GDP) in 2015. 4Historically manufacturing, trade, transportation, and utilities industries have played a significant role inthe region’s economic activity, but recently the region has experienced growth in the health andeducation sectors. Along with this shift in economic activity, the region has experienced a 167% growth(1996 – 2015) in annual postsecondary graduates, growth driven by the region’s higher educationinstitutions. The region’s growth in higher education and diversification in economic activities suggeststhe region is primed to take advantage of increases in investment outlined in GO Virginia.DemographicsFrom 1996-2016, the region’s population grew by 14.7% (Table 1), a slower rate of growth than the state(24.4%) and nation (20.3%). 5 Similar to national trends, Region 2 has a growing senior population withaging baby boomers. A distinct characteristic in this region, however, is the large college-age populationthat is 20-24 years old (9.2% of all age cohorts in 2016). 6 While the population of college-age or earlycareer residents (20 to 34 year olds) in the region increased by 12% since the beginning of the GreatRecession in 2008, the population of mid- to late-career individuals (35 to 54 year olds) decreased by11%. 7 This demographic trend reflects the region’s postsecondary education institutions attracting ayounger population, although the region may be failing to retain these individuals or to attract mid-careerworkers and families.The increase in the supply of postsecondary graduates is driven by the growth of the two publicuniversities (Virginia Tech and Radford University); several private institutions (including LibertyUniversity, Jefferson College of Health Sciences, Hollins University, Lynchburg College, Randolph College,Roanoke College, Ferrum College, and Sweet Briar College); and four community colleges (New RiverCommunity College, Virginia Western Community College, Dabney S. Lancaster Community College, andCentral Virginia Community College). From 1996 -2015, the region has supplied more than 370,000graduates with at least an associate’s degree or a certificate (Figure 1). There has been a 46% increase inCounties include Alleghany, Amherst, Appomattox, Bedford, Botetourt, Campbell, Craig, Floyd, Franklin, Giles,Montgomery, Pulaski, and Roanoke. Independent cities include Covington, Lynchburg, Radford, Roanoke, and Salem2U.S. Census Bureau (2017). Retrieved from hhtp://cra.gmu.edu/go-virginia3GRP data is available for three Metropolitan Statistical Areas only. We’ve include the Blacksburg – Christiansburg –Radford, Lynchburg, and Roanoke MSAs found in the region. Alleghany County and the City of Covington are notpart of the Roanoke MSA, so we have underestimated total contribution to state GPD.4U.S. Bureau of Economic Analysis (BEA; 2017). GRP by State and by Metropolitan Area. Retrieved fromhttps://www.bea.gov/regional/index.htm5U.S. Census Bureau (2017). Retrieved from hhtp://cra.gmu.edu/go-virginia6EMSI 2017.3; Quarterly Census of Employment and Wages (QCEW) Employees7EMSI 2017.3; QCEW Employees1Section 1: Regional Demographics and Growth Data1
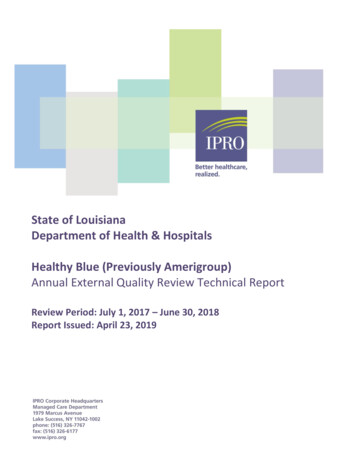
the annual number of graduates receiving a degree since 2006. All degrees have increased over this time(including associates, certificates, bachelors, and professional and graduate degrees). The annual numberof graduates receiving a graduate and professional degree has increased in particular from 3,067 to 6,467(111%). This increase is due in part to a surge in graduates during and after the recession, whenindividuals delayed entering the labor market.Figure 1: Region 2 1996, 2006, and 2015 Annual Graduates by Degree and Percent Change in Graduates 8Despite the decline in the number of Region 2 workers in the 35 to 54 year old demographic, a labor-shedanalysis reveals the region’s workers include a growing number of commuters from just outside theregion. The number of total commuters has increased for the past 15 years, and between 2008 and 2014net commuter inflow grew to 17,039 people, an increase of 20%. 9 Of the 325,627 workers in Region 2,77% live in the region and 23% commuted into the region for work. 10 Moreover, the region’s threemetropolitan statistical areas are connected through intra-regional commuting, as illustrated in Figure 2.8Dept of Education, NCES IPEDS, adjusted for non-resident programsUS Census Bureau, Longitudinal Employer-Household Dynamics OnTheMap, 2002, 2008, and 2014. Retrieved fromhttps://onthemap.ces.census.gov/10US Census Bureau (2014) Longitudinal Employer-Household Dynamics OnTheMap, Retrieved fromhttps://onthemap.ces.census.gov/9Section 1: Regional Demographics and Growth Data2
Figure 2: Employee Commuting Patterns 11Economic GrowthSimilar to population growth, the region’s total economic output has increased more slowly than thestate and nation. The region displayed 8% growth in real gross regional product (GRP) from 2001 – 2015,compared to 25% growth in Virginia and 26% in the US (Table 2). Within the region, there have beendifferences in economic performance, with the Blacksburg-Christiansburg-Radford MSA being thesmallest MSA in terms of real GRP but having the fastest growth rates in the region (Table 2).Table 1: Population and Population Growth 12Population(1996)Population(2016)Cumulative Change(1996 - 2016)Avg. AnnualGrowth RateRegion 24.4%1.1%United States268,582,017 323,127,513 20.3%0.9%11Source: US Census Bureau, Longitudinal Employer-Household Dynamics OnTheMap, 2014. Retrieved fromhttps://onthemap.ces.census.gov/. Note: Overlay arrows do not indicate directionality of worker flow betweenhome and employment locations.12U.S. Census Bureau (2017). Retrieved from hhtp://cra.gmu.edu/go-virginiaSection 1: Regional Demographics and Growth Data3
Table 2: Real GRP and Percent Change, from 2001 - 2007, 2008 - 2015, and 2001 -201513Real GRP (millions of2009 chained dollars)Growth in Real GRP200120152001 - 20072008 - 2015 2001 - sburgRadford MSA 145,0965,88818.2%5.3%15.5%Lynchburg MSA 157,8448,2869.4%-2.4%5.6%Roanoke MSA 17.6%6.3%24.7%United States12,735,110 16,094,516 16.2%9.4%26.4%Region 2 TotalSome GRP growth may be due to increases in state expenditures. In per capita terms, cumulativeexpenditure growth has increased by 18% since 2001, from 2,806 to 3,309 (accounting for inflation).Spending is not evenly distributed, however. Eleven localities had positive changes in state expendituresfrom 2001-2016 (Alleghany, Amherst, Botetourt, Craig, Franklin, Giles, Montgomery, Pulaski, Roanoke,Radford City and Salem City), while per capita state expenditures declined in seven jurisdictions(Appomattox, Bedford, Campbell, Floyd, Covington City, Lynchburg City and Roanoke City). 17Slow change in personal wealth is another reflection of slower economic growth. The region’s populationexperienced relatively slow year-to-year growth of personal income since 1996 (Figure 3). Averagepersonal income, however, increased by 26% from 30,258 to 38,005 (1996-2015). 18 Wealth varieswithin Region 2. In 2015, five localities had above the regional average personal income per capita(Roanoke City, Salem City, Bedford, Botetourt and Roanoke Counties). Three localities had an averagepersonal income per capita lower than 34,000 (Radford, Amherst and Montgomery Counties). Note thatRadford and Montgomery have high proportions of post-secondary students, which skews incomenumbers.13BEA (2017). GDP by State and by Metropolitan Area. Retrieved from https://www.bea.gov/regional/index.htmIncludes Radford City, Montgomery, Pulaski, Giles, and Floyd Counties15Includes Lynchburg City, Amherst, Appomattox, Campbell, and Bedford Counties16Includes Roanoke City, Salem City, and Craig, Franklin, Botetourt, and Roanoke Counties17Virginia Auditor of Public Accounts. Retrieved from hhtp://cra.gmu.edu/go-virginia18U.S. Census Bureau (2017). Retrieved from hhtp://cra.gmu.edu/go-virginia14Section 1: Regional Demographics and Growth Data4
%20112%20132015-2%Figure 3: Annual Change in Average Personal Income 19Firm Growth, Employment and Primary IndustriesAnother economic indicator is the health of regional firms, measured as firm destruction and creation,and the age of firms. Overall, firm creation has declined by 26% since 1996, with a particularly significantdecline during the recession. 20 Meanwhile, the number of firms closing has remained relativelyconstant. 21 Figure 4 shows the total jobs created annually (primary vertical axis) and the percent of jobscreated (secondary vertical axis) from old and young firms. Young firms are five years old or less, while oldfirms are over ten years old. Region 2’s employment growth is due largely to the expansion of old firms.From 1999-2015 young firms provided on average, just 21% of annual job creation. Region 2 isunderperforming when compared to state and national levels, which show young firms on averageaccount for 24% and 27% of total new jobs, respectively.Total Jobs Created90,000100%Total Jobs Created90%80,00080%70,00070%60,00060%Percent from Old rcent From Young Firms1999200120032005Percent Job Created100,00010%200720092011201320150%Figure 4: Total Annual Jobs Created, and Percent from Old and Young Firms 22Region 2’s unemployment rate has bounced back since the recession, and is lower than the nationalunemployment rate (Figure 5). Since the recession, the unemployment rate has fallen 4.2% from peakunemployment of 8.8% in 2010. Though the region has maintained a lower unemployment rate relative19BEA (2017). Retrieved from hhtp://cra.gmu.edu/go-virginiaU.S. Census Bureau (2017). Longitudinal Business Database (LBD). Retrieved from https://www.census.gov21U.S. Census Bureau (2017). LBD. Retrieved from bd.html22U.S. Census Bureau (2017). Longitudinal Employer-Household Dynamics LEHD, QCEW. Retrieved fromhhtp://cra.gmu.edu/go-virginia20Section 1: Regional Demographics and Growth Data5
to the nation, unemployment has remained higher compared to the state. The total amount of jobs haveincreased by 6% since 1996 (Figure 6). These low unemployment and job growth numbers suggest theregion’s ability to adapt from an economic downturn compared to the nation, however the numbers mayalso include individuals who are underemployed. Underemployed workers includes those individuals whoare highly skilled but working in low paying jobs, low skill jobs, or as part-time workers who would preferto be full time.6.3%5.3% 5.8%5.3%5.1%3.3% 3.6%19962006United States4.2% 4.6%2016VirginiaRegion 2Figure 5: Unemployment Rate 10%12%15%GovernmentTrade, transportation, and utilitiesEducation and health servicesOther8%20%Total uringProfessional and business servicesLeisure and hospitalityFigure 6: Total Employment and Share by Industries in Region 2 24Figure 5 outlines the total employment and the employment share of the region’s largest industries.Shares of employment from the government sector; the trade, transportation, and utilities sector; theprofessional and business services sector; and the leisure and hospitality sector have remained relativelyconstant throughout the last two decades. However, the historically important manufacturing sector hasdeclined since 1996. Over the same time, the region saw increased employment shares from theeducation sector, and the health care and social services sector.This economic diversification is at least partly a result of the recession. Industries hit hardest by therecession included the construction, information, and manufacturing sectors, in which jobs decreased21%, 32%, and 8% respectively from 2008-2016. Since these jobs are susceptible to economic booms and23U.S. Bureau of Labor Statistics (2017). Retrieved from hhtp://cra.gmu.edu/go-virginia24 U.S. Bureau of Labor Statistics (2017). Retrieved from http://cra.gmu.edu/go-virginia; EMSI 2017.3 Class ofWorker dataset, Retrieved from http://www.economicmodeling.com. Note: Other includes natural resource,mining, construction, information, and other services industries.Section 1: Regional Demographics and Growth Data6
busts, shifting away from these jobs represents more financial security for the region’s workforce;however, these industries also generally pay higher wages (Table 3), with median hourly earnings abovethe regional median ( 18.66). Meanwhile, the quickly growing education sector tends to pay less than 18.66 an hour on average, or 38.9K annually. Crop and animal production (i.e. natural resources),education, health care and social assistance, leisure and hospitality, and other services have gainedworkers (Table 3). Despite a 4% decline since its 2007 employment peak (66,817), the trade,transportation, and utilities sector is still the largest employing sector in Region 2, largely due to retailtrade. However, the industry as a whole pays substantially less than median wage. 25Table 3: Employment by Industry, and 2001, 2016 Median Hourly Wage 26Median Hourly Wage(2016)% Change in Jobs(2008-2016)Natural Resources and facturing43,610(8%)20.17Trade, Transportation and Financial Services14,331(7%)21.34Professional and Business Services37,365(5%)21.38Educational Services16,42962%16.21Health Care and Social Assistance46,63413%22.14Leisure and Hospitality32,2857%10.44Other Services15,3584%15.67Federal Government7,401(7%)24.95State Government17,419(15%)22.47Local dustryEmployment(2016)25EMSI 2017.3 Class of Worker dataset. Retrieved from: http://www.economicmodeling.comEMSI 2017.3 Class of Worker dataset. Retrieved from: http://www.economicmodeling.com. Industry median wagewas constructed by taking the weighted average of median wages for all occupations making up 0.1% or greater ofthe industry sector.26Section 1: Regional Demographics and Growth Data7
In addition to having the highest hourly wages (on average), the manufacturing sector provides thelargest amount of jobs supported by exports. Traded industries, such as manufacturing, sell many of theirproducts out of region and produce more regional economic impact from outside revenues than do nontraded industries. Non-traded, or local, industries include health care, food services, residentialconstruction, and personal services. Non-traded industries are interrelated, may share worker
University, Jefferson College of Health Sciences, Hollins University, Lynchburg College, Randolph College, Roanoke College, Ferrum College, and Sweet Briar College); and four community colleges (New River Community College, Virginia Western Community College, Dabney S. Lancaster Community College, and Central Virginia Community College).