Transcription
PSYCHROMETRIC CHART FUNDAMENTALSPsychrometric s.38Description of the Psychrometric Chart.39The Abridged Psychrometric Chart.40Examples of Air Mixing Process.42Air Conditioning Processes.Heating Process .Cooling Process .434344Humidifying Process.Basic Process .Steam Jet Humidifier .Air Washes .Vaporizing Humidifier .Cooling and Dehumidification .Basic Process .Air Washes .Dehumidification and Reheat .Process Summary .44444649505151515253ASHRAE Psychrometric Charts.5337ENGINEERING MANUAL OF AUTOMATIC CONTROL
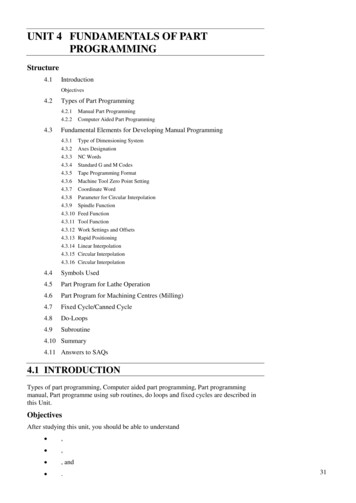
PSYCHROMETRIC CHART FUNDAMENTALSINTRODUCTIONchanges in relation to the performance of automatic HVACcontrol systems. The chart is also useful in troubleshooting asystem.This section provides information on use of the psychrometricchart as applied to air conditioning processes. The chart providesa graphic representation of the properties of moist air includingwet- and dry-bulb temperature, relative humidity, dew point,moisture content, enthalpy, and air density. The chart is used toplot the changes that occur in the air as it passes through an airhandling system and is particularly useful in understanding theseFor additional information about control of the basicprocesses in air handling systems, refer to the Air HandlingSystem Control Applications section.DEFINITIONSMoisture content (humidity ratio): The amount of watercontained in a unit mass of dry air. Most humidifiersare rated in grains of moisture per pound of dry airrather than pounds of moisture. To convert pounds tograins, multiply pounds by 7000 (7000 grains equalsone pound).To use these charts effectively, terms describing thethermodynamic properties of moist air must be understood.Definition of these terms follow as they relate to thepsychrometric chart. Additional terms are included for devicescommonly used to measure the properties of air.Adiabatic process: A process in which there is neither lossnor gain of total heat. The heat merely changes fromsensible to latent or latent to sensible.Relative humidity: The ratio of the measured amount ofmoisture in the air to the maximum amount of moisturethe air can hold at the same temperature and pressure.Relative humidity is expressed in percent of saturation.Air with a relative humidity of 35, for example, isholding 35 percent of the moisture that it is capable ofholding at that temperature and pressure.British thermal unit (Btu): The amount of heat required toraise one pound of water one degree Fahrenheit.Density: The mass of air per unit volume. Density can beexpressed in pounds per cubic foot of dry air. This isthe reciprocal of specific volume.Saturation: A condition at which the air is unable to hold anymore moisture at a given temperature.Dew point temperature: The temperature at which watervapor from the air begins to form droplets and settlesor condenses on surfaces that are colder than the dewpoint of the air. The more moisture the air contains,the higher its dew point temperature. When dry-bulband wet-bulb temperatures of the air are known, thedew point temperature can be plotted on thepsychrometric chart (Fig. 4).Sensible heat: Heat that changes the temperature of the airwithout changing its moisture content. Heat added toair by a heating coil is an example of sensible heat.Sling psychrometer: A device (Fig. 1) commonly used tomeasure the wet-bulb temperature. It consists of twoidentical thermometers mounted on a common base.The base is pivoted on a handle so it can be whirledthrough the air. One thermometer measures dry-bulbtemperature. The bulb of the other thermometer isencased in a water-soaked wick. This thermometermeasures wet-bulb temperature. Some models provideslide rule construction which allows converting thedry-bulb and wet-bulb readings to relative humidity.Dry-bulb temperature: The temperature read directly on anordinary thermometer.Isothermal process: A process in which there is no change ofdry-bulb temperature.Latent heat: Heat that changes liquid to vapor or vapor toliquid without a change in temperature or pressure ofthe moisture. Latent heat is also called the heat ofvaporization or condensation. When water isvaporized, it absorbs heat which becomes latent heat.When the vapor condenses, latent heat is released,usually becoming sensible heat.ENGINEERING MANUAL OF AUTOMATIC CONTROL38
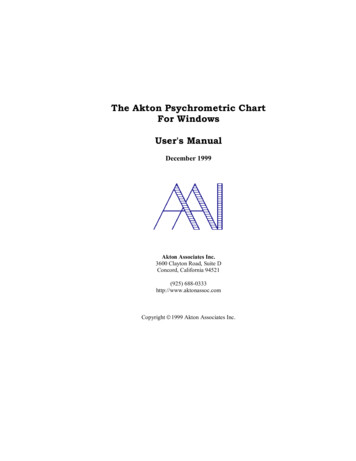
PSYCHROMETRIC CHART FUNDAMENTALSWATER-SOAKED WICKDRY-BULB THERMOMETERHANDLEWET-BULB THERMOMETERPIVOTRELATIVE HUMIDITY SCALEC1828Fig. 1. Sling Psychrometer.Wet-bulb temperature: The temperature read on a thermometer with the sensing element encased in a wet wick(stocking or sock) and with an air flow of 900 feetper minute across the wick. Water evaporation causesthe temperature reading to be lower than the ambientdry-bulb temperature by an amount proportional tothe moisture content of the air. The temperature reduction is sometimes called the evaporative effect.When the reading stops falling, the value read is thewet-bulb temperature.Although commonly used, sling psychrometers cancause inaccurate readings, especially at low relativehumidities, because of factors such as inadequate airflow past the wet-bulb wick, too much wick wettingfrom a continuous water feed, thermometer calibrationerror, and human error. To take more accurate readings,especially in low relative humidity conditions,motorized psychrometers or hand held electronichumidity sensors are recommended.Specific volume: The volume of air per unit of mass. Specificvolume can be expressed in cubic feet per pound ofdry air. The reciprocal of density.The wet-bulb and dry-bulb temperatures are the easiestair properties to measure. When they are known, theycan be used to determine other air properties on apsychrometric chart.Total heat (also termed enthalpy): The sum of sensible andlatent heat expressed in Btu or calories per unit of massof the air. Total heat, or enthalpy, is usually measuredfrom zero degrees Fahrenheit for air. These values areshown on the ASHRAE Psychrometric Charts inFigures 33 and 34.DESCRIPTION OF THE PSYCHROMETRIC CHARTThe ASHRAE Psychrometric Chart is a graphical representation of the thermodynamic properties of air. There are fivedifferent psychrometric charts available and in use today:Chart No. 1 —Normal temperatures, 32 to 100FChart No. 2 —Low temperatures, –40 to 50FChart No. 3 —High temperatures, 50 to 250FChart No. 4 —Normal temperature at 5,000 feet abovesea level, 32 to 120FChart No. 5 —Normal temperature at 7,500 feet abovesea level, 32 to 120FChart No. 1 can be used alone when no freezing temperaturesare encountered. Chart No. 2 is very useful, especially inlocations with colder temperatures. To apply the lower rangechart to an HVAC system, part of the values are plotted onChart No. 2 and the resulting information transferred to ChartNo. 1. This is discussed in the EXAMPLES OF AIR MIXINGPROCESS section. These two charts allow working within thecomfort range of most systems. Copies are provided in theASHRAE PSYCHROMETRIC CHARTS section.39ENGINEERING MANUAL OF AUTOMATIC CONTROL
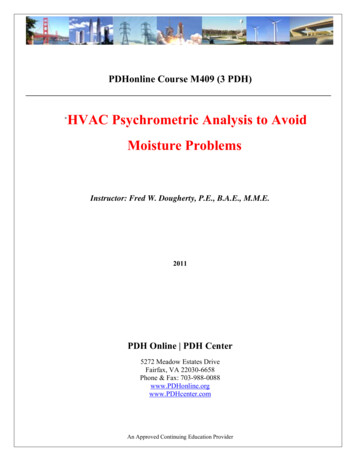
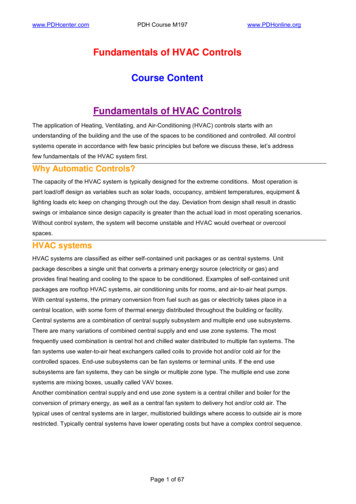
PSYCHROMETRIC CHART FUNDAMENTALSTHE ABRIDGED PSYCHROMETRIC CHARTThe chart also contains a protractor nomograph with thefollowing scales:— Enthalpy/humidity ratio scale— Sensible heat/total heat ratio scaleFigure 2 is an abridged form of Chart No. 1. Some of thescale lines have been removed to simplify illustrations of thepsychrometric processes. Smaller charts are used in most ofthe subsequent examples. Data in the examples is taken fromfull-scale chartsWhen lines are drawn on the chart indicating changes inpsychrometric conditions, they are called process lines.The major lines and scales on the abridged psychrometricchart identified in bold letters are:— Dry-bulb temperature lines— Wet-bulb temperature lines— Enthalpy or total heat lines— Relative humidity lines— Humidity ratio or moisture content lines— Saturation temperature or dew point scale— Volume lines in cubic feet per pound of dry airWith the exception of relative humidity, all lines are straight.Wet-bulb lines and enthalpy (total heat) lines are not exactlythe same so care must be taken to follow the correct line. Thedry-bulb lines are not necessarily parallel to each other andincline slightly from the vertical position. The purpose of thetwo enthalpy scales (one on the protractor and one on the chart)is to provide reference points when drawing an enthalpy (total.03050.028HUMI80RERE75- 01040.008.00635.004.002M10306Fig. 2. Abridged Chart No. 1.ENGINEERING MANUAL OF AUTOMATIC CONTROL4050.0162550451001535DRY BULB - F65ONRATISATU13.055IR45105RDITY0000 -1OF50DUNPORPEU—BTPY25ENTH20%60 60554080UFE-C3085UM0100E hH U NT H A L P Y WMIDITY RATI O40DRY0ST H H0.1 LVO-0.1.5-0-0.31500 -4-2. .00-1.014.50200IBLAL E H E0.4H E ATAT3.00.2002.04.0NS TSE T O5000 300.60.5-%1.01.00.81204585HUMIDITY RATIO(W) - POUNDS OF MOISTURE PER POUND OF DRY AIR15.060.02630
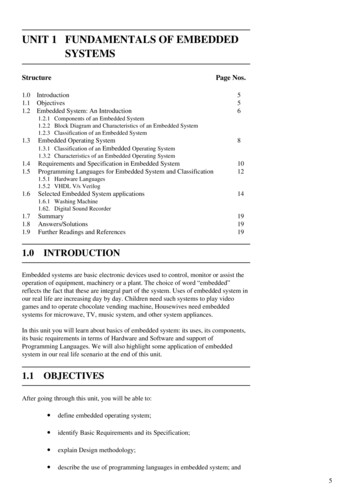
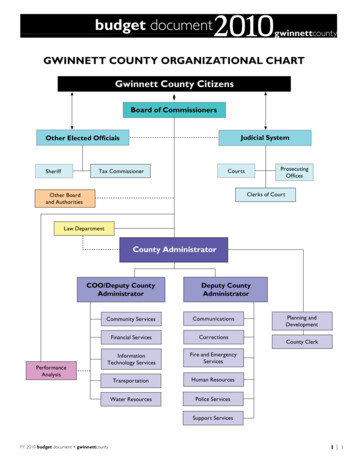
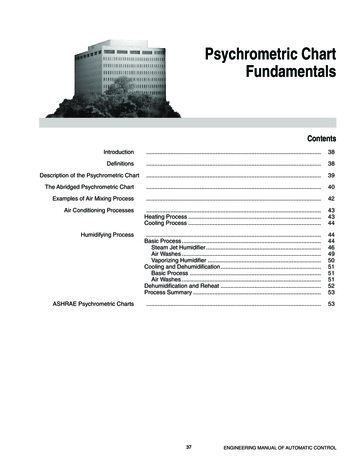
PSYCHROMETRIC CHART FUNDAMENTALSheat) line. The protractor nomograph, in the upper left corner,is used to establish the slope of a process line. The mechanicsof constructing this line are discussed in more detail in theSTEAM JET HUMIDIFIERS section.60% RH31.6 BTU/LBDThe various properties of air can be determined from the chartwhenever the lines of any two values cross even though allproperties may not be of interest. For example, from the pointwhere the 70F dry-bulb and 60F wet-bulb lines cross (Fig. 3,Point A), the following additional values can be determined:C0.012 LB/LB62.5 F DPBA67.5 F WB13.8 CF/LBE 77 F DBC1830Fig. 4.26.3BTU/LBDFigure 5 is the same as Figure 4 but is used to obtain latentheat and sensible heat values. Figures 4 and 5 indicate that theenthalpy (total heat) of the air is 31.6 Btu per pound of dry air(Point D). Enthalpy is the sum of sensible and latent heat (LineA to E Line E to D, Fig. 5). The following process determineshow much is sensible heat and how much is latent heat. Thebottom horizontal line of the chart represents zero moisturecontent. Project a constant enthalpy line to the enthalpy scale(from Point C to Point E). Point E enthalpy represents sensibleheat of 18.7 Btu per pound of dry air. The difference betweenthis enthalpy reading and the original enthalpy reading is latentheat. In this example 31.6 minus 18.7 equals 12.9 Btu per poundof dry air of latent heat. When the moisture content of the airchanges but the dry-bulb temperature remains constant, latentheat is added or subtracted.56% RH13.505 CF/LBCA0.0088 LB/LBB54 F DP60 F WB70 F DBC1829Fig. 3.— Relative humidity is 56 percent (Point A)— Volume is 13.505 cubic feet per pound of dry air(Point A)— Dew point is 54F (Point B)— Moisture content is 0.0088 pounds of moisture per poundof dry air (Point C)— Enthalpy (total heat) is 26.3 Btu per pound of dry air(Point D)— Density is 0.074 pounds per cubic foot (reciprocal ofvolume)31.6 BTU/LBDLATENT HEATB60% R.H.18.7 BTU/LBEFigure 4 is another plotting example. This time the dry-bulbtemperature line and relative humidity line are used to establishthe point. With the relative humidity equal to 60 percent andthe dry-bulb temperature at 77F (Fig. 4, Point A), the followingvalues can be read:— Wet-bulb temperature is 67.5F (Point A)— Volume is 13.8 cubic feet per pound of dry air (Point A)— Dew point is 62.5F (Point B)— Moisture content is 0.012 pounds of moisture per poundof dry air (Point C)— Enthalpy is 31.6 Btu per pound of dry air (Point D)— Density is 0.0725 pounds per cubic foot (reciprocal ofvolume)SENSIBLEHEATAC 77 F DBC1831Fig. 5.41ENGINEERING MANUAL OF AUTOMATIC CONTROL
PSYCHROMETRIC CHART FUNDAMENTALSEXAMPLES OF AIR MIXING PROCESScovers the –40 to 50F temperature range. This is the temperaturerange immediately below that of Chart No. 1. Note that there isan overlap of temperatures between 35F and 50F. The overlapis important when transferring values from one chart to another.The following examples illustrate use of the psychrometricchart to plot values and determine conditions in a ventilatingsystem. The examples also show how to obtain the same resultsby calculation. Example A requires only Chart No. 1. ExampleB requires both Charts No. 1 and
psychrometric chart. DESCRIPTION OF THE PSYCHROMETRIC CHART The ASHRAE Psychrometric Chart is a graphical represen-tation of the thermodynamic properties of air. There are five different psychrometric charts available and in use today: Chart No. 1 — Normal temperatures, 32 to 100F Chart No. 2 — Low temperatures, –40 to 50F