Transcription
International Journal of Computer Applications (0975 – 8887)Volume 117 – No. 8, May 2015Decision Support System for the Stock Market usingData Analytics and Artificial IntelligenceAjinkya M. VaidyaNikunjkumar H. WaghelaSneha S. YewaleInformation TechnologyPune Vidyarthi Griha’s COETPune, IndiaInformation TechnologyPune Vidyarthi Griha’s COETPune, IndiaInformation TechnologyPune Vidyarthi Griha’s COETPune, IndiaABSTRACTThe stock market is a complex, non-stationary and chaoticdynamic system. It is a popular investment platform that appealsto a wide variety of masses. While the stock market remains asignificant way to earn profit, it is often considered one of themost risky forms of investment due to the underlying nature ofthe financial domain and a host of various factors that oftenelude the attention of naïve investors. The stock market is ahostile environment that demands undivided attention to theevents that transpire throughout the day along with a certainconsideration to the effects of the past and the implications onthe future. Hence, many investors, face (or stand a risk) offailure on a daily basis. Therefore, the need of the hour is aDecision Support System (DSS) that takes into account markettrends, financial analysis and strategies to identify the best timeto purchase stocks and the actual stocks to purchase. This paperhighlights the above concerns regarding the volatile stock marketand discusses the implementation of a DSS taking into accountthe modern and sophisticated techniques of Data Analytics likeClustering and forecasting models like Holt-Winters. Also, theDSS uses popular supervised learning algorithm usedextensively in machine learning and Artificial Intelligence, thePerceptron. While the data analytics form the initial stage of theDSS, the decision-making will be aided by the Perceptron, whichwould consider the results of the aforementioned analysis andvarious local stock market parameters and a host of statisticalconcepts. This will culminate in a comprehensive DSS that willassist the potential investors in the most important aspect ofsuccess in the stock market i.e. decision-making.KeywordsDecision Support System (DSS), Data Analytics, Clustering,Holt-Winters, Supervised Learning, Machine Learning, ArtificialIntelligence, Perceptron.1. INTRODUCTIONA stock market is an entity that facilitates the trading betweenbuyers and sellers. The stocks are listed on the stock exchangewhere they represent the entities and the multinationalcorporations from all around the world. It is basically a place totrade stocks.The stock market is witness to all kinds of investors fromindividuals to small and large scale companies. Many companieshave their stocks listed on the stock exchange signifying that thecompany is now public and investors can purchase a stake in it.As the investors purchase a stock, the volume decides theamount of stake that the investors have in the said company. Thestock market has since become a major way for a company toraise money. Unlike other investments, results and return oninvestments is relatively instant which is an attractive feature ofthe stock market.History has shown that the price of stocks is an important part ofthe overall economic activity, and can influence or be anindicator of the current social mood [1]. Usually, stock marketcorrelates directly with the state of the economy. Hence, animportant stock market means that the country is well-developedor is an equally important economy in the context of the world.The stock market reflects the current economic state along withother socio-political factors of the country. Some of the majorstock exchanges in the world are New York Stock Exchange(NYSE, US), NASDAQ (US), Japan Exchange Group (JPX,Japan), National Stock Exchange of India (NSE, India) etc.What makes a stock market unique is that even though a stockmight be trading at a high rate; there is no guarantee that thestock market will remain the same. Although a number of thingscan help one assess a stock, no one can predict exactly how astock will perform in the future. There is even no guarantee thata company that has a stock listed today will even remain in thebusiness tomorrow [2]. The stock prices often fluctuate and theinvestors have to be extremely aware of the window ofopportunity that arises to earn profit [3]. Now, this windowarises randomly and investors might have to wait a long time forit. There are many such subtle facts and traits about the stockmarket which makes it an extremely unwelcoming environmentfor beginners. The huge amount of stocks listed in the exchangeand the unbelievable pace at which the transaction occur renderbeginners catatonic. The investor is thrown into this frenzywithout any guidance and just the sheer pressure on him forceshim to take rash and otherwise unwise decisions [4]. Probably, atthis hour, every beginner and for that matter any investor wouldappreciate all the help he gets in making the right decision. It iswith this thought, the Decision Support System (DSS) isproposed.2. EXISTING SYSTEMSThe stock market, which has been investigated by variousresearchers, is a rather complicated environment. Investors facehigher risks compared to other form of financial investmentswhen they invest in stock market. Many people have tried topredict the movement of share prices and beat the market but noone can really accurately predict the movement of a particularshare prices for company listed in the stock exchange. No twoexisting systems are identical; each one provides a unique priceand feature point. Hence, the problem of compatibility of databetween different systems arises. All the existing systems requireproper data with specific attribute from stock data. Data is rarelytested on the live market and identification of these attributes isnot easy.There has been an attempt from Information Technology (IT)professionals to exploit the stock price prediction area throughthe Artificial Intelligence (AI) approach. There have been manyapproaches in this field, including advanced techniques but nocomprehensive system has been developed. The fields of DataMining, Artificial Neural Network (ANN) and RegressionAnalysis have been used to attempt a comprehensive system [5]21
International Journal of Computer Applications (0975 – 8887)Volume 117 – No. 8, May 2015[6]. Along with these various Genetic Algorithms, Time SeriesAnalysis, Fuzzy Neural Networks have also been proposed. Aprototype model, Multilevel and Interactive Stock MarketInvestment System (MISMIS) has been also been proposed toforecast stock prices. In the current years of development in thefield of data mining, it is considered that the partitionedclustering technique is well suited for analyzing stock prices.The best-known partitioning clustering algorithm is the K-meansalgorithm and its variants, as this algorithm is simple,straightforward and is based on the firm foundation of analysisof variances. In addition to the K-means algorithm, otheralgorithms such as Particle Swarm Optimization (PSO) are beingproposed [7][8][9]. Particle Swarm Optimization is anothercomputational intelligence method that has already been appliedto image clustering and other low dimensional datasets. Yet, asof now no comprehensive singular system has been developed tosupport decision making for the Stock Market.2.1 MERITS OF EXISTING SYSTEMSThe existing systems are not up to mark but they do have thefollowing advantages: The partitioned clustering technique is well suited forclustering a large document dataset due to theirrelatively low computational requirements andincrease in the gradual performance of the system [9].The time factor complexity of the partitioningtechnique is almost linear, because of which it iswidely used.Many algorithms are simple, straightforward and arebased on the firm foundation of maximizing variances.2.2 DEMERITS OF EXISTING SYSTEMSThe existing systems have a number of flaws, which need to berectified so as to build a comprehensive system capable ofdecision-making. Some of the disadvantages of existing systemsare as follows: The stock market, which has been investigated by variousresearchers, is a rather complicated environment andnormal techniques of data mining only lead us to a part ofthe solution.The various factors, local to the stock market are notconsidered while designing these systems, which are ofprime importance while investing in the stock market.The existing systems are not built to suit the trading style orstrategies of a particular user.Existing system do not allow individual users to do fundamentalscanning and screening of stocks.3. DECISION SUPPORT SYSTEM (DSS)A decision support system (DSS) is a computer based systemthat supports decision making activities. While academics haveperceived the DSS as a tool to support decision-making process,DSS users also see the DSS as a tool to facilitate organizationalprocesses [10][11]. A well constructed DSS takes into account avariety of factors like extracting raw data, a comprehensiveknowledge base, support for user queries and some intuitivethinking based on the domain of the said query.Three fundamental components of a DSS are [12]:1.2.Knowledge baseBusiness Logic (the user entered query and theassociated thinking)3.User interface.The proposed decision support system works in the followingstages: Stage I:o Gathering of historical prices of a given stock forpredefined time interval.o Gathering of local stock market parameters for agiven stock.Stage II:o Processing of historical prices using Data Analyticsi.e. clustering.o Interpretation of stock parameters.Stage III:o Forecasting of Stock using Time-Series Analysis andcalculation of statistical parametersStage IV:o Decision-making using, the Perceptron model wherethe input feature vectors are the results obtained fromthe previous stages.4. STAGES OF THE DECISION SUPPORTSYSTEM (DSS)Stage i:Gathering Of Historical Prices And Local Stock MarketParametersThe advent of new techniques in Artificial Intelligence has thepotential to scan and make sense of large or big data. Theanalysis of this data has the potential to unlock trends and otherpreviously unknown factors and important observations, whichmay open the door for success in the stock market [13].The gathering of historical prices of a share for pre-definedinterval can help in factoring a share into categories based on thevolume traded for that stock. The historical data is freely andpublically available on variety of sites like Yahoo Finance,Bloomberg, and Financial Times etc. This historical data can becrawled or collected using a hybrid crawler/parser. Whilecollecting this data, defining the correct time interval (e.g. 1year, 2 years etc.) is important. The categories in which a stockcan be placed are Zero growth, slow growth and fast growth [8].It is often noted that the volume traded for a stock is a primaryindicator of the growth of the share. A stock that has a negligiblevolume represents „zero‟ growth. Likewise moderately tradedstock represents stagnancy or „slowness‟ of the growth. Afrequently traded stock reflects large volume indicating „fast‟growth.Now, along with the volume another important factor to beconsidered is, the percent change in the prices of the stock perday. These indicate implied volatility of a stock. The volatility ofthe stock helps in deciding the fluctuations that it goes throughduring the day. While stocks with high prices often note biggerfluctuations than stocks with lower prices, it does not necessarilymean that the share is volatile. Hence, the volatility that iscalculated is not a true indicator of the nature of the stock. Theimportant thing to consider is that no matter how the stockfluctuates; it must exhibit more ups than downs.Along with the historical prices of a stock, other important andoften neglected aspects of stock market are the local stockparameters, which have equally important role. While theimportance of these factors is lost on the naïve and amateurinvestors, the consideration of these factors is of utmostimportance. There are various stock experts that use these factors22
International Journal of Computer Applications (0975 – 8887)Volume 117 – No. 8, May 2015as guidelines to decide the credibility of the stocks. Some ofthese important factors are: Price to Earnings ratio (P/E Ratio)Earnings per share (EPS)Cash Flow per share (CPS)Market CapProfit Margin52 Week High52 Week Low50 day Moving AverageAverage volume for 3 monthsSTAGE II:PROCESSING AND INTERPRETATIONCOLLECTED IN THE PREVIOUS STAGEOFDATATo help analyze the data collected in the previous stage i.e. thevolume and the percent change in the stocks, a popular techniqueof Data Analytics viz. „Clustering‟ is applied. Clustering is apopular technique that groups a set of objects in such a way thatobjects in the same group (called a cluster) are more similar (insome sense or another) to each other than to those in othergroups (clusters). Clustering as such is not an automatic task,but an iterative process of knowledge discovery or interactivemulti-objective optimization that involves trial and failure.„Jenks Natural Breaks Classification‟ is a preferable method todivide a stock's percent change into classes and find themaximum instances, which lie in which class. Jenks naturalbreaks classification method is a data clustering methoddesigned to determine the best arrangement of values intodifferent classes. This is done by seeking to minimize eachclass‟s average deviation from the class mean, while maximizingeach class‟s deviation from the means of the other groups. Inother words, the method seeks to reduce the variance withinclasses and maximize the variance between classes [14].The method requires an iterative process. That is, calculationsmust be repeated using different breaks in the dataset todetermine which set of breaks has the smallest in-class variance.Dividing the ordered data into groups starts the process. Initialgroup divisions can be arbitrary [15].The various stock parameters collected in the first stage need tobe interpreted to have a better understanding about the relatedstock. Each factor has its own meaning and importance anddetermining them helps in reaching the ultimate decision swiftlyand correctly. The following is a summary of the meaning andinterpretation of the collected stock parameters. Now applying clustering to the historical prices will categorize astock in three aforementioned categories or „clusters‟. Since,only the volume of a share is the desired feature that is to beconsidered while clustering, using a usual multi-dimensionalclustering algorithm like „k means‟ might yield incorrect results.A single dimension is much more special than one naivelythinks, as one-dimensional data is much better behaved. In 1D,there is a local minima; but in 2D there are saddle points andsuch possible splitting points. Sometimes 1D clustering isreferred to as segmentation or natural breaks optimization. Forthe clustering or the segmentation of the above mentionedvolumes of the stock, „Fixed Partition Clustering‟ works thebest. Since, determining the clusters is possible without even thedata as one already knows what value might be classified inwhich cluster and forming the boundaries of clusters is fixedbeforehand, using fixed partition clustering would be the optimalchoice.Price to Earnings ratio (P/E Ratio)The P/E Ratio is critical number in evaluating stocks.Simply put it is Price per share / Earnings per share. It givesan idea of how to tell if a stock is over or under value. TheP/E ratio also is often used as a primary indicator by theexperts to assess the value of the company. Theinterpretation of P/E ratio is summarized in this tableTable 2: P/E InterpretationThe volume of the stock is a very common and often the mostimportant factor considered by experts and investors alike toform the basis of investing in the market. Thus, the analyzing ofthe volume of stock for a defined interval will help classify thestock into the above mentioned clusters based on the growth.The popularly accepted notion is that any stock that has avolume of over 50,000 is considered a fast growing andequivalently „safe‟ investment. Hence combining this knowledgein the fixed partitioning cluster will result in following clusters:P/E ValueInterpretationN/AA company withnegligible earnings and acompany with sustainedlosses0-10Either the stock isundervalued or thecompany‟s earnings arethought to be in decline10-17P/E ratio in this range maybe considered fair value.17-25Either the stock isovervalued or thecompany‟s earnings haveincreased. The stock mayalso be considered agrowth stock25 A company whose shareshave very high P/E mayhave high expected futuregrowths in earnings or thisyear‟s earnings may beexceptionally low.Table 1: Volume Clusters growth classificationName of theClusterVolume RangeZero Growth0-5000Slow Growth5001-50000Fast Growth50001 and above Earnings per share (EPS)EPS is determined by the following formula:23
International Journal of Computer Applications (0975 – 8887)Volume 117 – No. 8, May 2015EPS (Net Income – Dividends) / (Average number ofshares outstanding)Simply put, the EPS gives the estimated earnings that ashare yields. Essentially a company must have a positiveand preferably a large EPS. Cash Flow per share (CPS)The EPS has one blind spot; it can be manipulated easily bythe company. But CPS is impossible to manipulate andhence is rather popular. It gives a true account of how muchcash a company really has and how effective its operationsare. CPS should be positive and should always be morethan EPS else it indicates manipulation of earnings by thecompany.Market CapMarket Cap is determined by the following formula:Market Cap (Number of shares outstanding) (Priceper share)The market cap could be thought of, as the estimated priceto buy the company. It is used to classify the size ofcompany into small, large or mega etc. Basically larger thecompany, usually the more stable and safe it is.Profit MarginProfit Margin can be calculated using the followingformula:Profit Margin (Net profit) / Revenue,Where Net profit (Revenue - cost)Profit margin basically gives an indication of whether thecompany is yielding profits. More the profit margin morevaluable a investment it is. A company with sustainedprofits for longer duration is a safe and reliable investment. 52 Week High / LowA 52 Week High/Low factor is another popular investmentfactor. Typically, a stock trading near a 52 week high isconsidered to be safe investment. It may not break thatbarrier easily but it is a risk free investment. However, if itbreaks a 52 high week barrier the share is expected toincrease dramatically. A stock trading below it‟s 52 weeklow is not considered a valued investment and is bestavoided. 50 day Moving AverageA 50 day Moving Average is equal to the average price thatall investors have paid to obtain it over last 50 days. Oncethe price falls below the average, it may act as resistancelevel i.e. the stock may not cross that barrier easily.Typically a stock trading near or above it may beconsidered a fair value. Average volume for 3 monthsIt is daily average of the cumulative trading volume duringthe last three months. Hence, higher the value, safer theshare and vice versa.Stage iii:Forecasting using time series analysis andcalculationstatistical parametersA time series is a sequence of data points, typically consisting ofsuccessive measurements made over a time interval. Time seriesdata have a natural ordering. This makes time series analysisdistinct from others, in where there is no natural ordering of theobservations [16]. Time series analysis consists of analyzing thetime series for extracting valuable information and possibletrends from it. Time series forecasting is the use of a time seriesanalysis to predict future values based on previous values. Timeseries analysis differs from other forms of analysis likeRegression analysis as the former considers values that areseparated over a predefined time interval and does not take intoaccount random and skewed data. Time series analysis also oftenconsiders single dimensional data.While many techniques exists for predicting and forecasting astock and its subsequent rise or fall, again the complexity of themarket and it's innate volatility just makes this process hugelydifficult and only moderately successful at best. Hence,forecasting a stock and relying on it to invest is not primarily thebest way to go about it. While the statistics might be perfectlyaccurate, the circumstances and the socio-political issues have ahuge impact on the market, which cannot be corrected viastatistics. Therefore while forecasting a stock remains credible, itshould only be considered as an indicator of what might happen,if things stay as they are which, obviously is never the case inthe market.Exponential smoothing is one of the time series methods, whichcan be applied to a time series data, either to produce smootheddata to make forecasts. In stock market, the ups and downs of ashare should be considered because they are representative andhelpful in figuring out the current vibe of the stock i.e. what isthe current trend of the stock whether it is increasing, decreasingor is it stable for a given period. Single exponential smoothingcan be used only for data without any trend or seasonalcomponents [17]. Simple exponential smoothing does not dowell when there is a trend in data. For such situations, severalmethods are devised under the name “Double exponentialsmoothing” or “Second order exponential smoothing” [18].Holt-Winters double exponential smoothing is one of themethods, which uses a seasonal factor along with both the leveland trend factor while predicting the stock price. In Holt‟smethod, a slope component is added which itself is updated byexponential smoothing, thus the trend can be taken into account.Holt‟s method can be extended to deal with time series, whichcontain both trend and seasonal variations. The Holt-Wintersmethod has two versions, additive and multiplicative, the use ofwhich depends on the characteristics of the particular time series[19]. Holt-Winters model considers three basic factors whileforecasting the stock viz. level, trend and seasonality. Theparameters are often selected between 0 and 1. LevelLevel is the approximate value of a stock at any givenperiod. It depends on the stock characteristics and also theirregularity of data has a wide effect on it.TrendTrend is the long-term movement of a stock price in a givenperiod without irregular effects and is a reflection of theunderlying level. Trend is a continuing pattern of a stocksincrease or decrease.SeasonalitySeasonality is a repeating pattern of stocks. It represents theincreases and decreases that occur within a given period.The key here is to find the pattern or cycle after which thedata set repeats. Seasonality consists of effects that arereasonable stable over a period of time. Smoothing Factor (α)It typically represents the weight given to the recent saleshistory (actual value). Its value varies from 0 to 1. If it'scloser to 1, more weight is given to recent value.Trend Factor (β)24
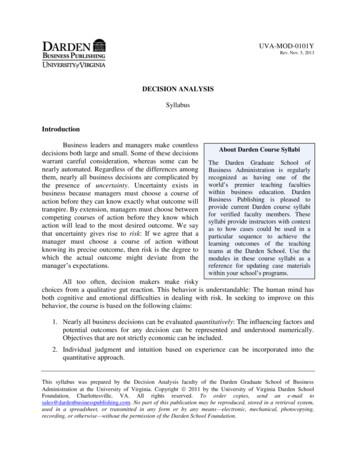
International Journal of Computer Applications (0975 – 8887)Volume 117 – No. 8, May 2015 This parameter helps to represent the trend in the demandpattern. It‟s a smoothing factor to trends i.e. closer to 1gives more weight to the recent trend.Seasonality Factor (γ)This factor helps to adjust the forecast by applying seasonalpercentage. It's again a smoothing factor to seasonal index.If the value is closer to 1, more weight will be given torecent seasonal periods.For the implementation of Holt-Winters in this DSS, datasettaken is the monthly average of closing prices for a pre-definedtime interval. Hence, the frequency parameter for Holt-Wintersis 12. The α, β and γ are calculated accordingly to get the closestvalue possible. Using Holt-Winters method we get the Forecastvalue by the expression:Forecast (Level Trend) SeasonalityAlong with Time series analysis the following four techniqueshelp in forecasting: Typical PricingTypical Price indicator is simply an average of each day‟sprice. It provides a simple, single line plot of the day‟saverage price. Some investors use TP rather than theclosing price.It is a building block of money flow index calculated by thefollowing formula:Typical Pricing (High Low Close) / 3 Chaikin Money Flow Indicator (CMI)Chaikin Money Flow is based on Chaikin‟sAccumulation/Distribution. Accumulation and distributionin turn, is based on the premise that if the stock closesabove its midpoint i.e.(High Low) / 2 for the day, thenthere was accumulation that day, and if it closes below itsmidpoint, then there was distribution that day. Chaikin'smoney flow is calculated by summing the values ofaccumulation/distribution for defined period and thendividing by the same defined period sum of the volume[20]. Stochastic Momentum Index (SMI)The Stochastic Momentum Index finds the position of theclosed price relative the high-low range‟s midpoint. It helpsyou to see where the current close has taken place relativeto the midpoint of the recent high to low range based on theprice change. SMI is based on Stochastic Oscillator[20].The values of the SMI range from 100 to -100. Whenthe close is greater than the midpoint, the SMI is abovezero, when the close is less than the midpoint, the SMI isbelow zero. The SMI is interpreted the same way as theStochastic Oscillator. It is considered a buy signal when theSMI crosses above the oversold (-40) level; sell signal,when it crosses below the overbought ( 40) level.All the results obtained from the previous stages need to becombined to give the final verdict. Now various methods can beused to achieve this but, supervised learning and in particular, aPerceptron represents a perfect option.A Perceptron is an algorithm used for classification of an inputinto one of several possible non-binary outputs [20]. Perceptronuses a linear-predictor function that considers the feature vectorsand their respective weights to classify the given problem [21].In the modern sense, the Perceptron is an algorithm that maps avector with features or layers to a single binary value. The linearpredictor function simply put is a multiplication of the value ofthe factor and its respective weight. The following is theequation of the Perceptron [20]𝑓 𝑥 1 𝑖𝑓 𝑤. 𝑥 𝑏 00𝑜𝑡ℎ𝑒𝑟𝑤𝑖𝑠𝑒Hence, the results of clustering and the analysis of individualstock parameters along with the forecasting i.e. the results ofprevious stages are considered as feature vectors i.e. the inputvectors to the Perceptron. The value of each feature is dependenton the interpretation and the „likeness‟ of the actual value. Eachfeature is assigned a weight on the basis of the importance ofthat factor. For example, the clustering of the volume for adefined interval is an important factor, hence it is assigned thehighest weight, but it is not the only factor that must beconsidered and hence this is where the Perceptron modelbecomes convenient. A linear predictor function is applied to thePerceptron. In short, the value of each feature vector ismultiplied with its weight to give a value i.e. a dot product istaken. A threshold is decided first hand. If the value of thepredictor function exceeds the threshold the Perceptron fires 1else it fires 0 (indicating the binary nature of Perceptron). Now,if the Perceptron fires 1, it indicates that the share is desirableand vice-versa.Figure 1: Modified Perceptron Model for DSS Relative Strength Index (RSI)Relative Strength Index (RSI) is an oscillator comparing themagnitude of a stock‟s recent gains to the magnitude of itsrecent losses on a scale from 0 to 100 [20]. Whileemploying the RSI it is recommended to use the levels of70 or more as overbought and 30 or less as oversold.Generally if RSI rises above 30 it is considered as bullishfor underlying stock.STAGE IV:DECISION MAKING USING PERCEPTRON MODELUnlike other systems, the DSS must also provide reasoning andanalysis that will help the user achieve better perspective as towhy a certain decision was reached. To simply it for the user, theDSS will categorize the share into its strengths, weaknesses andintermediate factors. This visualization will help the user ineasily understanding where the stock is strong and where it iswrong. Along with this, the DSS will also give a detailedanalysis for each factor and the meaning of the value of eachfactor to help the user achieve total understanding, And asmentioned above, it will also give the forecasted price for thenext period to the user.25
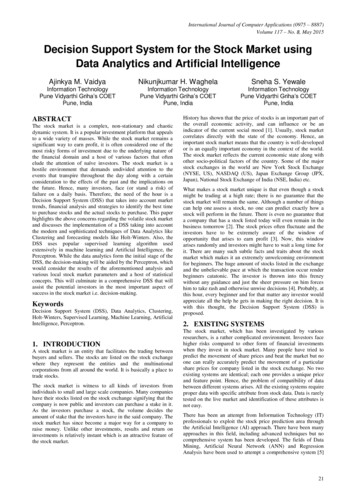
International Journal of Computer Applications (0975 – 8887)Volume 117 – No. 8, May 20155. EXPERIMENT AND RESULTSThe above proposed DSS was implemented using MicrosoftVisual Studio C#.NET for the front end and the statistical toolR for analysis (viz. Clustering and Holt-Winters). The historicalprices for stocks that were considered were for a period between1 Jan 2013 to 1 Jan 2015. This data along with the required localstock parameters were gathered from the Yahoo Finance. A webcrawler was used for the same. Below are attached thescreenshots and the analysis that the DSS achieved. A share andthe appropriate query were selected. And the analysis proceededaccording to the above mentioned stages (i.e. from Stage I-StageIV). The screenshot for the Home screen of the DSS is shownbelow that asks the user to input the share and select theappropriate query which would help the DSS to analyze theshare accordingly-As can be seen from the above screenshot, the DSS analysesthe selected share in its strengths, intermediate factors andweaknesses. Along with it, the DSS gives the verdict as towhether the share should be bought or not (depending upon thequery). Also, the surety or the likelihood of that verdict is alsostated based on the strengths
the stock market. History has shown that the price of stocks is an important part of the overall economic activity, and can influence or be an indicator of the current social mood [1]. Usually, stock market correlates directly with the state of the economy. Hence, an important stock market means that the country is well-developed