Transcription
This article appeared in a journal published by Elsevier. The attachedcopy is furnished to the author for internal non-commercial researchand education use, including for instruction at the authors institutionand sharing with colleagues.Other uses, including reproduction and distribution, or selling orlicensing copies, or posting to personal, institutional or third partywebsites are prohibited.In most cases authors are permitted to post their version of thearticle (e.g. in Word or Tex form) to their personal website orinstitutional repository. Authors requiring further informationregarding Elsevier’s archiving and manuscript policies areencouraged to visit:http://www.elsevier.com/authorsrights
Author's personal copyNeuroImage 87 (2014) 356–362Contents lists available at ScienceDirectNeuroImagejournal homepage: www.elsevier.com/locate/ynimgRegion-specific modulations in oscillatory alpha activity serve tofacilitate processing in the visual and auditory modalitiesAli Mazaheri a,⁎, Martine R. van Schouwenburg b,c,f, Andrew Dimitrijevic d, Damiaan Denys a,e,Roshan Cools b,c, Ole Jensen caDepartment of Psychiatry, Academic Medical Center, University of Amsterdam, The NetherlandsRadboud University Medical Centre Nijmegen, Department of PsychiatryRadboud University Nijmegen, Donders Institute for Brain, Cognition and Behaviour, Centre for Cognitive NeuroimagingdCommunication Sciences Research Center, Cincinnati Children's Hospital, Department of Otolaryngology, University of CincinnatieNetherlands Institute for Neuroscience (DD), Royal Netherlands Academy of Arts and Sciences, Amsterdam, The NetherlandsfDepartment of Neurology, University of California, San Francisco, Californiabca r t i c l ei n f oArticle history:Accepted 25 October 2013Available online 2 November 2013a b s t r a c tThere have been a number of studies suggesting that oscillatory alpha activity ( 10 Hz) plays a pivotal role inattention by gating information flow to relevant sensory regions. The vast majority of these studies have lookedat shifts of attention in the spatial domain and only in a single modality (often visual or sensorimotor). In thecurrent magnetoencephalography (MEG) study, we investigated the role of alpha activity in the suppression ofa distracting modality stream. We used a cross-modal attention task where visual cues indicated whether participants had to judge a visual orientation or discriminate the auditory pitch of an upcoming target. The visual andauditory targets were presented either simultaneously or alone, allowing us to behaviorally gauge the “cost” ofhaving a distractor present in each modality. We found that the preparation for visual discrimination (relativeto pitch discrimination) resulted in a decrease of alpha power (9–11 Hz) in the early visual cortex, with a concomitant increase in alpha/beta power (14–16 Hz) in the supramarginal gyrus, a region suggested to play avital role in short-term storage of pitch information (Gaab et al., 2003). On a trial-by-trial basis, alphapower over the visual areas was significantly correlated with increased visual discrimination times, whereas alpha power over the precuneus and right superior temporal gyrus was correlated with increased auditory discrimination times. However, these correlations were only significant when the targets were pairedwith distractors. Our work adds to increasing evidence that the top–down (i.e. attentional) modulation ofalpha activity is a mechanism by which stimulus processing can be gated within the cortex. Here, we find thatthis phenomenon is not restricted to the domain of spatial attention and can be generalized to other sensorymodalities than vision. 2013 Elsevier Inc. All rights reserved.IntroductionAttention involves selective facilitation of relevant sensory inputand suppression of irrelevant sensory input. Oscillatory activity in thealpha range ( 10 Hz) has been proposed to play a pivotal mechanisticrole in attention by gating information flow to relevant sensory regionsthrough the inhibition of irrelevant regions (Foxe et al., 1998; Jensen andMazaheri, 2010; Klimesch et al., 2007). Supporting this hypothesis are anumber of studies reporting that oscillations in the alpha range are suppressed in brain regions processing attended information, but enhancedin regions processing unattended information (Bauer et al., 2012a,b;Haegens et al., 2011a, 2012; Jokisch and Jensen, 2007; Medendorpet al., 2007; Rihs et al., 2007; Romei et al., 2008a; Thut et al., 2003).⁎ Corresponding author.E-mail address: ali.mazah@gmail.com (A. Mazaheri).1053-8119/ – see front matter 2013 Elsevier Inc. All rights 13.10.052Although the mechanism underlying alpha enhancement in directingfunctional inhibition is not fully understood some recent work demonstrates that alpha oscillations exercise a strong inhibitory influence onboth spike timing and firing rate of neural activity (Haegens et al.,2011b; Mazaheri and Jensen, 2010).The majority of studies that have examined the role of alpha oscillations and attention have used shifts of attention (often spatial) withinone modality (often visual or sensory–motor). There have been comparatively fewer studies examining the influence of auditory spatial attention on alpha lateralization in the occipital parietal regions (e.g.Banerjee et al., 2011; Fu et al., 2001; Kerlin et al., 2010). This discrepancycan in part be attributed to skepticism about the existence of alphapower modulation by auditory attention that is distinct from the visualor sensory-motor systems (see (Weisz et al., 2011) for a review of thisdebate). Furthermore, previous research has suggested that the detection of an auditory alpha rhythm is difficult at the scalp level due to the
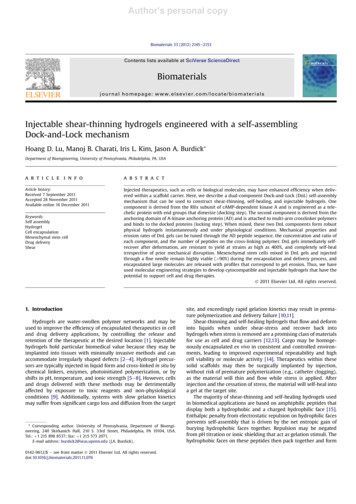
Author's personal copyA. Mazaheri et al. / NeuroImage 87 (2014) 356–362relatively small spatial extent of auditory cortical areas (Bastiaansen andKnosche, 2000).The aim of the current MEG study was to investigate if cortical specific modulation of alpha activity facilitates performance by suppressinginformation across the auditory and visual modalities. We utilized across-modal attention task in which symbolic visual cues signaled themodality (visual or auditory) of an upcoming target to be discriminated.The target was presented with or without the presence of a distractor ina different modality. Our investigation focused on how cues signalingwhether to perform a visual or auditory judgment on upcoming targetsmodulated alpha activity across the scalp. We were also interested inthe relationship of alpha power on performance on a trial-by-trial basis.357clockwise. The auditory stimuli were presented for 200 ms to bothears via ear-tubes and were pure tones with 3 possible frequencies:250 Hz, 1000 Hz, and 4000 Hz. The visual discrimination of the targetsinvolved judging the orientation of the gratings, while the auditory discrimination involved judging the pitch of the target. Fig. 1A illustrates anexample trial sequence. There were 50 trials of each condition throughout the experiment. Participants responded by pressing one of threebuttons using their right index finger, middle finger, or ring finger. Inthe current study, we focused exclusively on the changes in pre-targetactivity induced by the informative cues.Behavioral analysisMethodsParticipantsEighteen healthy young adults (14 women; mean age, 23.5 years;range, 18–38) participated in the study. All participants were righthanded with no history of psychiatric or neurological disorders. Allhad normal or corrected-to normal vision. Before the start of the experiment, written informed consent was obtained from each subject. Theexperiment was approved by a local ethical committee (CMO regionArnhem-Nijmegen, The Netherlands). The MEG data of one participantwas excluded due to many artifacts.Cross-modal attention paradigmThe start of a trial was indicated by a brief change in a fixation crosswhich was followed by the attentional cue one second later (Fig. 1). An‘informative’ cue consisted of a symbol indicating what modality was tobe discriminated: indicated that the discrimination was to be madeon a visual stimulus whereas a indicated that the discriminationwas to be made on an auditory stimulus. An informative cue was alwaysfollowed by a stimulus of the cued modality presented either alone ortogether with a stimulus of the uncued modality (50/50). A third cuewas modality-ambiguous, and indicated only that a stimulus of a singlemodality would occur but giving no information about the modalityitself. The visual stimuli, presented centrally for 50 ms, consisted of circular gratings with 3 possible types of orientation: 80 , 90 , and 110 A 50 950 We were interested in the distraction cost of having a target presentedwith a distractor of a different modality as well as the time it took tomake the target discrimination (i.e. reaction times). Distraction cost wascalculated as the reaction time difference between cued targets withdistractors and cued targets without distractors. The first trial of eachblock and trials with incorrect responses were excluded from furtheranalyses (less than 5%).Data acquisitionThe MEG data were acquired with a 275-sensor axial gradiometersystem (CTF Systems Inc., Port Coquitlam, Canada) placed in a magnetically shielded room. Horizontal and vertical electrooculogram (EOG)activity was also recorded and later used to discard trials contaminatedby eye movements and blinks. The MEG and EOG signals were digitizedat 600 Hz, and later down-sampled to 300 Hz for offline analysis. Theparticipants' head position relative to the gradiometer array was determined using coils positioned at the subject's nasion, and at the left andright ear canals prior to the start of data acquisition.In addition to the MEG measurements, whole brain high-resolutionanatomical images (voxel size 1 mm3) were acquired for each participant using a 1.5-T Siemens Sonata whole-body scanner (Erlangen,Germany). These images were used for reconstruction of individualhead shapes to create forward models for the source reconstructionprocedures described later.250 2000-6000200RT1000-5000Time (MS)B CueCued visual targets ORvisual targetwith auditory distractorCued auditory targetsvisual targetaloneCueORauditory targetwith visual distractorauditory targetaloneUncued targets ORCuevisual or auditory targetFig. 1. The cross-modal paradigm. (A) An example trial sequence. A trial is initiated by brief change in a fixation cross followed by the attentional cue. A visual stimulus (in this case thetarget) and an auditory distractor are presented 2–6 s after the cue. The participants have to perform a discrimination on a physical feature of the modality (in this case orientation ofgrating) instructed by the cue by pressing one of three buttons. Stimuli could be presented alone or with a distractor of a different modality. (B) Cues and targets. A cue consisting of asymbol: indicated an visual discrimination; indicated an auditory discrimination; and a third type of cue,“ ”, dubbed as modality ‘ambiguous’ indicated only that a stimulus of a singlemodality would occur but giving no information about the modality itself.
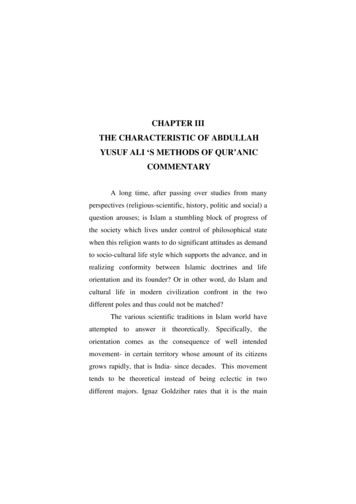
Author's personal copy358A. Mazaheri et al. / NeuroImage 87 (2014) 356–362PreprocessingThe data analysis was performed using FieldTrip, an open sourceMatlab toolbox developed at the Donders Centre for Cognitive Neuroimaging (http://www.ru.nl/fcdonders/fieldtrip). Trials containingmovement, muscle, and superconducting quantum interference device(SQUID) artifacts were discarded by visual inspection and an automaticartifact removal routine rejected trials which had a mean field strengthpower 3 z-values above the mean. Infomax (standard, not extended) independent component analysis (Bell and Sejnowski, 1995) was used toremove any heart artifacts and eye movements not rejected by thesemiautomatic routines (Jung et al., 2000). For all of our sensor levelanalyses, planar gradients from the MEG field distribution were calculated using a nearest-neighbor method described by Bastiaansen et al.(2001) and used in Haegens et al. (2010), Jokisch and Jensen (2007),Mazaheri et al. (2009), Nieuwenhuis et al. (2008), and Whitmarshet al. (2011). The horizontal and vertical components of the planar gradients were estimated at each sensor location using the fields from thesensor and its neighboring sensors. The power values for the horizontaland vertical components after the spectral analysis were summed foreach sensor location. For source reconstruction, we used the data fromthe true axial sensors and not the planar gradient estimate.Pre-target oscillatory analysisThe oscillatory alpha activity was characterized by calculatingthe power spectra using the 1 second interval preceding the target.A 1 second Hanning taper was applied to the data prior to calculatingthe spectra to reduce any edge artifacts. The spectra were calculatedfor each individual trial. A similar approach was taken in Mazaheriet al. (2009) and (2010).Statistical analysisIn order to assess the relationship between cue related changesin alpha power between the visual and auditory cue conditions we examined the difference in the power of frequencies in the alpha/lowerbeta band (8 to 16 Hz, using 1 Hz increments) between conditions(random effects analysis) across all sensors. We corrected for multiplecomparisons by means of the cluster (over sensors) level randomization(Maris and Oostenveld, 2007). This test controls the Type-1 error rateinvolving multiple comparisons (e.g. multiple sensors and/or timefrequency tiles). Next the Monte Carlo estimate of the permutationp-value of the cluster of sensors was obtained by comparing thecluster-level test statistic to a randomization null distribution assumingno difference between conditions. This distribution is obtained by randomly swapping the conditions in participants 1000 times and calculating the maximum cluster-level test statistic. A similar procedure hasbeen used in a number of previous studies (Jokisch and Jensen, 2007;Mazaheri et al., 2009; Nieuwenhuis et al., 2008). In order to assess the relationship between cue related changes in alpha power and speed of target discrimination, we performed a trial-by-trial correlation (Spearman)in each participant between pre-target alpha power and subsequenttarget discrimination, across all sensors, to create topographies of thecorrelation. The correlation coefficients were subsequently convertedto z-values using Fisher's r- to z-transformation to obtain a normally distributed variable. The statistical significance of the correlation topographies was assessed at the group level with a one-sample t-test ofthe correlations (alpha power vs. reaction time) at each sensor andthen subjected to a cluster-level randomization test to correct for multiple comparisons.Source reconstructionSource reconstruction was performed using a frequency-domainbeam-forming approach [dynamic imaging of coherent sources (DICS)].The DICS technique uses adaptive spatial filters to localize power in theentire brain (Gross et al., 2001). A realistically shaped single-shell description of the brain–skull interface was constructed, based on the individualanatomical MRIs (Nolte, 2003). The brain volume of each individualsubject was discretized to a grid with a 0.8 cm resolution and the leadfield was calculated for each grid point. Using the cross-spectral densitymatrices and the lead-field, a spatial filter was constructed for each gridpoint (Gross et al., 2001), after which the power at each grid point wasestimated in each trial for both conditions separately. A common filterwas calculated for both visual and auditory cued conditions andthen applied for the data separately for the individual conditions(see e.g. (Mazaheri et al., 2009; Whitmarsh et al., 2011)). The sourceswere estimated for the frequency bands pre-selected from the sensorlevel analysis. The source estimates of the individual participants'functional data along with the individual anatomical MRI imageswere spatially normalized to the MNI brain [Montreal NeurologicalInstitute (MNI), http://www.bic.mni.mcgill.ca/brainweb] using SPM8(http://www.fil.ion.ucl.ac.uk/spm) prior to averaging. The source estimates were plotted on a standard MNI space single subject brainfound in SPM8. The anatomical location of the sources was determinedusing the Anatomy toolbox in SPM8.In order to assess the relationship between cue related changes inalpha power in source-space and speed of target discrimination, weperformed a trial-by-trial correlation (Spearman) in each participantbetween pre-target alpha power at each grid point and subsequenttarget discrimination. The correlation coefficients were subsequentlyconverted to z-values using Fisher's r- to z-transformation to obtain anormally distributed variable. The statistical significance of the correlations was assessed at the group level with a one-sample t-test of thecorrelations.ResultsBehavioral dataIn the absence of distractors, participants showed significant benefitfrom attentional cueing. Informatively cued visual targets were discriminated significantly faster than the ambiguously cued visual targets(801 ms vs. 844 ms, t(17) 3.35, p b 0.01) and informatively cued auditory targets were discriminated significantly faster than ambiguouslycued auditory targets (903 ms vs. 972 ms, t(17) 4.8, p b 0.001).When the targets were presented together with distractors, participants demonstrated significant costs in response times. Reaction timesto visual targets presented simultaneously with auditory distractorswere significantly slower than those to visual targets presented alone(920 ms vs. 801 ms, t(17) 4.8, p b 0.001). Likewise, reaction timesto auditory targets that were presented with visual distractors weresignificantly slower than those to auditory targets presented alone(1142 ms vs. 903 ms, t(17) 10.5, p b 0.0001).Overall, the participants were significantly faster in the visual discrimination task, than the auditory (863 ms vs. 1009 ms, t(17) 7.8,p b 0.0001).Effects of the cross-modal cues on sensory regionsIn order to investigate modality specific alpha modulation wecontrasted pre-target alpha power after the visual vs. auditory discrimination cues. This contrast revealed a significant decrease in alpha activity (9–11 Hz) in sensors over the occipital cortex (p b 0.05; Fig. 2A, toppanel), but a relative increase in alpha/beta power (in the 14–16 Hzrange) in clusters of sensors over the right temporal areas (p b 0.05,Fig. 2A, lower panel). Source analysis revealed the location of themaximal pre-target alpha power decrease to be in the primary visualcortex (lingual gyrus, Fig. 2B, top panel). Conversely, the location themaximal increase in pre-target alpha power over the right sensors
Author's personal copyA. Mazaheri et al. / NeuroImage 87 (2014) 356–362A359BVisual - Auditory cue9-11 HzLRRLRR14-16 Hz-5t-statp 0.055-4t-stat4Fig. 2. Modality specific alpha/beta modulation as a result of cross-modal attentional cues. (A) The difference between pre-target power spectra for cues signaling visual versus cues forauditory (i.e. cue subtracted from cue) discrimination revealed significantly less alpha activity (9–11 Hz) in sensors over the occipital cortex (upper panel) and greater alpha/betaactivity(14–16 Hz) over the right temporal/parietal sensors (lower panel). The differences are expressed in terms of t-values. Sensors showing significant modulation (p b 0.05) correctedfor multiple comparisons using cluster randomization routine (Maris and Oostenveld, 2007) are marked with large dots. (B) Top-panel: The pre-target alpha power decrease was maximalat the primary visual cortex. The source activations are plotted as t-values. The threshold for the display is set to t-values above 2.1 (df 16, p b 0.025, one-tailed). Lower-panel: Theincrease in pre-target alpha/beta amplitude over the right sensors was maximal in the right supramarginal gyrus. The threshold for the display is set to t-values above 2.58 (df 16,p b 0.01, one-tailed).was found to be in right supramarginal gyrus (SMG). The MNI coordinates of the voxels with the maximal t-values can be found in Table 1.Trial-by-trial modulation of pre-target alpha activity correlated with targetdiscrimination timeWe also investigated the functional relationship between alphamodulation and attentional performance. On a trial-by-trial basis, foreach sensor we correlated the pre-target alpha power with the targetdiscrimination response times. This resulted in correlation topographiesfor each participant. The statistical significance of these topographies onthe group level was assessed with a cluster-level randomization test(see Methods). We found that when a visual target was presentedwith an auditory distractor, the power of the pre-target alpha activity(9–11 Hz) was significantly positively correlated with discriminationtimes (p b 0.05; Fig. 3A, top-panel) at a large cluster of the occipital,central and frontal sensors. When an auditory target was presentedwith a visual distractor, alpha/beta power (14–16Hz) at a small clusterof the central–parietal sensors was positively correlated with discrimination times (p b 0.05; Fig. 3A, lower-panel). However, we did notTable 1MNI coordinates of the voxels showing maximal statistical difference between the visualand auditory cued pre-target alpha power.MNI coordinatesRegionXYZt-ValueSupramarginal gyrus (R)Supramarginal gyrus (L)Medial Frontal gyrusLingual gyrus, middle occipital (R)53 45 1227 38 38 11 68333370 22.32.53.0 4.2L, left hemisphere; R, right hemisphere.find any significant clusters of alpha power that correlated with eithervisual or auditory discrimination times when the targets were presented without distractors.In source-space, the trial-by-trial correlations between alpha-powerand visual discrimination times were maximal in the early visualcortices (Fig. 3B, top-panel). For the auditory targets, the correlationbetween alpha power and discrimination times was maximal at theprecuneus and right superior temporal gyrus (STG, Fig. 3B, lowerpanel). Please refer to Table 2 for MNI coordinates of the voxels showingthe maximal correlation values.DiscussionIn the current study we found that cues signaling the preparation forvisual discrimination (relative to pitch discrimination) resulted in adecrease of alpha power (9–11 Hz) in the early visual cortex, with aconcomitant increase in alpha/beta power (14–16 Hz) in the rightSMG. Thus, we were able to demonstrate the modulation of alphaactivity by auditory attention that is distinct from the visual and sensorysystems. On a trial-by-trial basis, alpha power over the visual areas wascorrelated with increased visual discrimination times whereas alphapower in the precuneus and right STG was correlated with increasedpitch discrimination times. However, these correlations were only significant when the targets were presented alongside stimuli in adistracting modality. Taken together our findings support the viewthat the top–down modulation (i.e. attentionally controlled) of alphapower serves a functional role by suppressing processing in taskirrelevant regions. On the other hand, spontaneous increases of alphapower in task-relevant regions correspond to a reduction in processingcapacity which can be detrimental to performance, especially in thepresence of competing distracting input.
Author's personal copy360A. Mazaheri et al. / NeuroImage 87 (2014) 356–362Trial by trial α amplitude and RT correlationBSensor levelBSource levelVisual DiscriminationALRt-stat-1010Auditory Discriminationp 0.001RLp 0.05R-5Rt-stat5Fig. 3. Trial-by-trial correlation of pre-target alpha/beta amplitude and discrimination time in sensor and source space. (A) Top-panel: The amplitude of the pre-stimulus alpha activityacross a wide range of the occipital and central parietal sensors was positively correlated with the time of visual discrimination. Sensors where a significant (one sided t-test, p b 0.01,corrected for multiple comparisons) correlation coefficient was found are marked with large dots. Bottom-panel: For the auditory discrimination alpha amplitude over a cluster of thecentral sensors showed a significant relationship (one sided t-test p b 0.05, corrected for multiple comparisons) between alpha amplitude and discrimination time in the presence ofdistractors. When distractors were not present, alpha power in these clusters was not significantly correlated with reaction times. (B) Top-panel: In source-space, alpha-power in theoccipital cortex (lingual gyrus) had the strongest correlation with visual discrimination times. Lower-panel: The correlation between alpha/beta power and auditory discriminationtimes was largest in the precuneus and right superior/middle temporal gyrus. Notably, there were no significant voxels in the left temporal cortex. The threshold for the display is setto t-values above 2.58 (p b 0.01).Top–down modulation of alpha powerPrevious studies on spatial attention have found suppression ofalpha activity in the visual stream contra-lateral to the focus of attention(Rihs et al., 2007; Romei et al., 2008b; Thut et al., 2003, 2006; Wordenet al., 2000). The modulation of alpha activity over the occipital corticesappears to have a functional consequence for stimulus processing. Furthermore, previous work has demonstrated that visual discriminationabilities are reduced with an increase in posterior alpha activity (vanDijk et al., 2008; Zhang et al., 2008). Most recently, it has been foundthat the failure to lateralize the occipital alpha activity in response toan attention-directing arrow foreshadows imminent attentional failures(Bengson et al., 2012). These findings, in combination with our results,suggest that the occipital alpha serves to gate information in the earlyTable 2MNI coordinates of the voxels showing largest correlation between pre-target alphapower and target discrimination time.Type of al gyrus (L)Precuneus (R)Superior/middletemporal gyrus (R) 10450 53 66 4235209.03.22.75L, left hemisphere; R, right hemisphere.visual system (Foxe et al., 1998; Jensen and Mazaheri, 2010; Klimeschet al., 2007).We found that the informative cues modulated alpha activity in acluster of sensors over the right temporal regions. The likely source ofthis activity was found to be in the right SMG. Previous fMRI studieshave shown activity in the SMG to increase during attend auditoryversus ignore auditory contrasts (Sabri et al., 2008) as well as pitchmemory (Celsis et al., 1999). This has led to the speculation that this region may play a vital role in short-term storage of pitch information andpitch discrimination (Gaab et al., 2003). We speculate that the increaseof alpha in the SMG might reflect the inhibition of a top–down region inregulating the processing of auditory information in the sensory cortices(i.e. the superior temporal cortex). Such an interpretation is consistentwith “the interactivity thesis” used to account for the role of alpha activity with regard to spatial attention (Banerjee et al., 2011). In this framework a modality independent (i.e. supramodal) system interacts with asensory system during the deployment of spatial attention. This suggests that the auditory alpha modulation does not serve an exclusivelysensory gating role with respect to auditory attention, and that higherorder regions related to the maintenance of auditory working memorysuch as the SMG are also affected.To the best of our knowledge pre-stimulus modulation of alphaactivity in anticipation of auditory targets has been reported in onlytwo previous studies to date (Bastiaansen and Brunia, 2001) and(Muller and Weisz, 2012). Bastiaansen et al. found anticipatory alpha
Author's personal copyA. Mazaheri et al. / NeuroImage 87 (2014) 356–362modulation in the auditory cortex in only 2 of 5 participants. Muller andWeisz (2012) were able to demonstrate significant anticipatory alphamodulation in the auditory cortex, following visual cues signaling thelocation of the auditory stimuli. In our study we found alpha powerover the right STG to be positively correlated with auditory discrimination times. This is in line with previous studies using PET (Zatorre andBelin, 2001), functional MRI (Lattner et al., 2005), MEG (Okamotoet al., 2009; Patel and Balaban, 2001) and EEG (Dimitrijevic et al.,2008; Shahin et al., 2006) that have found human pitch perception torely on the right auditory cortex. Moreover, these neuroimaging studiesare supported by lesion studies which have found the right auditory cortex to be essential for the retention of pitch in auditory short-termmemory (reviewed in Zatorre et al., 2002).Study caveats and considerationsOne potential issue in cross-modal attentional studies is the sensorymodality of the attentional cues. In our study visual stimuli informed themodality of both visual and auditory targets. The onset of the visual cueswill result in stimulus-related evoked responses as well induced suppression of alpha activity in the visual cortices. We tried to minimizeany potential sensory effect of the cues, by having relatively long cueto target intervals of 2–6 s. We also focused our analysis on the one second interval prior to target onset, which minimized the induction of anyalpha activity in our analysis which was directly related to the onset ofthe cue stimuli. Nevertheless, to completely avoid the confounder introduced by the common visual cue, attentional cues in the somatosensorymodality would have been the most appropriate.ConclusionAttention can be described as the focus of cognitive resources on relevant information while filtering or ignoring irrelevant information. Wefound that alpha modulation in the task relevant cortices plays a criticalrole in facilitating and suppressing information between modalities. Ourwork further adds to increasing evidence tha
Mazaheri et al. (2009), Nieuwenhuis et al. (2008),andWhitmarsh et al. (2011). The horizontal and vertical components of the planar gra-dients were estimated at each sensor location using the elds from the sensor and its neighboring sensors. The power values for the horizontal and vertical components after the spectral analysis were summed for