Transcription
Oklahoma Health Care AuthorityCAHPS Child Health Surveyfor SoonerCare ChoiceExecutive Summary andTechnical SpecificationsReport for Fiscal Year 2009Report Submitted June 2009Submitted by:APS Healthcare4545 North Lincoln BoulevardSuite 24Oklahoma City, Oklahoma 73105(405) 556-9700
CAHPS Child Medicaid SurveyFiscal Year 2009CAHPS Child Survey for SoonerCare ChoiceExecutive SummaryThe Oklahoma Health Care Authority (OHCA) is the state’s single agencyresponsible for administering Medicaid. The managed care component of this program isknown as SoonerCare Choice, which operated under a partially capitated casemanagement system during the first half of the state fiscal year (SFY) 2009. A patientcentered medical home model was implemented January 1, 2009. In order to evaluateservice satisfaction, the OHCA contracted with APS Healthcare to survey the parents ofchild members enrolled in SoonerCare Choice between July 1, 2008, and June 30, 2009.The OHCA has administered Consumer Assessment of Healthcare Providers and Systems(CAHPS) surveys to measure consumer satisfaction in the Medicaid population everyother year since 1996.Comparing the 2007 survey and the 2009 survey, results indicated fairly highlevels of satisfaction holding steady across an array of six quality measures. Two of thesix measures showed statistically significant increases between 2007 and 2009: The average rating of “Your Child’s Health Plan” on a 10-point scaleincreased from 8.2 to 8.7. The composite measure of “Getting Care Quickly” on a 4-point scale had asignificant increase from 3.50 to 3.55.June 2009Page 2
CAHPS Child Medicaid SurveyFiscal Year 2009CAHPS Child Medicaid SurveyTechnical SpecificationsSoonerCare ChoiceINTRODUCTIONConsumer satisfaction surveys are an important source of information toconsumers, purchasers of health care, health plans and program administrators. Byresponding to satisfaction surveys, individuals provide valuable information regardingaccess to care, use of services, and satisfaction with the care they have received. Tosurvey the general population of managed care members about their overall experiencewith their health plan, OHCA has administered Consumer Assessment of HealthcareProviders Systems (CAHPS) surveys to SoonerCare members since 1996. CAHPSquestionnaires, administration protocol, and survey analysis were developed by Harvard,RAND, and the Research Triangle Institute. The health care community has acceptedthese methods in producing consumer satisfaction measures that may be compared acrosshealth plans and health service delivery types.In order to evaluate service satisfaction, the Oklahoma Health Care Authority(OHCA) contracted with APS Healthcare to survey the members enrolled in SoonerCareChoice between July 1, 2008, and June 30, 2009. This technical report includesinformation on the survey methodology, findings, and summary information on therespondents’ satisfaction with health plan services they received.June 2009Page 3
CAHPS Child Medicaid SurveyFiscal Year 2009METHODOLOGYThe CAHPS QuestionnaireThe Child CAHPS Health Plan Survey 4.0 questionnaire (shown in Appendix A)was administered by The Myers Group (TMG) between August 1 and November 1, 2009.The questionnaire covered several aspects of health plan performance, including: Rating of personal doctors, specialists, health care received, and health plan Receiving care without long waits Communication with clinicians Health plan information and customer service Getting needed careSamplingBecause it is not feasible to survey the entire SoonerCare Choice population,TMG used recognized sampling techniques to obtain information from a limited numberof members. This information is used to estimate the consumer satisfaction of theSoonerCare Choice population as a whole.Sampling for this survey followed CAHPS 4.0 protocols with one exception;APS limited the sample to members with at least one paid claim from a SoonerCareChoice provider. APS provided TMG with a list of eligible members for sampleselection. Each member included in the eligibility list met the following criteria: 17 years of age or younger as of June 30, 2009; Enrolled in the SoonerCare Choice program as of June 30, 2009; and Continuously enrolled in SoonerCare Choice between July 1, 2008, and June 30,2009. (Continuous enrollment was defined as having no more than one 45-daybreak in enrollment during the year.)June 2009Page 4
CAHPS Child Medicaid SurveyFiscal Year 2009In accordance with CAHPS recommendations, and to reduce the burden onrespondents, TMG only selected one member from a household for the sample. TheCAHPS Survey and Reporting Kit 4.0 standards indicate that a minimum of 300completed surveys are needed for a valid administration. The total number of memberseligible for the survey was 260,152; TMG selected a random sample of 1,650 members.Data CollectionThe CAHPS survey methodology allowed data to be collected by mail, telephoneinterview, or a combination of mail and telephone. The OHCA and APS agreed toconduct these surveys using mail, and incorporated telephone interviewing only when thetargeted response rate was not received. The survey process had outreach interventionsthat included mailings of the survey packet, reminder postcards, and phone follow-upwith interviewers.After the sample was selected, address lists were processed using the U.S. PostalService’s CASS Certified ZIP 4 Coding Software, which verified the zip code for eachaddress. Each packet included a questionnaire and a letter that explained the purpose andthe importance of the survey. To encourage participation, the packet also contained apostage-paid business reply envelope. Reminder postcards served to thank individualswho had responded to the survey and to remind others to complete their questionnaires.Members selected for the sample who did not respond to the first survey and/or postcardmailings were mailed a second survey. All correspondence included a toll-free numberthat members could use to contact TMG with questions regarding the survey, or tocomplete the survey over the telephone. Each information letter contained a statementwritten in Spanish asking the member to call the toll-free number to take the survey byphone with a Spanish interpreter. If needed, follow-up calls were then initiated withbilingual interviewers.TMG developed a database to track the status of members selected for the sampleat each stage of the survey protocol. The database identified members who had notreturned the survey and needed subsequent mailings. The database also indicated thedate that a member responded to the survey, refused to participate in the survey, or wasJune 2009Page 5
CAHPS Child Medicaid SurveyFiscal Year 2009determined to be ineligible for the survey. Members were determined to be ineligible forthe survey if they no longer qualified for SoonerCare or had moved to another state.Data Coding and Data EntryTMG recorded the responses to the questionnaires in a database specificallydesigned for this purpose. The data entry program permitted the entry of only thoseresponses that were within the accepted range for each specific item; for example, if arating was supposed to be on a scale of 0 to 10, a response of 12 could not be entered.TMG performed a data clean-up process prior to the actual analysis to detect anyadditional out-of-range values and response inconsistencies. Typically, inconsistenciesoccurred when respondents did not follow the skip pattern of question groups. Wheneverfeasible, TMG recoded the items to conform to the questionnaire skip patterns; forexample, if one response indicated the person did not receive health plan forms to fill out,then any subsequent responses to questions about the ease of completing these formswere discarded. However, when the intent of the respondent could not be determined, theanalyst recoded the item as missing.Data AnalysisAll analyses and calculations in the study were performed by APS using SAS 9.2,including the standard CAHPS analysis macro “cc250 cahps36b.sas”. Frequencies werecomputed for all the items on the survey. Due to the lengthy results for this type ofanalysis, the frequency distributions are reported in Appendix B rather than in the resultssection.The statistical analysis consisted of comparing this year’s survey results withthose from the previous administration of the survey, which was in state fiscal year (SFY)2007, using the t-test statistic for difference of means as incorporated in the standardCAHPS analysis macro.Global ratings, which used a scale of 0 to 10, measured the respondents’assessment of their health plan and the quality of the care received. APS computed themeans for each global rating and used a t-test to compare means from the SFY 2007 andJune 2009Page 6
CAHPS Child Medicaid SurveyFiscal Year 2009SFY 2009 SoonerCare Choice surveys. Four global ratings were compared between SFY2009 and SFY 2007: Overall Rating of Child’s Health Care Overall Rating of Child’s Personal Doctor Overall Rating of Child’s Specialist Overall Rating of Child’s Health PlanComposite measures combine the responses to questions that are closely related toeach other and provide more reliable results than comparing each item separately. APScomputed the mean scores for each composite and used t-tests to compare means fromthe SFY 2007 and SFY 2009 SoonerCare Choice surveys. The two composites that canbe compared are: Experiences in Getting Treatment Quickly Experiences with How Well Clinicians CommunicateBecause of changes in the CAHPS questionnaire Version 3 used in 2007 andVersion 4 used in 2009, not all of the quality measures were comparable between years;specifically, the measures “Getting Needed Care” and “Plan Information and CustomerService” are omitted from the comparison.SURVEY RESULTSTable 1 shows the response rate by method for the current year’s survey and theprevious administration of the survey from SFY 2007.Table 1. Completed Surveys Rate by Method each Survey by YearCompleted SurveysMailingPhone Follow-UpTotal Completed SurveysSFY 2009 Survey373273646SFY 2007 Survey40136437The study evaluated each returned questionnaire to determine if it met the CAHPSdefinition for a completed survey. To be considered complete, a questionnaire must haveJune 2009Page 7
CAHPS Child Medicaid SurveyFiscal Year 2009had at least one answered question. APS coded returned questionnaires that did not passthe completion criteria as non-respondents and excluded them from the analysis.Additionally, returned surveys received by TMG included refusals returned by mail andthose from SoonerCare Choice members who had moved out of state or were not in theplan.The adjusted response rate, expressed as a percentage, is the number of completedsurveys divided by the number of eligible surveys.Adjusted response rate Number of completed surveys x 100Number of eligible surveys(total completes)(Sample) –(Ineligible)6461650 – 129 x 100 42.5%The adjusted response rates for the current SoonerCare Choice survey was 42.5%;the adjusted response rates for the previous SoonerCare Choice survey was 27.6%. Thedifference in response rates may be attributable to the decision in 2009 to limit thesampling frame to participants who had a paid claim with a primary care provider.Table 2 displays the disposition of surveys deemed ineligible by number andpercentage for SFY 2009.Table 2. Number of Ineligible Surveys and Total Percentage of Ineligible Surveysfor SFY 2009Ineligible DispositionMentally/Physically IncapacitatedLanguage BarrierDoes Not Meet CriteriaTotal IneligiblesN%263641290.123.823.887.82The table above lists the number and dispositions of members from the sample who wereidentified as ineligible to participate in the survey.June 2009Page 8
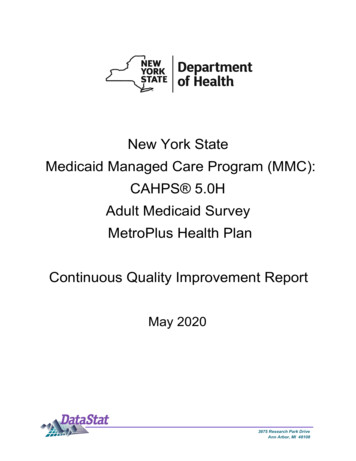
CAHPS Child Medicaid SurveyFiscal Year 2009DemographicsRespondents were asked the child’s race and ethnicity. Figure 1 shows theseresults.Figure 1. Children’s Reported Racial IdentityMultiracial 5%AfricanAmerican30.6%Results showed that Caucasians and African Americans were nearly equally representedat 32% and 31%, respectively. Native Americans represented 6.5% of the children, 5%were Asian, and one-fourth of the children were reported to be multiracial. In response toa separate question about ethnicity, parents/guardians reported 18% of the children to beHispanic or Latino.Global RatingsIn Figures 2 through 5, the overall ratings are shown for the following: The child’s health care received. The child’s personal doctor. The child’s specialist.June 2009Page 9
CAHPS Child Medicaid SurveyFiscal Year 2009 The child’s health plan.The means for the global rating items for the two years are shown in bar graphs.The table below each graph lists the number of respondents analyzed, the means, and thep-value associated with the t-test of mean difference between the two years. A p-valueless than .05 was considered statistically significant. That is, if the p-value was less than.05, the two means were statistically different from each other; otherwise, the two meanswere not statistically different.**A statistical note: The standard CAHPS analysis algorithm does not assume equal variances, but it did notcompute a difference between the OHCA results for SFY 2007 and SFY 2009. APS used SAS PROCTTEST to compute the significance of difference between years. Reported p-values are from pooled testswith equal variances assumed. Only two questions failed a test of equal variances, but the decision on thehypothesis test of equal means would have been the same with a t-test that did not assume equal variances.June 2009Page 10
CAHPS Child Medicaid SurveyFiscal Year 2009Overall Rating of Health Care Received Using any number from 0 to 10, where 0 is the worst health care possible and 10is the best health care possible, what number would you use to rate all yourchild’s health care in the last 6 months?Figure 2. Rating of Child’s Health Care 07N487341Mean8.378.34p-value.8125Figure 2 demonstrates that SoonerCare Choice parents remained fairly satisfied with thehealth care their child received in 2009 compared with the ratings in 2007. The slightincrease was not statistically significant.June 2009Page 11
CAHPS Child Medicaid SurveyFiscal Year 2009Overall Rating for Personal Doctor Using any number from 0 to 10, where 0 is the worst personal doctor possible and10 is the best personal doctor possible, what number would you use to rate yourchild’s personal doctor in the last 6 months?Figure 3. Overall Rating for Child’s Personal N527342Mean8.648.42p-value.0984Figure 3 shows that SoonerCare Choice parents were highly satisfied with their child’spersonal doctor in 2009 compared with 2007. The slight increase in satisfaction was notsignificant.June 2009Page 12
CAHPS Child Medicaid SurveyFiscal Year 2009Overall Rating for Child’s Specialist We want to know your rating of the specialist your child saw most often in the last6 months. Using any number from 0 to 10, where 0 is the worst specialistpossible and 10 is the best specialist possible, what number would you use to ratethat specialist?Figure 4. Overall Rating for Child’s 2007N12488Mean8.468.50p-value.8812Figure 4 shows that SoonerCare Choice parents were highly satisfied with their child’sspecialist doctor seen most often in 2009 compared with 2007. The slight decrease wasnot statistically significant.June 2009Page 13
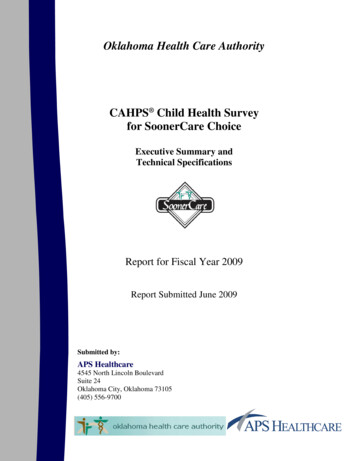
CAHPS Child Medicaid SurveyFiscal Year 2009Overall Rating for Child’s Health Plan Using any number from 0 to 10, where 0 is the worst health plan possible and 10is the best health plan possible, what number would you use to rate your child’shealth plan?Figure 5. Overall Rating for Child’s Health 28430Mean8.738.24p-value .0001Figure 5 shows that SoonerCare Choice parents were more satisfied with their child’shealth plan in 2009 compared with 2007. The increase from 2007 to 2009 wasstatistically significant.June 2009Page 14
CAHPS Child Medicaid SurveyFiscal Year 2009Composite MeasuresIn Figures 6 and 7, composite measures for the following services are provided: Experiences in getting treatment quickly Experiences with how well clinicians communicateThese questions are answered on a four-point ordinal scale, where 1 “never,” 2 “sometimes,” 3 “usually,” and 4 “always.” Responses of “never” and “sometimes”were combined into one category for the purpose of graphing since there were smallpercentages in those categories. The mean of the four-point scale was computed andcompared between years using a t-test, following standard CAHPS analysis protocol.The percentage in each category for the composite measures is shown in the bar graph.The table below each graph lists the number of respondents analyzed, the means and thep-value associated with the t-test comparison of means.June 2009Page 15
CAHPS Child Medicaid SurveyFiscal Year 2009Getting Treatment Quickly In the last 6 months, when your child needed care right away, how often did yourchild get care as soon as you thought he or she needed? In the last 6 months, not counting the times your child needed care right away,how often did you get an appointment for health care at a doctor’s office or clinicas soon as you thought your child needed?Figure 6. Getting Treatment Quickly2009 12.36% 9100%Alwaysp-value.0003Figure 6 shows that 70.28% of the respondents in 2009 reported they alwaysreceived treatment quickly. This is substantially more than in 2007 when 51.89%reported that they always received treatment quickly.June 2009Page 16
CAHPS Child Medicaid SurveyFiscal Year 2009How Well Clinicians Communicate In the last 6 months, how often did your child’s personal doctor explain things ina way that was easy to understand? In the last 6 months, how often did your child’s personal doctor listen carefully toyou? In the last 6 months, how often did your child’s personal doctor show respect forwhat you had to say? In the last 6 months, how often did your child’s personal doctor explain things ina way that was easy for your child to understand? In the last 6 months, how often did your child’s personal doctor spend enoughtime with your child?Figure 7. How Well Clinicians Communicate2009 12.62%2007 r20092007June ysp-value.3022Page 17
CAHPS Child Medicaid SurveyFiscal Year 2009Figure 7 indicates that 70.42% of members felt that their clinicians alwayscommunicated well during SFY 2009. This is an increase from 65.58% in SFY 2007;however, the increase in average score was not statistically significant.DiscussionOverall, the 2009 survey results indicated reasonably high levels of satisfactionholding steady across an array of six quality measures when compared to 2007. Twoquality measures, the rating of “Your Child’s Health Plan” and “Getting Care Quickly,”had statistically significant differences between SFY 2007 and SFY 2009. The averagerating of “Your Child’s Health Plan” on a 10-point scale increased from 8.2 to 8.7. Howmembers rate their health plan is an important indicator of plan quality. Satisfaction isinfluenced by the quality of services provided by the plan and the quality of careprovided by the plan. The composite measure of “Getting Care Quickly” on a four-pointscale had a significant increase from 3.50 to 3.55. This measure is a key indicator ofaccess to care. The ability to make appointments and see a provider is important toensuring that illness is prevented or that an existing illness does not progress further.In SFY 2009 APS introduced a new sampling methodology that involved limitingthe sampling frame to members with paid claims. Using this method, the number ofcompleted survey responses increased by 47.8% when compared to the SFY 2007. Theincrease in completed surveys also contributed to an adjusted response rate which was54% higher than the previous years. It appears to be a successful method in thatmembers utilizing SoonerCare services are more likely to have an opinion on their healthcare plan. APS recommends the OHCA continue to follow the new samplingmethodology for future surveys.June 2009Page 18
Appendix A
CAHPS Child Medicaid SurveyFiscal Year 2009Appendix BBelow are the responses by survey question.There were 646 total respondents.Frequencies depicted in the tables reflect the number of people responding to each item;percentages depicted in the tables reflect the total number of respondents to the particularquestion.1. Our records show that your child is now in SoonerCareChoice. Is that right?Q1FrequencyPercentYes639100.003. In the last 6 months, did your child have an illness,injury, or condition that needed care right away in a clinic,emergency room, or doctor’s office?June 2009Q3FrequencyPercentYes28644.55No35655.45Item Totals642100.00Page 21
CAHPS Child Medicaid SurveyFiscal Year 20094. In the last 6 months, when your child needed care rightaway, how often did your child get care as soon as youthought he or she Usually4114.64Always21376.07Item Totals280100.005. In the last 6 months, not counting the times your childneeded care right away, did you make any appointmentsfor your child’s health care at a doctor’s office or clinic?Q5FrequencyPercentYes48075.24No15824.76Item Totals638100.006. In the last 6 months, not counting the times your childneeded care right away, how often did you get anappointment for health care at a doctor’s office or clinicas soon as you thought your child needed?June sually9520.08Always30564.48Item Totals473100.00Page 22
CAHPS Child Medicaid SurveyFiscal Year 20097. In the last 6 months, not counting the times your childwent to an emergency room, how many times did he orshe go to a doctor’s office or clinic to get health 38413.154558.615487.516182.82Item Totals639100.008. In the last 6 months, how often did you and yourchild’s doctor or other health provider talk about specificthings you could do to prevent illness in your child?June 9Usually9819.68Always20741.57Item Totals498100.00Page 23
CAHPS Child Medicaid SurveyFiscal Year 20099. In the last 6 months, did your child’s doctor or otherhealth provider tell you there was more than one choicefor your child’s treatment or Item Totals492100.0010. In the last 6 months, did your child’s doctor or otherhealth provider talk with you about the pros and cons ofeach choice for your child’s treatment or health care?Q10FrequencyPercentDefinitely Yes14868.20Somewhat Yes5223.96Somewhat No115.07Definitely No62.76Item Totals217100.0011. In the last 6 months, when there was more than onechoice for your child’s treatment or healthcare, did yourchild’s doctor or other health provider ask you whichchoice you thought was best for your child?June 2009Q11FrequencyPercentDefinitely Yes13964.65Somewhat Yes5123.72Somewhat No115.12Definitely No146.51Item Totals215100.00Page 24
CAHPS Child Medicaid SurveyFiscal Year 200912. Using any number from 0 to 10, where 0 is the worsthealth care possible and 10 is the best health care possible,what number would you use to rate all your child’s healthcare in the last 6 months?Q12FrequencyPercent0 9218.8997214.7810 Best19940.86Item Totals487100.0013. A personal doctor is the one your child would see if he orshe needs a check-up or gets sick or hurt. Does your childhave a personal doctor?June 2009Q13FrequencyPercentYes53584.65No9715.35Item Totals632100.00Page 25
CAHPS Child Medicaid SurveyFiscal Year 200914. In the last 6 months, how many times did your child visithis or her personal doctor for 836211.684478.855356.596132.45Item Totals531100.0015. In the last 6 months, how often did your child’s personaldoctor explain things in a way that was easy to understand?June ually7617.80Always31774.24Item Totals427100.00Page 26
CAHPS Child Medicaid SurveyFiscal Year 200916. In the last 6 months, how often did your child’s personaldoctor listen carefully to sually6415.09Always31173.35Item Totals424100.0017. In the last 6 months, how often did your child’s personaldoctor show respect for what you had to ually4911.64Always32978.15Item Totals421100.0018. Is your child able to talk with doctors about his or herhealth care?June 2009Q18FrequencyPercentYes26362.47No15837.53Item Totals421100.00Page 27
CAHPS Child Medicaid SurveyFiscal Year 200919. In the last 6 months, how often did your child’s personaldoctor explain things in a way that was easy for your child es3011.58Usually4617.76Always16664.09Item Totals259100.0020. In the last 6 months, how often did your child’s personaldoctor spend enough time with your 18Usually9622.48Always26662.30Item Totals427100.0021. In the last 6 months, did your child’s personal doctor talk withyou about how your child is feeling, growing, or behaving?June 2009Q21FrequencyPercentYes35784.60No6515.40Item Totals422100.00Page 28
CAHPS Child Medicaid SurveyFiscal Year 200922. In the last 6 months, did your child get care from a doctor orother health provider besides his or her personal m Totals423100.0023. In the last 6 months, how often did your child’s personaldoctor seem informed and up-to-date about the care your childgot from these doctors or other health care providers?June Usually4827.91Always8851.16Item Totals172100.00Page 29
CAHPS Child Medicaid SurveyFiscal Year 200924. Using any number from 0 to 10, where 0 is the worst personaldoctor possible and 10 is the best personal doctor possible, whatnumber would you use to rate your child’s personal doctor?Q24FrequencyPercent0 356.6487313.8598115.3710 Best26951.04Item Totals527100.0025. Specialists are doctors like surgeons, heart doctors, allergydoctors, skin doctors, and other doctors who specialize in one areaof health care. In the last 6 months, did you try to make anyappointments for your child to see a specialist?June 2009Q25FrequencyPercentYes15023.51No48876.49Item Totals638100.00Page 30
CAHPS Child Medicaid SurveyFiscal Year 200926. In the last 6 months, how often was it easy to getappointments for your child with s3221.62Usually4228.38Always6342.57Item Totals148100.0027. How many specialists has your child seen in the last 6months?June .36421.34532.01Item Totals149100.00Page 31
CAHPS Child Medicaid SurveyFiscal Year 200928. Using any number from 0 to 10, where 0 is the worst specialistpossible and 10 is the best specialist possible, what number wouldyou use to rate that specialist?Q28FrequencyPercent0 92116.9410 Best5645.16Item Totals124100.0029. In the last 6 months, did you try to get any kind of care,tests, or treatment for your child through his or her healthplan?June 2009Q29FrequencyPercentYes23938.00No39062.00Item Totals629100.00Page 32
CAHPS Child Medicaid SurveyFiscal Year 200930. In the last 6 months, how often was it easy to get the care,tests, or treatment you thought your child needed through hisor her health 4Usually5924.89Always13757.81Item Totals237100.0031. In the last 6 months, did you try to get information or helpfrom customer service at your child’s health plan?Q31FrequencyPercentYes7812.40No55187.60Item Totals629100.0032. In the last 6 months, how often did customer service atyour child’s health plan give you the information or help youneeded?June sually2331.08Always2939.19Item Totals74100.00Page 33
CAHPS Child Medicaid SurveyFiscal Year 200933. In the last 6 months, how often did customer service staffat your child’s health plan treat you with courtesy 115.49Usually1521.13Always4259.15Item Totals71100.0034. In the last 6 months, did your child’s health plan give youany forms to fill out?Q34FrequencyPercentYes15424.96No46375.04Item Totals617100.0035. In the last 6 months, how often were the forms from yourchild’s health plan easy to fill out?June sually5033.56Always8053.69Item Totals149100.00Page 34
CAHPS Child Medicaid SurveyFiscal Year 200936. Using any number from 0 to 10, where 0 is the worst healthplan possible and 10 is the best health plan possible, whatnumber would you use to rate your child’s health 294.627396.21811718.6399715.4510 Best30348.25Item Totals628100.0037. In general, how would you rate your child’s overall health?June 2009Q37FrequencyPercentExcellent24338.15Very Good23036.11Good12619.78Fair345.34Poor40.63Item Totals637100.00Page 35
CAHPS Child Medicaid SurveyFiscal Year 200938. What is your child’s 511294.7512243.9313304.9
RAND, and the Research Triangle Institute. The health care community has accepted . The Child CAHPS Health Plan Survey 4.0 questionnaire (shown in Appendix A) was administered by The Myers Group (TMG) between August 1 and November 1, 2009. The questionnaire covered several aspects of health plan performance, including: