Transcription
How to ReportResults of the CAHPSClinician & Group Survey
How to Report Results of the CAHPS Clinician & Group SurveyPrefaceThe guidance offered in this document brings together and builds on the work of severalorganizations. The American Institutes for Research (AIR ) took the lead on developing andtesting the alternative labels, descriptions, and displays with consumers. AIR also contractedwith Lise Rybowski of The Severyn Group to author this document.The effort to refine the composite labels expands ontesting done in 2005 and 2006 by a team of CAHPSresearchers associated with Harvard, RAND, and AIRto develop and name the composite measures for thissurvey. The current incarnation of that team,composed of researchers associated with Yale andRAND, provided input into the guidance and servedas reviewers. AIR also received feedback fromShoshanna Sofaer, DrPH, and Judith Hibbard, DrPH,who are nationally recognized experts in consumerreporting with more than 13 years of experienceworking with CAHPS measures.The following related materials from theRobert Wood Johnson Foundation areavailable at: www.forces4quality.org. The Case for Measuring PatientExperience Strategies for Implementing aCommunity-Wide CAHPS Clinician &Group Survey How to Display ComparativeInformation That People CanUnderstand and UseThe work of AIR and its subcontractors was sponsored by the National Program Office of theRobert Wood Johnson Foundation’s Aligning Forces for Quality (AF4Q) program.AIR provides technical assistance for Aligning Forces for Quality, a national initiative of the Robert Wood Johnson Foundationi
How to Report Results of the CAHPS Clinician & Group SurveyContentsPreface . iContents . iiIntroduction . 1What Will You Find in This Guide? . 2What You Need to Know About Measures From the CAHPS Clinician & Group Survey . 2Labeling and Describing the CAHPS Measures . 4Choosing the Scores to Report . 6Preparing to Report Survey Scores: Analysis of Survey Data. 6Reporting the Average Score for an Individual Provider . 7Reporting the Top Box Score for an Individual Provider . 9How to Choose. 10Choosing a Display Strategy . 11Providing a Summary Score . 11Displaying CAHPS Measures Side by Side . 12Two Considerations in Choosing a Display . 16Need Help? . 18Implementing the CAHPS Clinician & Group Survey . 18Displaying Comparative Information on Quality . 18Appendix A: Survey Items Included in Each Measure . 19Appendix B: Findings from Cognitive Testing of Labels . 21AIR provides technical assistance for Aligning Forces for Quality, a national initiative of the Robert Wood Johnson Foundationii
How to Report Results of the CAHPS Clinician & Group SurveyIntroductionTo better assess and compare the quality of health care, many organizations have started toadminister the Consumer Assessment of Healthcare Providers and System (CAHPS ) Clinician& Group Survey (CG-CAHPS), which asks patients to report on their experiences with doctorsand their staff. The survey includes versions for patients receiving primary care, specialty care,and pediatric care. (See the box below for links to more information about this CAHPS survey.)Endorsed by the National Quality Forum in 2007, this standardized survey is increasinglybecoming the instrument of choice for multi-stakeholder collaborative organizations, healthsystems, health plans, and medical groups to evaluate and improve the care patients receive. Insome cases, use of this survey is a requirement. Both the Robert Wood Johnson Foundation’sAligning Forces for Quality (AF4Q) program and the Agency for Healthcare Research andQuality’s Chartered Value Exchange initiative (CVEs) expect communities to measure, report,and improve patient experience with physicians. Several Alliances and CVEs are alreadyreporting this information, and others are close to achieving this objective.Learn About the CAHPS Clinician & Group SurveyThe CAHPS Clinician & Group Survey is part of a larger family of surveys known as CAHPS:Consumer Assessment of Healthcare Providers and Systems. The U.S. Agency forHealthcare Research and Quality sponsors the development of CAHPS surveys andsupporting materials, all of which are in the public domain.ResourcesTo learn about the CAHPS erview/OVER Intro.aspTo learn about the CAHPS Clinician & Group /CG/PROD CG CG40Products.aspTo see the Adult Primary Care files/351a-6 AdultPrim Eng 6pt V1.pdfTo see all of the survey instruments and implementation guidance in the CAHPS Clinician &Group Survey and Reporting eQx.aspThe development of this and other CAHPS surveys is an ongoing process. New and updatedsurveys are released over time as the survey developers make changes that address findingsfrom research and feedback from users.AIR provides technical assistance for Aligning Forces for Quality, a national initiative of the Robert Wood Johnson Foundation1
How to Report Results of the CAHPS Clinician & Group SurveyWhat Will You Find in This Guide?This guide is designed to advance and assist the growing movement to report CAHPS surveyresults to health care consumers who have consistently expressed an interest in this kind ofcomparative information. 1,2,3 By giving consumers access to the CAHPS survey results, thesurvey sponsors aim to make consumers more informed about local physicians, better equipped tochoose physicians and/or groups that meet their needs, and more engaged in decisions about theirown care.Read the guide to learn: What survey-derived information you can report. The surveys include threecomposite measures about care for adults, five composite measures about care forchildren, and a rating of the doctor on a scale of 0 to 10. How to label and describe the measures. This guide presents the option of a short orlong label for each of the CAHPS measures. It also suggests text you can use to describeeach measure for those who want more information. All of this text has been tested withconsumers to ensure readability and ease of understanding. What scores you can report for these measures. The two most suitable methods forcalculating scores based on the survey results are “top box” scoring and average scoring,both of which have strengths and weaknesses. How to display the scores for consumers. Users of the CAHPS survey can chooseamong three recommended strategies for displaying results in a way that facilitatesunderstanding and use by consumers.What You Need to Know About Measures From the CAHPSClinician & Group SurveyThe measures you report are derived from “core items.” All CAHPS surveys include a coreset of items that must be included in the survey. The use of core items is critical to ensuring thecollection of standardized data, which is what makes it possible to report comparable measures.Appendix A lists the items included in each of the measures.Most of the CAHPS measures for reporting are composites. A composite measure iscomposed of two or more survey items (i.e., questions) that are highly related both conceptuallyand statistically. Composite measures are useful for the public reporting of survey results123Fung CH, Elliott MN, Hays RD, et al. Patients' Preferences for Technical versus Interpersonal Quality WhenSelecting a Primary Care Physician. Health Serv Res. 2005 Aug.; 40(4): 957–977.McGee J, Kanouse DE, Sofaer S, Hargraves JL, Hoy E, Kleimann S. Making Survey Results Easy to Report toConsumers: How Reporting Needs Guided Survey Design in CAHPS. Medical Care. 37(3). Supplement:Consumer Assessment of Health Plans Study (CAHPS ) Mar., 1999: MS32-MS40.Sofaer S, Crofton C, Goldstein E, Hoy E, Crabb J. What Do Consumers Want to Know About the Quality of Carein Hospitals? Health Services Research. 2005 Dec.40(6, pt. 2): 2018-36.AIR provides technical assistance for Aligning Forces for Quality, a national initiative of the Robert Wood Johnson Foundation2
How to Report Results of the CAHPS Clinician & Group Surveybecause they efficiently summarize what would otherwise be a large amount of data. Thisapproach makes it easier for users to understand and interpret the data display. The only measurefor this survey that is not a composite is a rating measure, which is based on responses to aquestion that asks for a rating of the doctor on a scale of 0 to 10.For the Adult Primary Care and Specialty Care Survey, you can report four measures: Three composite measures on the timeliness of care, communication with doctors, andinteractions with office staff. One overall rating of the doctor on a scale of 0 to 10.To develop these measures, the CAHPS researchers conducted cognitive testing with consumersand statistical testing called psychometric analysis. The psychometric analysis was aimed atensuring that the measures are valid, which means they assess what they are intended to assess,and reliable, which means they perform consistently and with minimal errors. Cognitive testingconfirmed that consumers agreed with the groupings of items into composite measures and couldunderstand and interpret the measures.The Child Primary Care Survey adds two more measures for reporting. The survey versionthat asks parents about their children’s experiences with care includes some additional core itemsthat can be combined into two more composite measures, one that focuses on the doctor’sattention to the child’s development and another that focuses on health education from thedoctor.With the exception of the rating measure, the public reporting of scores for individual surveyitems is not recommended. This level of information is useful to health care providers who aretrying to identify the areas in which they need to improve. It provides too much detail, however,for consumers who are trying to look for patterns in performance. 4You’ll find recommended labels and descriptions for all six of the above measures in the nextsection of this guide. Some organizations report other measures they have developed themselvesby combining core and supplemental items from the CAHPS survey. 5 This document does notspecifically address the use of these non-standard measures, other than to recommend applyingthe guidance on displaying results consistently across all measures.45McGee J, Kanouse DE, Sofaer S, Hargraves JL, Hoy E, Kleimann S. Making survey results easy to report toconsumers: How reporting needs guided survey design in CAHPS. Med Care 1999 Mar; 37(3 care/Abstract/1999/03001/Making Survey Results Easy to Reportto Consumers 4.aspx.Survey sponsors may customize the surveys by adding items, whether drawn from “supplemental item sets”packaged with the CAHPS surveys or other sources. The supplemental item sets can be downloaded from theCAHPS Clinician & Group Survey and Reporting Kit: asp .AIR provides technical assistance for Aligning Forces for Quality, a national initiative of the Robert Wood Johnson Foundation3
How to Report Results of the CAHPS Clinician & Group SurveyLabeling and Describing the CAHPS MeasuresThis section presents recommended labels and descriptions for the measures derived from theCAHPS Clinician & Group Survey. Both the labels—which build on the original CAHPScomposite labels—and the descriptions were tested with consumers in June 2010. Appendix Bexplains the testing process, lists all of the labels that were tested, and summarizes the findings.This recent usability testing found that although longer labels helped consumers betterunderstand the measures, shorter labels were also effective in communicating the meaning ofeach measure. Given the space constraints in a table where measures are listed side by side,shorter labels are often a more practical choice. The table below shows both label options foreach measure.Although the labels are intended to make the measures self-explanatory, some users of yourreport may want a more detailed explanation. You can display the suggested descriptions whenthe user rolls the mouse over the label or clicks on a “What is this?” link.Please note that the descriptions of the measures vary slightly if the survey questions ask about arecent visit rather than care over the last 12 months. Some users of the Clinician & Group Surveyhave adopted a draft version known as the Visit Survey that asks patients to report if certainthings happened during a recent visit, rather than how often they happened over the last 12months. This variation in the questions does not affect the label for the composites.AIR provides technical assistance for Aligning Forces for Quality, a national initiative of the Robert Wood Johnson Foundation4
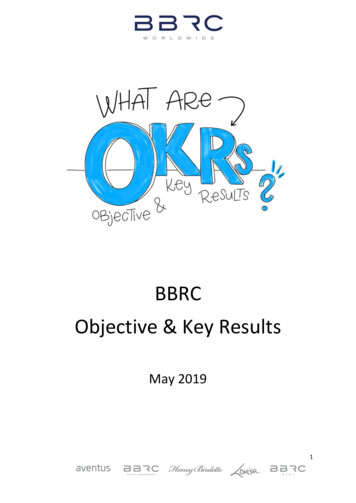
How to Report Results of the CAHPS Clinician & Group SurveyCAHPS Clinician & Group Survey: Measure Labels and DescriptionsOriginal CAHPSLabelsRecommended LabelsLong VersionShort VersionRecommended Description of the MeasureFor a summary score:Patient Survey ResultsPatients answered a survey about their experiences at their doctors’ offices. (Ifyou display a summary score, add:) The information shown here combines theiranswers into one score.GettingAppointmentsand Health CareWhen NeededGetting TimelyAppointments,Care, andInformationWe were unableto identify aneffectiveshorter labelThe survey asked patients how often they got appointments for care as soon asneeded and timely answers to questions when they called the office.How WellDoctorsCommunicateHow Well DoctorsCommunicateWith PatientsDoctor–PatientCommunication(12-month version): The survey asked patients how often their doctors explainedthings clearly, listened carefully, showed respect, provided easy-to-understandinstructions, knew their medical history, and spent enough time with the patient.The survey also asked patients how often they saw the doctor within 15 minutesof their appointment time.(Visit version): The survey asked patients if their doctors explained thingsclearly, listened carefully, showed respect, provided easy to understandinstructions, knew their medical history, showed respect, and spent enough timewith the patient.Courteous andHelpful OfficeStaffHelpful,Courteous, andRespectful OfficeStaffCourteous andHelpful OfficeStaff(12-month version): The survey asked patients how often office staff werehelpful and treated them with courtesy and respect.Doctor’sAttention to YourChild’s Growthand DevelopmentDoctor’s Attentionto Your Child’sGrowth andDevelopmentChild’s GrowthandDevelopmentThe survey asked parents if the doctor talked about their child’s growth,behaviors, moods and emotions, and ability to learn and get along with others.Doctor’s Adviceon Keeping YourChild Safe andHealthyDoctor’s Adviceon Keeping YourChild Safe andHealthyChild’s Healthand SafetyThe survey asked parents if the doctor talked about keeping their child fromgetting injured, the food the child eats, physical activity, and household problems.Overall Rating ofthe DoctorPatients’ Ratingof the DoctorRating of theDoctor(Visit version): The survey asked patients if office staff were helpful and treatedthem with courtesy and respect.The survey also asked parents if the doctor gave printed handouts or booklets onkeeping their child from getting injured.The survey asked patients to rate their doctors on a scale of 0 to 10, with 0 beingthe worst and 10 being the best.AIR provides technical assistance for Aligning Forces for Quality, a national initiative of the Robert Wood Johnson Foundation5
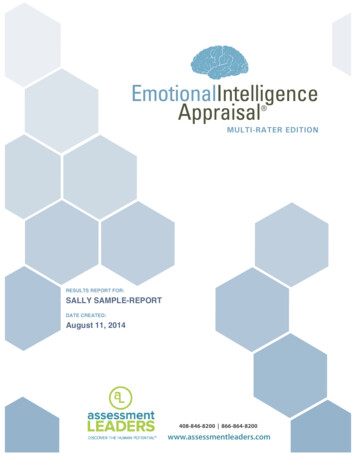
How to Report Results of the CAHPS Clinician & Group SurveyChoosing the Scores to ReportThis section explains two approaches to creating scores for CAHPS measures and discusses howthose scoring strategies relate to the recommended display strategies in the next section.Preparing to Report Survey Scores: Analysis of Survey DataAfter you or your survey vendor collects the responses to the patient experience survey, the nextstep is to analyze the data. To conduct this analysis, you can use a free set of programs known asthe CAHPS macro; the CAHPS macro and instructions for using the programs are available inthe CAHPS Clinician & Group Survey and Reporting Kit: asp.The programs will generate a distribution of survey results for each of the measures. That is, foreach physician group or individual physician, you can see the percentage of patients who fall intoeach of the response categories for a given measure.For illustrative purposes, consider the following distribution of results for a measure that uses thesix-point frequency scale:Example:Distribution of Responses for a Single Composite MeasureResponse Categories for the Six-Point Frequency ScaleDoctor’s AlwaysApplewiseHealth Center7.03%1.60%4.00%7.90%33.16%46.30%Brackburg Clinic3.93%1.79%4.18%10.22%29.68%50.20%Classor om MedicalCenter2.05%0.89%6.25%11.52%24.97%54.32%This level of detail would be difficult for most consumers to understand, interpret, or use.Although there are a few ways to report a single score for the measure, two methods arerecommended: Average score: The mean across all of the response categories. “Top box” score: The percentage of responses in the most positive response categories.The rest of this section discusses what you would report using each of these two methods andwhat you need to consider when deciding which method to use.AIR provides technical assistance for Aligning Forces for Quality, a national initiative of the Robert Wood Johnson Foundation6
How to Report Results of the CAHPS Clinician & Group SurveyReporting the Average Score for an Individual ProviderThe average score is a calculation of the mean across all of the response categories. To apply thismethod, you treat the response options as points on a linear or interval scale where the intervalsbetween the options are equal (for example, the difference between “Never” and “Sometimes” isthe same as the difference between “Sometimes” and “Usually”).Response Categories Included in Calculations of the Average ScoreResponse CategoriesVersion of theCAHPS Clinician &Group SurveyQuestions thatask aboutfrequency:Questions that askwhether somethinghappened:Question thatasks for a ratingof the doctor:12–month version:Four-point frequencyscaleNeverSometimesUsuallyAlwaysNoYes0 (Worst) – 10 (Best)12–month version:Six-point frequencyscaleNeverAlmost neverSometimesUsuallyAlmost alwaysAlwaysNoYes0 (Worst) – 10 (Best)Visit versionNeverSometimesUsuallyAlwaysNoYes, somewhatYes, definitely0 (Worst) – 10 (Best)In the distribution of responses in the table on the previous page, the average score for eachprovider on that measure would be based on the scores reported for each of the six responsecategories. The analysis programs in the CAHPS macro calculate these averages by convertingthe response options to a numerical scale (for example, the expanded “Never to Always” scalebecomes “1 to 6”). Converting the scores for different measures to a 0 to 100 scale makes themconsistent, easier to report, and easier for consumers to understand.AIR provides technical assistance for Aligning Forces for Quality, a national initiative of the Robert Wood Johnson Foundation7
How to Report Results of the CAHPS Clinician & Group SurveyExample:Average ScoresAverage ScoresScale of1 to 6Converted to a Scale of 0 to 100(for display purposes)Applewise Health Center4.8481Brackburg Clinic5.0885Classor Medical Associates5.4691Duraho Associates5.2588Ezrom Medical Center5.1786Doctor’s OfficeAdvantages of Average Scoring The average score reflects the full range of patients’ experiences with care. Two doctorswith the same top box score but different scores in the other response categories maylook very different when the average scores are calculated. Because it uses all of the information and does not blur the distinctions between any ofthe response categories, the average score provides a more precise measure ofperformance. Because it is a more precise measure, consumers are getting a more accurate assessmentof whether the performance of a given provider is truly above or below average.Disadvantages of Average Scoring Compared to top box scores for a set of providers, the average scores for the sameproviders are often more compressed into a small part of the 0 to 100 range. Thiscompressed range for average scores may lead consumers to believe that scores do notvary much across providers. Users are less or not at all aware of the actual answers to the survey questions, whichdiffer from question to question.AIR provides technical assistance for Aligning Forces for Quality, a national initiative of the Robert Wood Johnson Foundation8
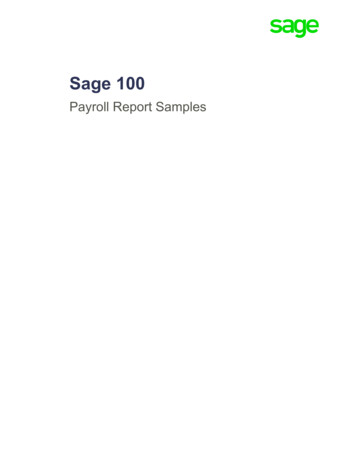
How to Report Results of the CAHPS Clinician & Group SurveyReporting the Top Box Score for an Individual ProviderThe “top box” score refers to the percentage of patients whose responses indicated excellentperformance for a given measure. This approach is a kind of categorical scoring because theemphasis is on the score for a specific category of responses. 6Top Box Response CategoriesResponse Categories That Indicate a High Level of PerformanceQuestions that ask aboutfrequency:Always (four-point frequencyscale)Always Almost always(six-point frequency scale)Questions that ask whethersomething happened:Question that asks for a ratingof the doctor:9 and 10 combined 7YesYes, definitely(Response category in theVisit Survey only)Using the distribution of responses in the table on page 5, the top box scores could be the figuresin the “Always” column or a combination of the scores for “Almost always” and “Always.”Because these figures could be used for public reporting, we have rounded them to the nearestinteger.Example:“Top Box” ScoresTop Box ScoresAlwaysAlways AlmostalwaysApplewise Health Center46%79%Brackburg Clinic50%80%Classor Medical Associates55%86%Duraho Associates64%83%Ezrom Medical Center54%79%Doctor’s Office67Another kind of categorical scoring is “bottom box” scoring, which focuses on the scores at the low end of thescale. This approach also has value to consumers, in part because consumers often respond more to the fear ofproviders with poor performance than to the benefits of providers with strong performance. Reporting the bottombox score would make the CAHPS score more like a safety score, in that you would be helping people anticipatewhere things could go wrong. To address this interest in the lower end of the scale, the Centers for Medicare &Medicaid Services (CMS) offers users the option of viewing the distribution of scores for the CAHPS HospitalSurvey.For the 0 to 10 rating of the doctor, the CAHPS development team recommends combining the percentage ofrespondents who rated their doctors “9” or “10.” Research found that this combination resulted in bettercomparability of data across respondents who vary by race or ethnicity, socioeconomic status, and othersociodemographic factors.AIR provides technical assistance for Aligning Forces for Quality, a national initiative of the Robert Wood Johnson Foundation9
How to Report Results of the CAHPS Clinician & Group SurveyAdvantages of Top Box Scoring The top box score is easier to explain and for consumers to understand.o The score is simply the percentage of patients who gave a particular response to aset of questions.o The score involves just one number rather than a statistical calculation based onmultiple numbers. The top box score may make it easier for consumers to identify the providers with whompatients most often have the best experience. Top box scoring is a popular choice because it is similar to the reporting of processmeasures, which also have a numerator and denominator.Disadvantages of Top Box Scoring Top box scoring produces a less precise measure of performance because it does not useall of the information in the scale and it treats the other options (for example, Never,Sometimes, and Usually) as if they are the same—that is, as if “Usually” is no better orworse than “Never.” Because top box scoring is a less precise method, it is necessary to have a larger samplesize for the survey than one would need to calculate an average score. Because the top box score focuses on just one end of the scale, the user of the informationhas no idea what is happening in the rest of the distribution. Two providers with the sametop box score could have very different scores in the remaining categories.How to ChooseNo scoring method is right for everyone. To decide which score is most suitable for your report,consider the following questions: Will you display how providers perform relative to each other? The next sectiondiscusses three recommended display options, two of which involve using symbols toshow consumers how physicians or groups perform relative to one another. For thesedisplays, average scores offer a more accurate measure of the full range of performancewhether you are reporting composite measures or the overall rating. Will you display numerical scores for each provider? The third recommended displayoption shows consumers the actual score for each physician or group, often in the form ofa bar chart. For these displays, you could report either kind of score—but the top boxscores are easier to explain and more compatible with clinical measures presented in thesame format. Do your stakeholders in the reporting project have strong preferences? Because theCAHPS Clinician & Group Survey is still new to most communities, the preferences ofstakeholders—particularly physicians—often determine the scoring method. TheirAIR provides technical assistance for Aligning Forces for Quality, a national initiative of the Robert Wood Johnson Foundation10
How to Report Results of the CAHPS Clinician & Group Surveypreferences may change over time as they become more familiar with the surveys andmore comfortable with how the information is presented to and received by consumers.Choosing a Display StrategyThis section discusses the optional use of a summary score andrecommends a few ways to display the results of the CAHPSClinician & Group Survey: Table with word icons Table with graphic symbols Bar chartsFor more detailed informationon displaying comparativeperformance data see:How to Display ComparativeInformation That People CanUnderstand and UseAvailable from the RobertIn offering these alternative approaches, the authors recognizeWood Johnson Foundation at:that not everyone is ready or willing to highlight differences inwww.forces4quality.org.physician- or practice-level performance. That said, whenselecting a display strategy, we encourage you to focus on the message you want consumers inyour audience to take away from the information and how you want them to use the information.If your display does not support those messages or uses, you may need to consider thealternatives.Also, please note that while this guidance is specific to the Clinician & Group Survey, it can beapplied to other CAHPS surveys of patient experience as well.Providing a Summary ScoreA summary score is a useful and effective strategy for making multiple quality measures easierfor consumers to digest. While this CAHPS survey may produce only a handful of measures,providing scores for all of the doctors’ offices creates a display with a great deal of information.A summary score for the CAHPS Clinician & Group Survey would combine all of the measuresbeing reported: the three composite measures (five, if reporting on children’s experiences withcare) and the overall rating of the doctor.8 After reviewing this score, users should have theoption of seeing the scores for the individual measures.8For guidance on calculating a summary score, contact the CAHPS User Network at cahps1@ahrq.gov. Also see: Lehrman W.et al. Characteristics of Hospitals Demonstrating Superior Performance in Patient Experience and Clinical Process Measures ofCare. Medical Care Research and Review, 2010 Feb. 67 (1); 38-55.AIR provides technical assistance for Aligning Forces for Quality, a national initiative of the Robert Wood Johnson Foundation11
How to Report Res
Consumers: How Reporting Needs Guided Survey Design in CAHPS. Medical Care. 37(3). Supplement: Consumer Assessment of Health Plans Study (CAHPS ) Mar., 1999: MS32-MS40. 3. Sofaer S, Crofton C, Goldstein E, Hoy E, Crabb J. What Do Consumers Want to Know About the Quality of Care in Hospitals? Health Services Research. 2005 Dec.40(6, pt. 2 .